

1/ A new kind of post from me - a closer look at a trading concept.
First up, stop runs.
Feedback appreciate via poll at the end.
First up, stop runs.
Feedback appreciate via poll at the end.
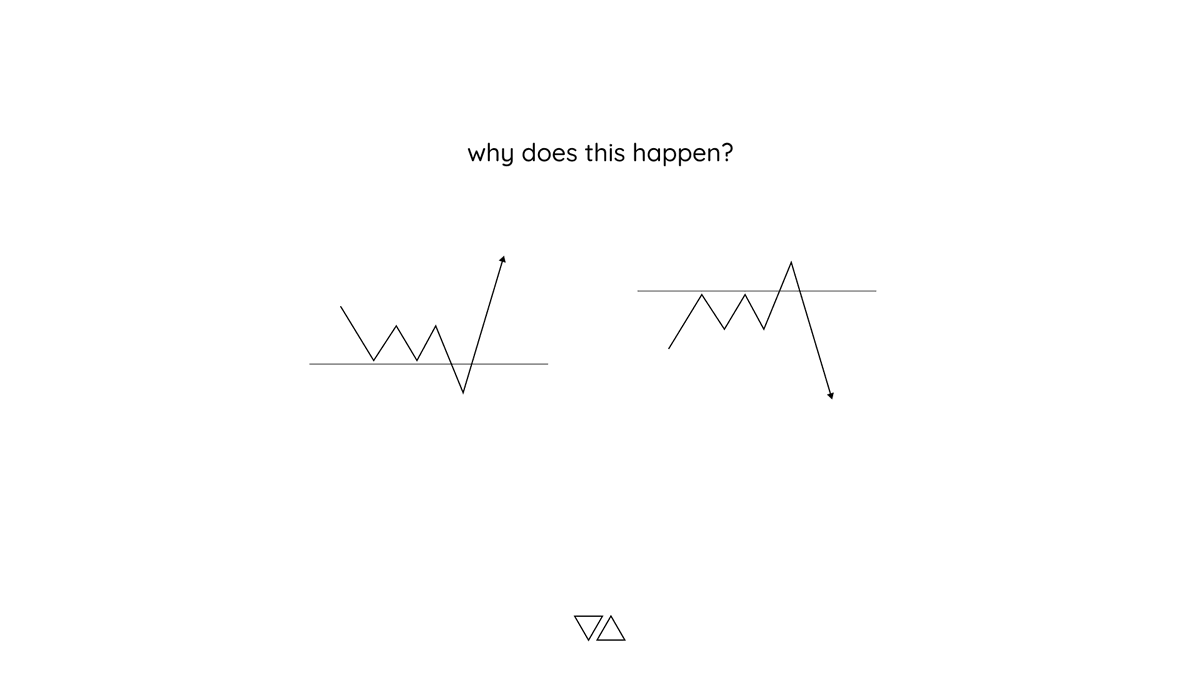
2/ Sometimes it can feel like the market is just trying to screw you over. Price stops you out before going to your target or reverses immediately after you enter. Here's a look at some of the reasons that may happen:
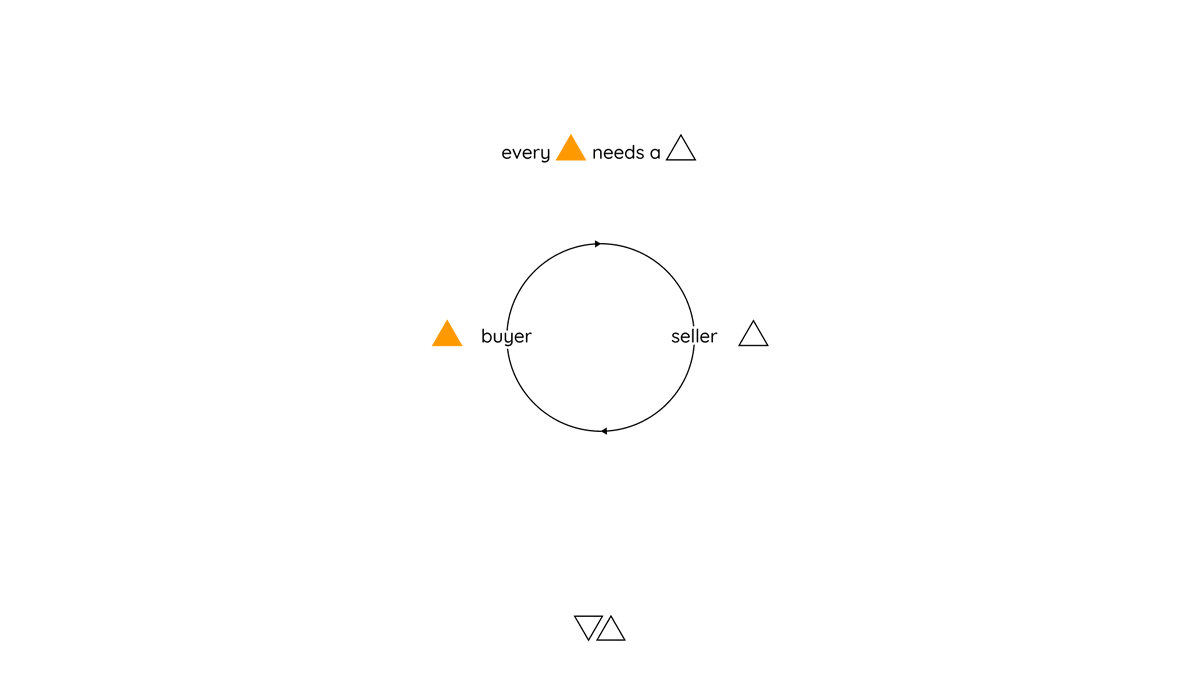
3/ Starting with the basics, every buyer needs a seller, and vice versa. The balance between supply (sellers) and demand (buyers) is what gives the market direction.
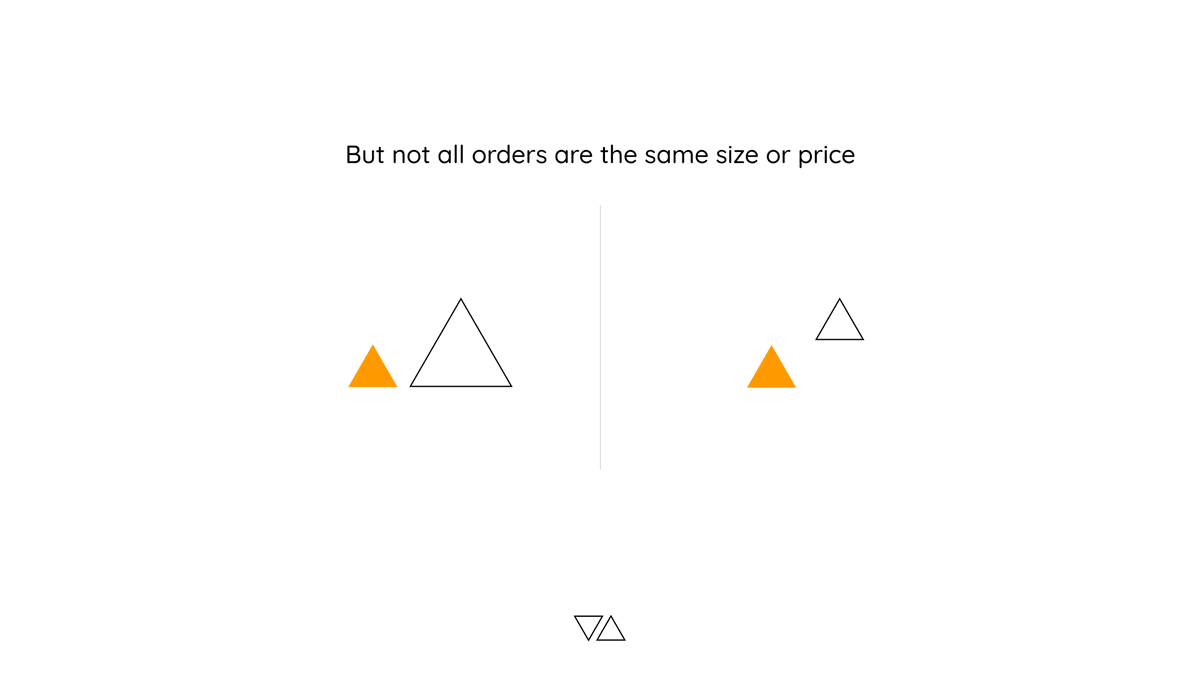
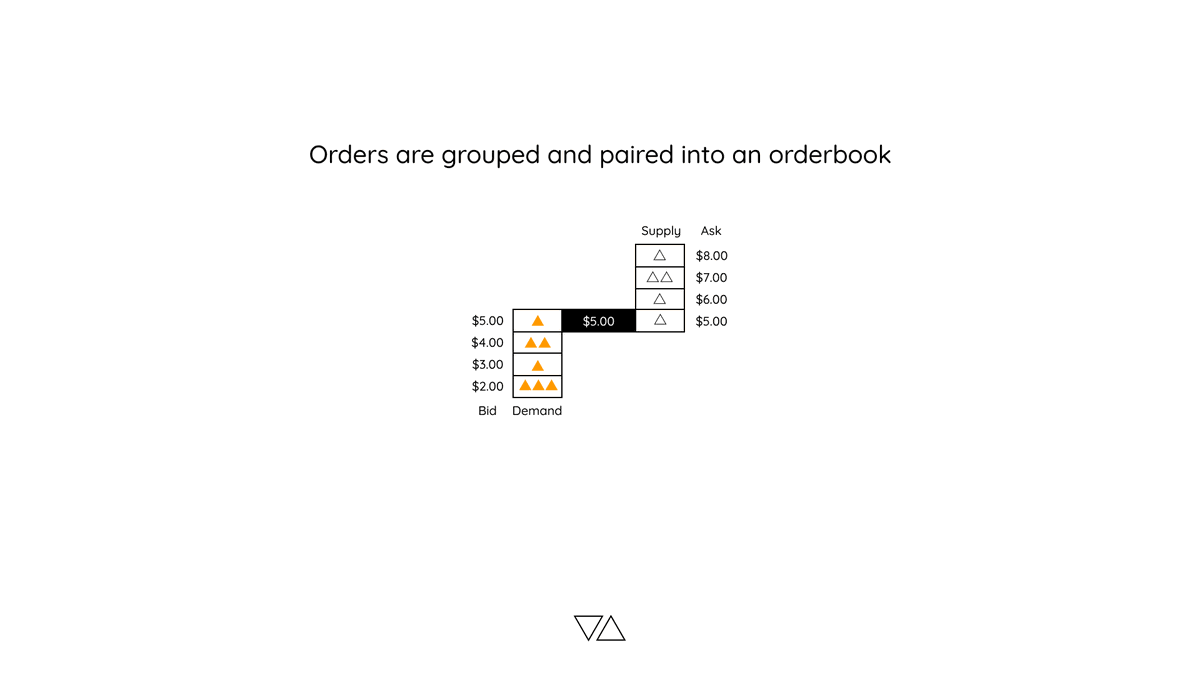
4/ Obviously not all orders are the same size or set at the same price. This is what gives market depth - how much demand or supply there is for an asset at a given price.
5/ This demand and supply can be seen via the orderbook, where they meet at the current/last market price. The difference between the highest bid and lowest ask is the spread.
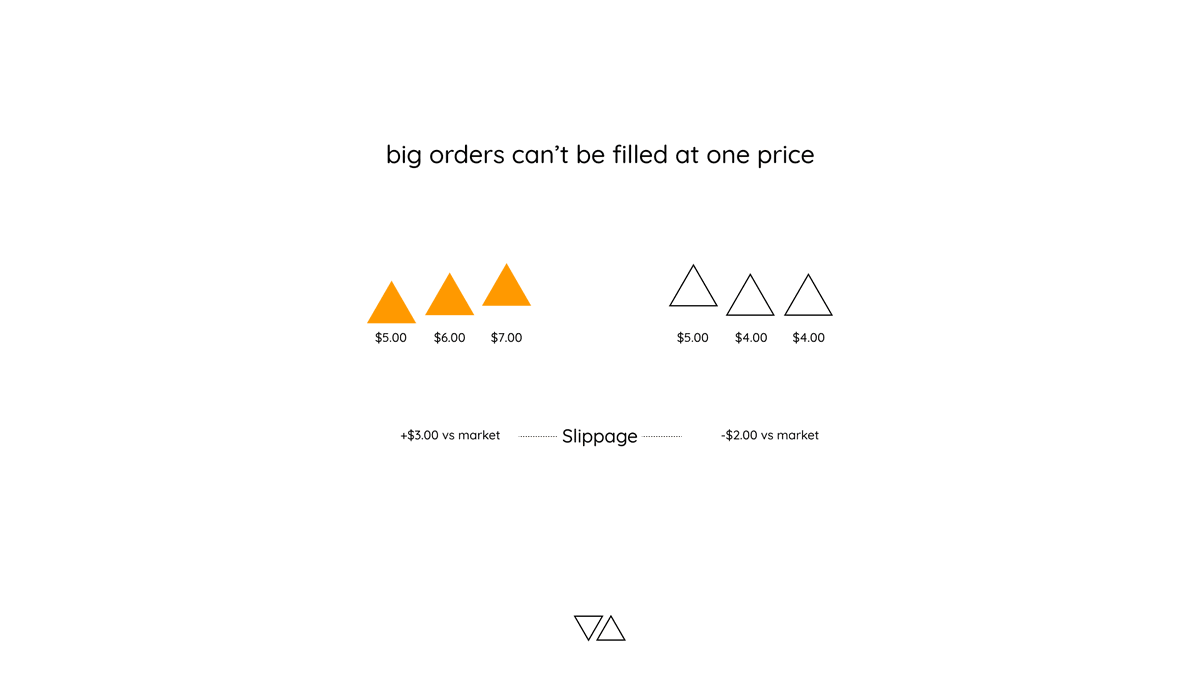
6/ Insufficient supply or demand at a price causes big orders to slip when executing, as they search for the next lowest ask or highest bid. This is inefficient as it pushes the market away from the desired price.
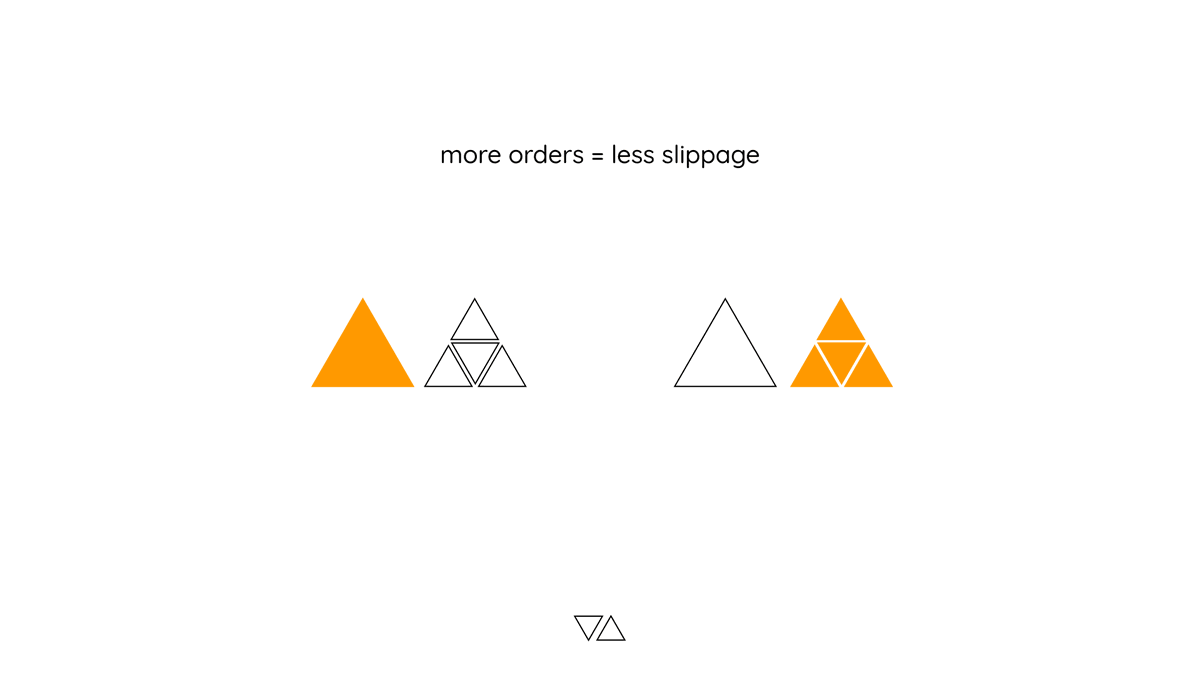
7/ Slippage can be reduced by finding price levels where the market has a lot of orders (liquidity). For example, lots of small sell orders could allow a large buy to execute without much slippage.
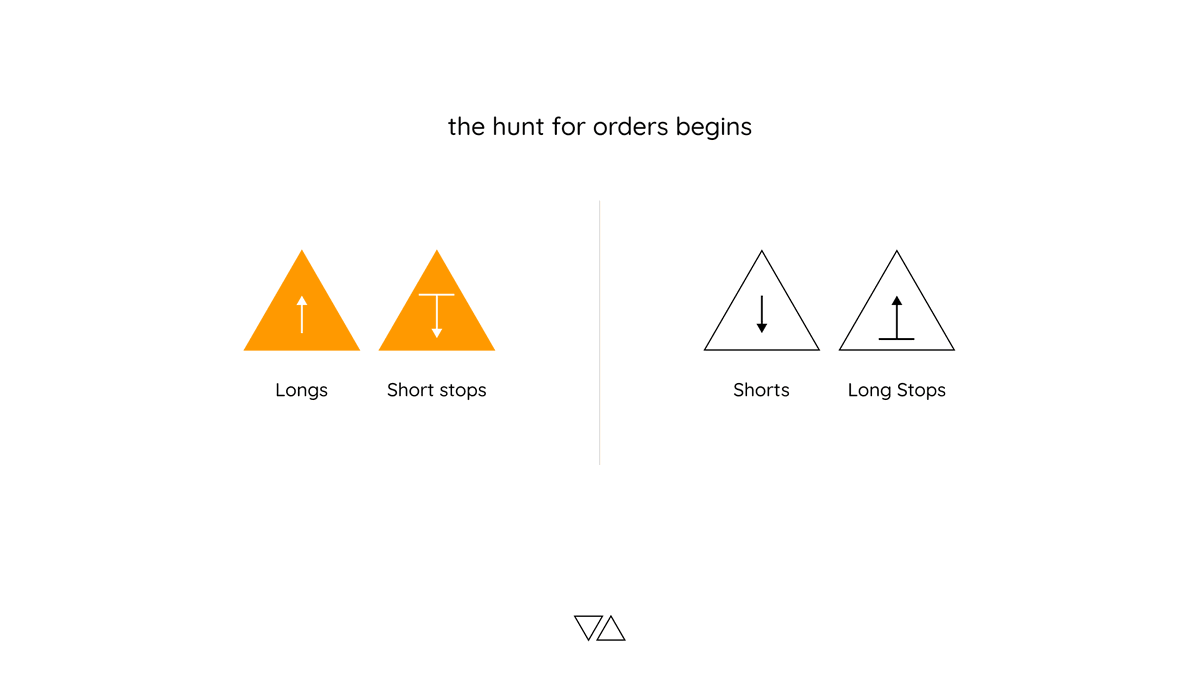
8/ There are generally two types of buy and sell orders. Basic longs/shorts are simple enough. Add to these, stop losses - a trader stopping out of a short position has to buy and stopping out of a long is forced to sell.
9/ So, where can you find a lot of orders? Generally at range highs and lows. As price ranges, breakout traders and range traders both set orders just outside of the range.
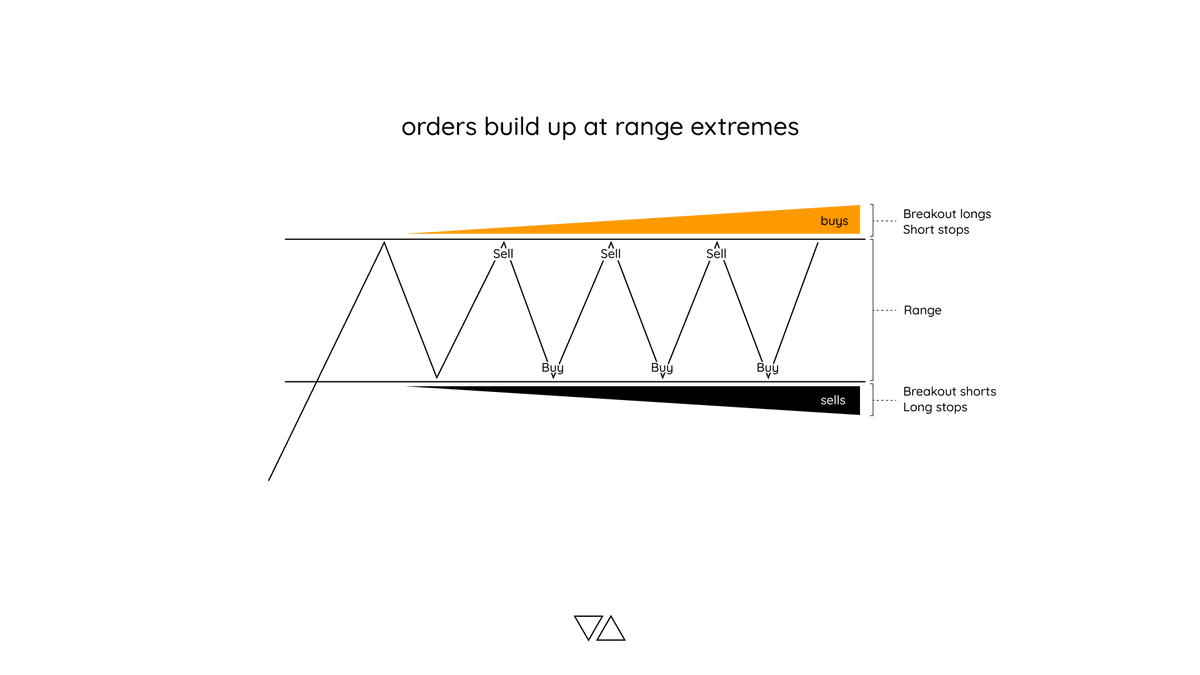
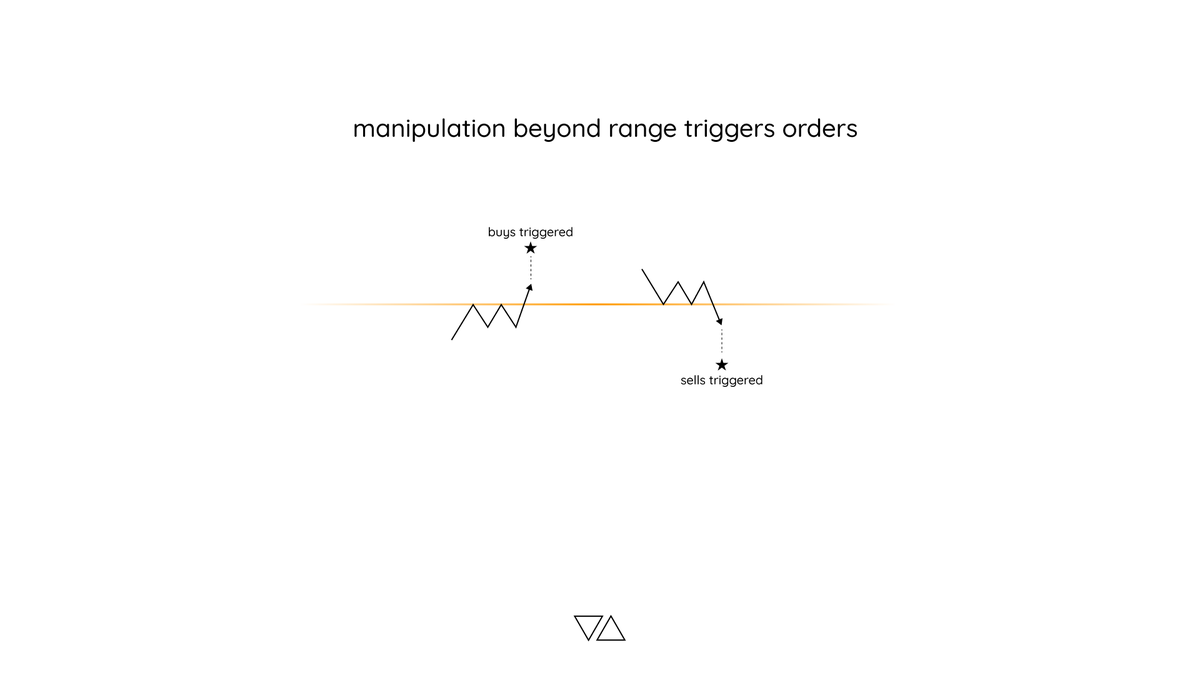
10/ Price is manipulated outside of the range where the buy/sell orders trigger. These orders provide liquidity for large positions to enter/exit without much slippage.
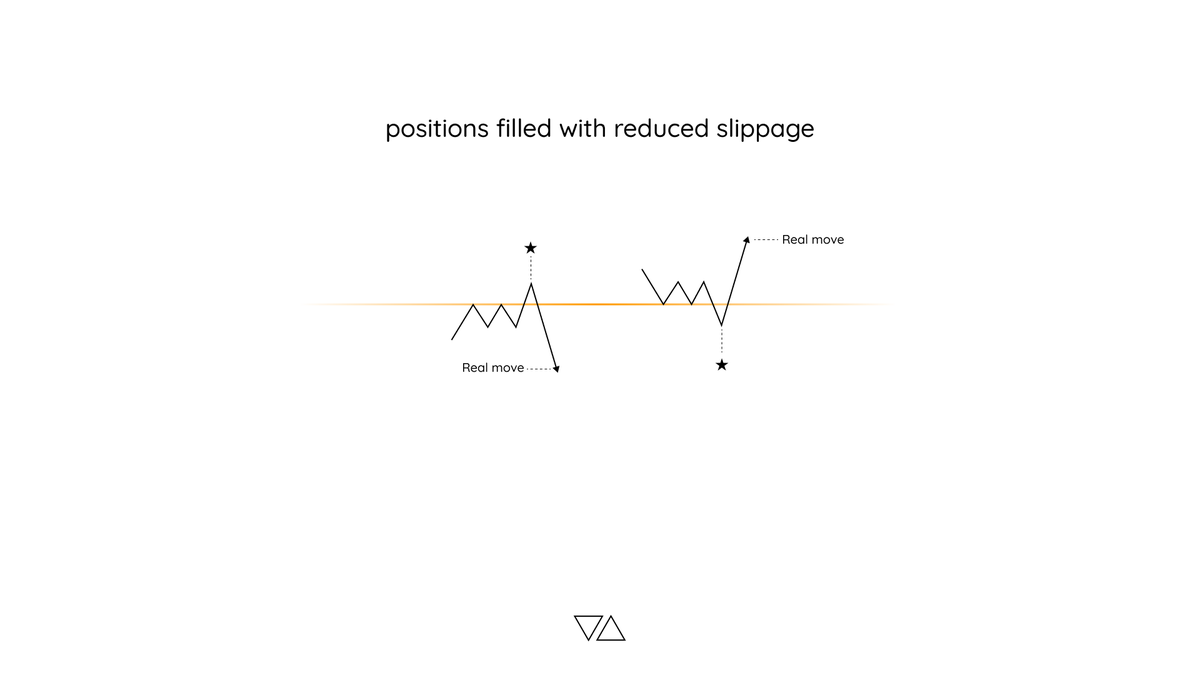
11/ Once the position is filled, the real move takes place. Having just been stopped out, range traders now watch as price moves to their target, while breakout traders are in disbelief as price immediately reverses on them. Maximum pain.
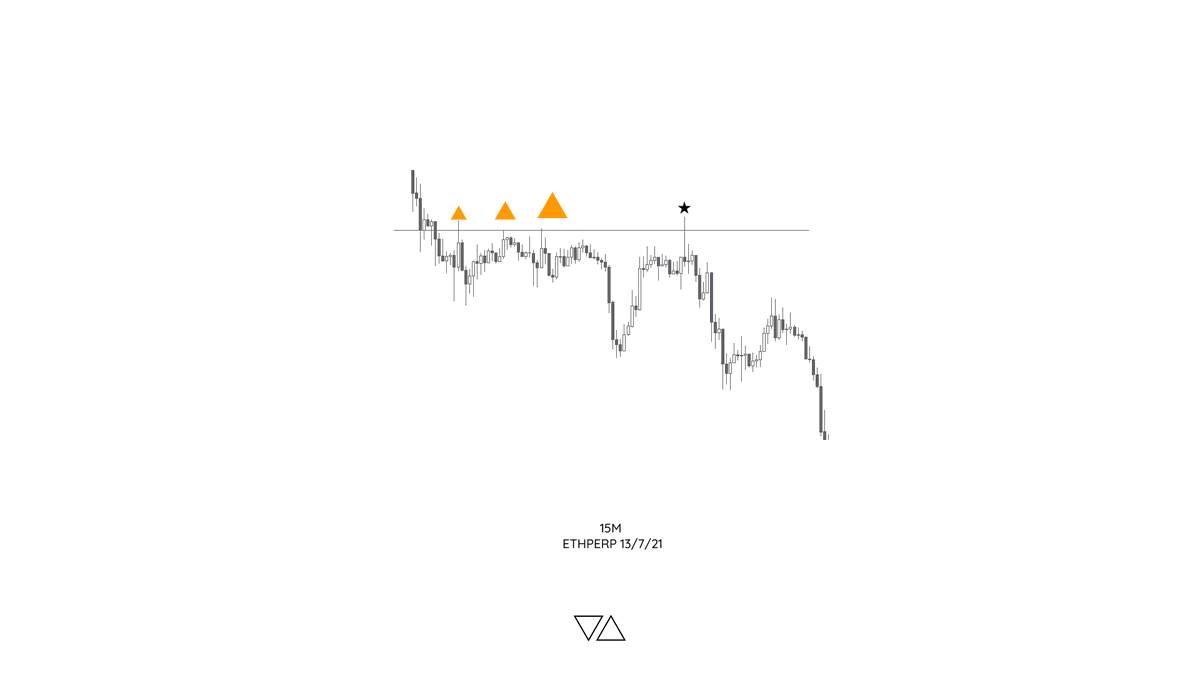
12/ This phenomenon is known as a stop run, swing failure pattern (SFP), liquidity grab, fakeout or deviation. It can be seen in all markets on all timeframes. Here are three examples on 15M, 4H and 1D charts.
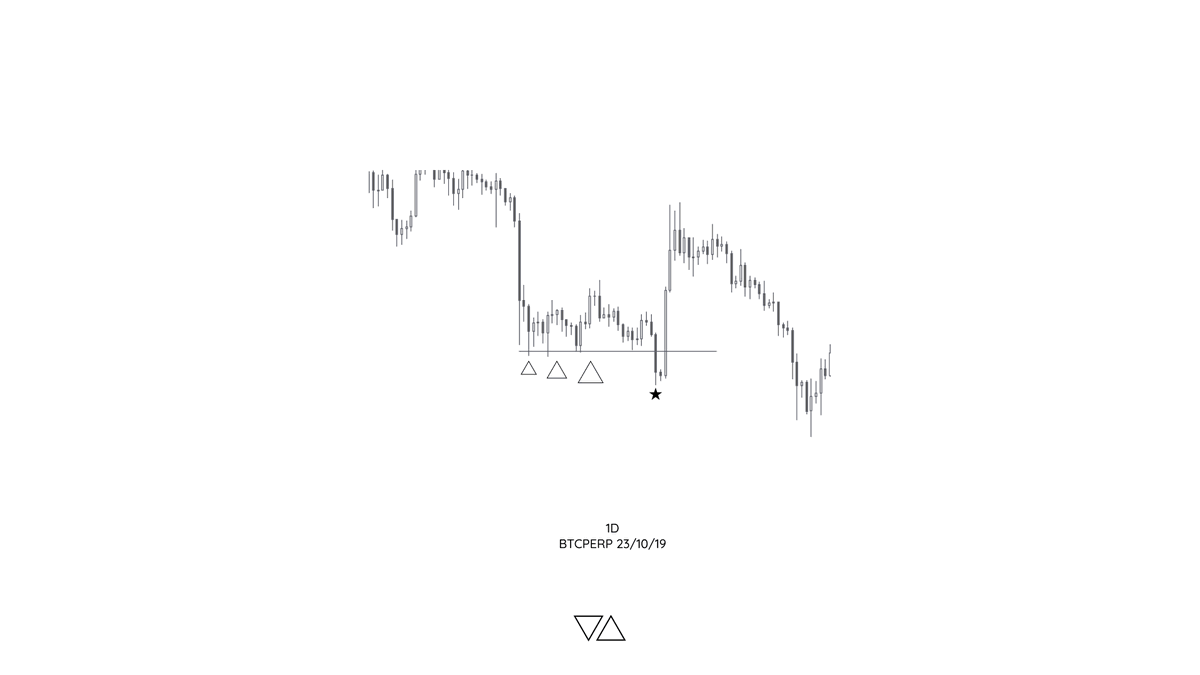

Feedback is greatly appreciated.
Loading suggestions...