

What is relative strength? 💪
Tons of great investors and traders use relative strength (RS) to identify the best stocks in the market, but it can be confusing at first.
Here's a short thread explaining to someone new what exactly RS is and how you can learn to spot it.
(1/11)
Tons of great investors and traders use relative strength (RS) to identify the best stocks in the market, but it can be confusing at first.
Here's a short thread explaining to someone new what exactly RS is and how you can learn to spot it.
(1/11)
RS is a simple concept, it shows how strong a stock is in comparison to the general market.
The strongest stocks generally post the strongest gains. It is an invaluable tool to those who want to put their hard earned money in the best names possible.
The strongest stocks generally post the strongest gains. It is an invaluable tool to those who want to put their hard earned money in the best names possible.
The RS line is an indicator that makes it easy to spot RS on your charts. It compares that stock's price action to that of the S&P 500.
There are 3 basic ways that the RS line can be used.
1. RS rating
2. RS line slope
3. RS line compared to price
There are 3 basic ways that the RS line can be used.
1. RS rating
2. RS line slope
3. RS line compared to price
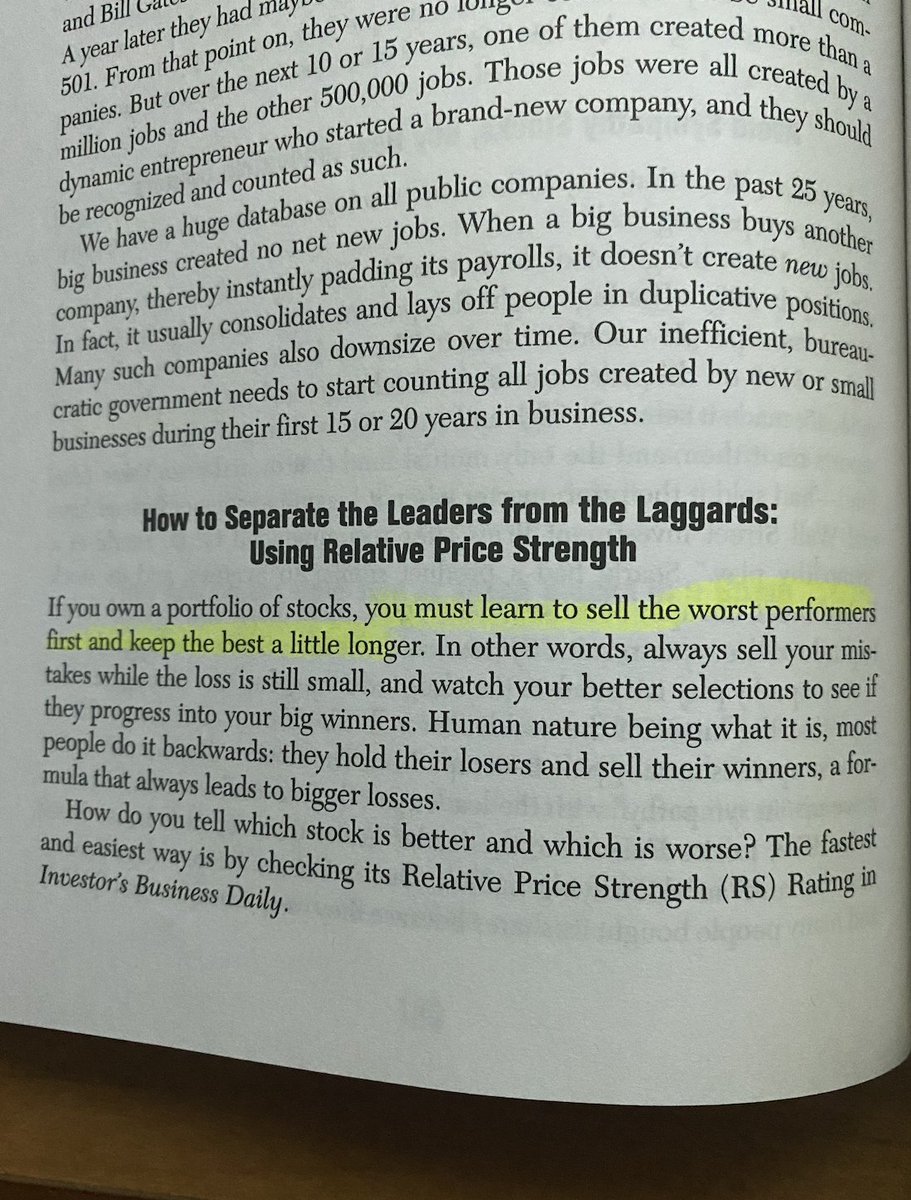
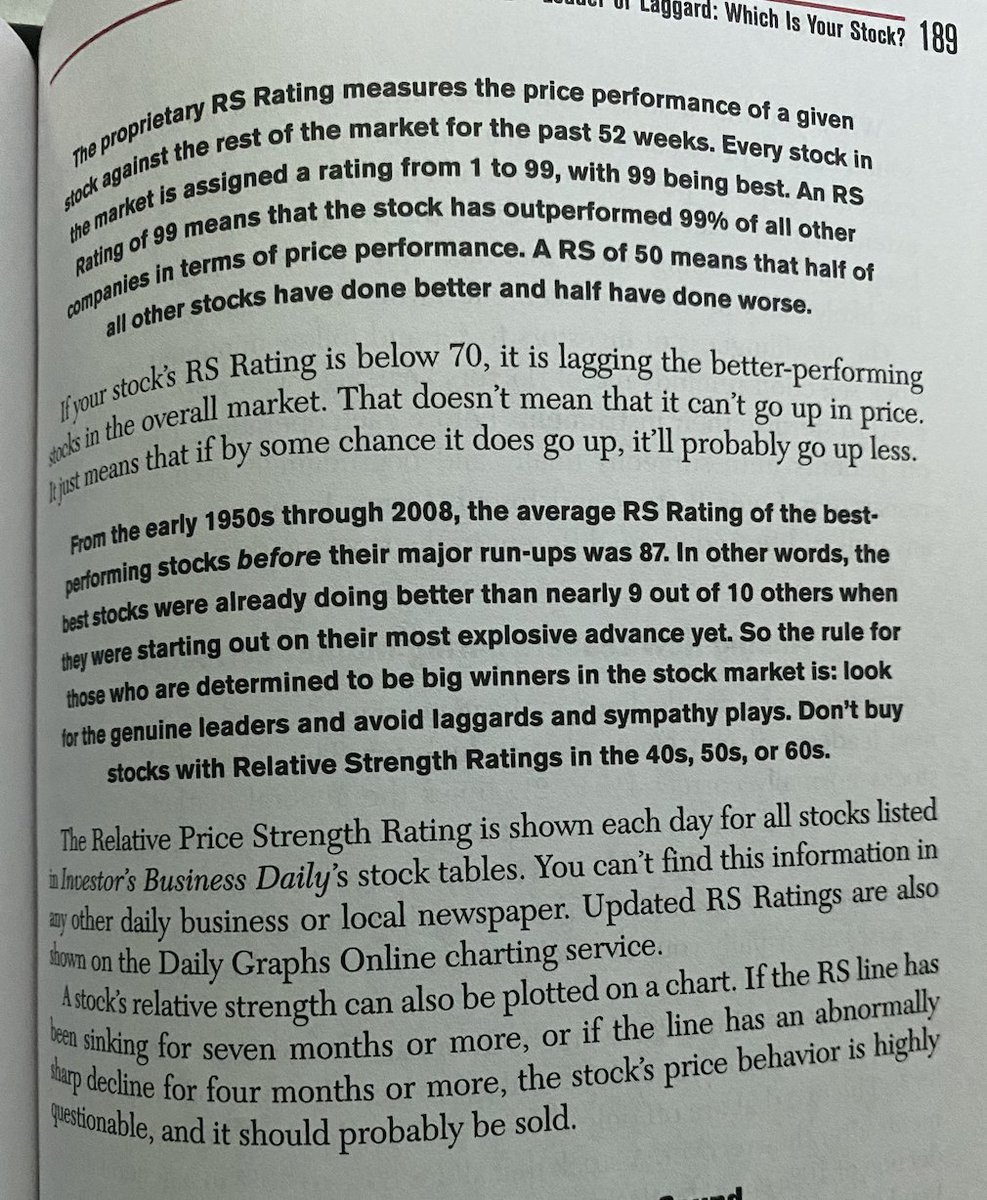
1. The RS rating is a number 1-99 that shows what % of stocks your stock is outperforming.
The number itself is the least important of the 3 uses but it can pick out a red flag that you missed. A general rule is to not buy anything lower than a 70.
👇HTMMIS by Bill O'Neil
The number itself is the least important of the 3 uses but it can pick out a red flag that you missed. A general rule is to not buy anything lower than a 70.
👇HTMMIS by Bill O'Neil
2. The slope of the RS line is a good indication of the degree to which your stock is showing strength.
A RS line pointed up to 12:00-1:00 tells us that this stock is currently much stronger than the general market. A RS line sloping down shows the stock is currently weaker.
A RS line pointed up to 12:00-1:00 tells us that this stock is currently much stronger than the general market. A RS line sloping down shows the stock is currently weaker.
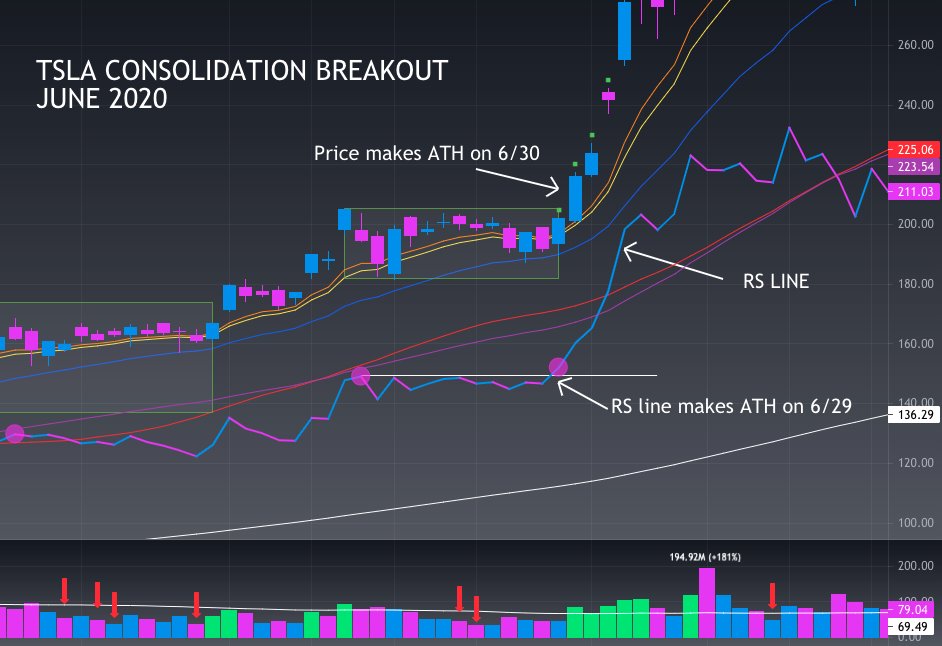
3. Comparing price to RS is my favorite way to use the line. There are a ton of ways to do this.
Strong stocks often make new highs with their RS line just before price. Also, a RS line not declining too much in a pullback or consolidation is a sign of strength.
👇$TSLA 2020
Strong stocks often make new highs with their RS line just before price. Also, a RS line not declining too much in a pullback or consolidation is a sign of strength.
👇$TSLA 2020
@TraderLion_ has free relative strength line scripts on their website for Tradingview, TC2000 and Thinkorswim.
I have no affiliation to TL but they have some great free tools.
I have no affiliation to TL but they have some great free tools.
Even if you don't have access to a RS line, a trained eye can spot relative strength without it.
Some of my favorite ways:
Price making new highs/all time highs
Holding short term moving averages on pullbacks
Strong closing ranges (>60%)
Holding gap ups
Being green on red days
Some of my favorite ways:
Price making new highs/all time highs
Holding short term moving averages on pullbacks
Strong closing ranges (>60%)
Holding gap ups
Being green on red days
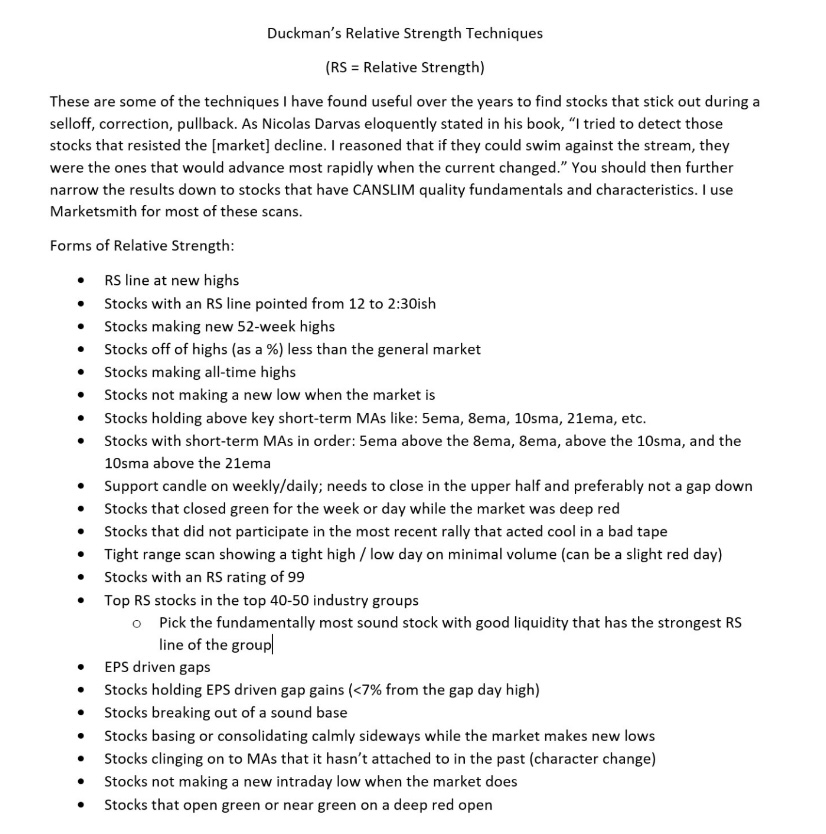
Here's a more comprehensive list of ways to spot RS made by @duckman1717.
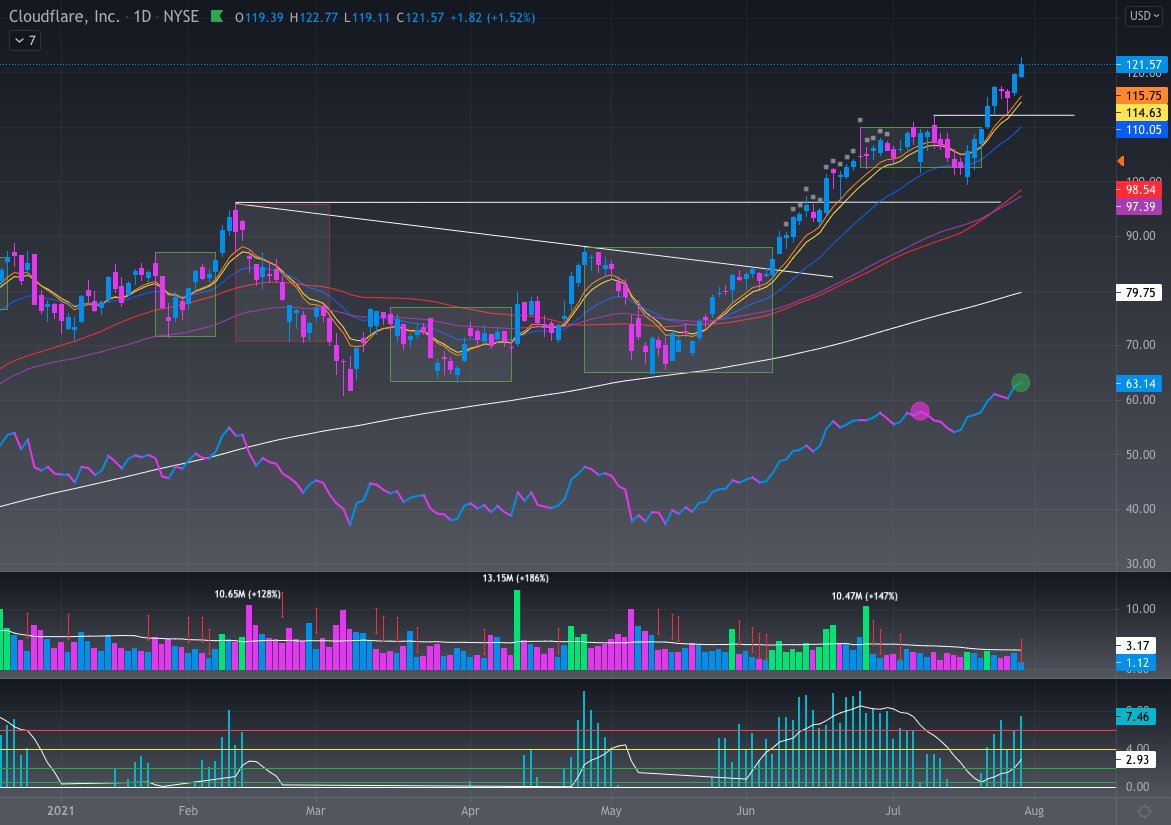
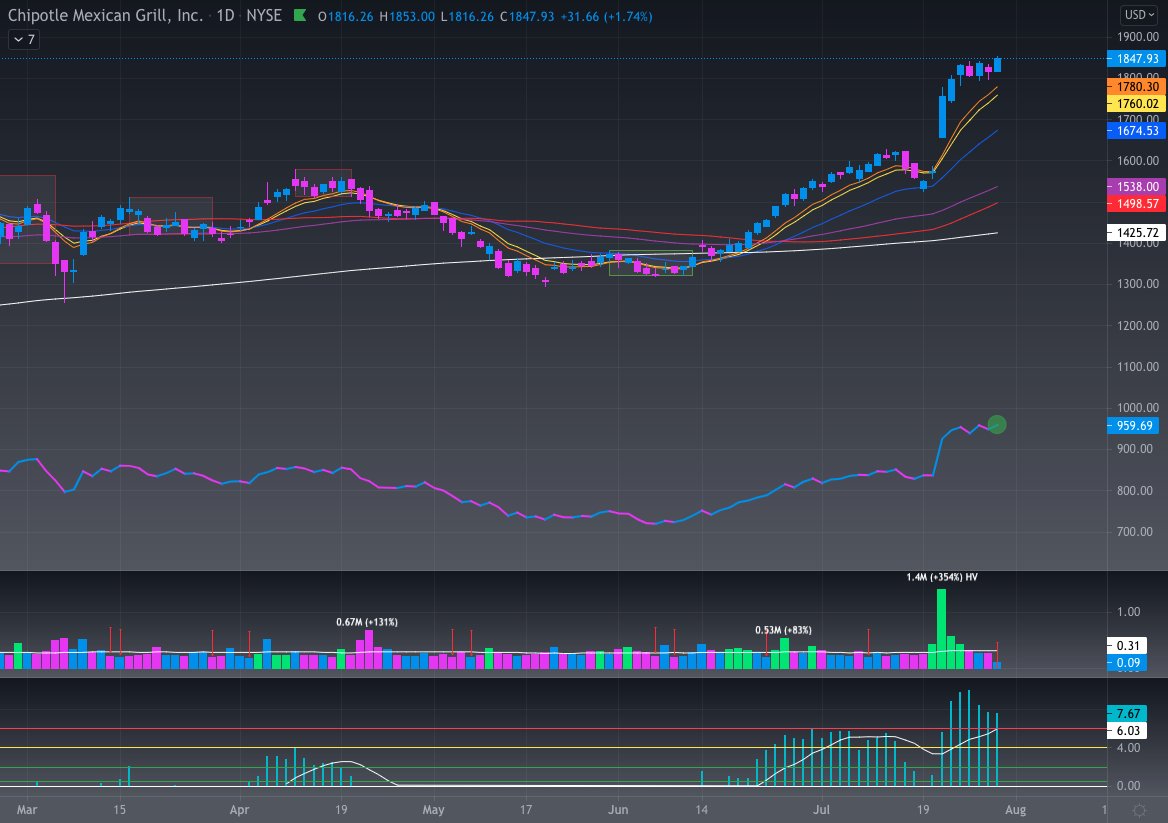
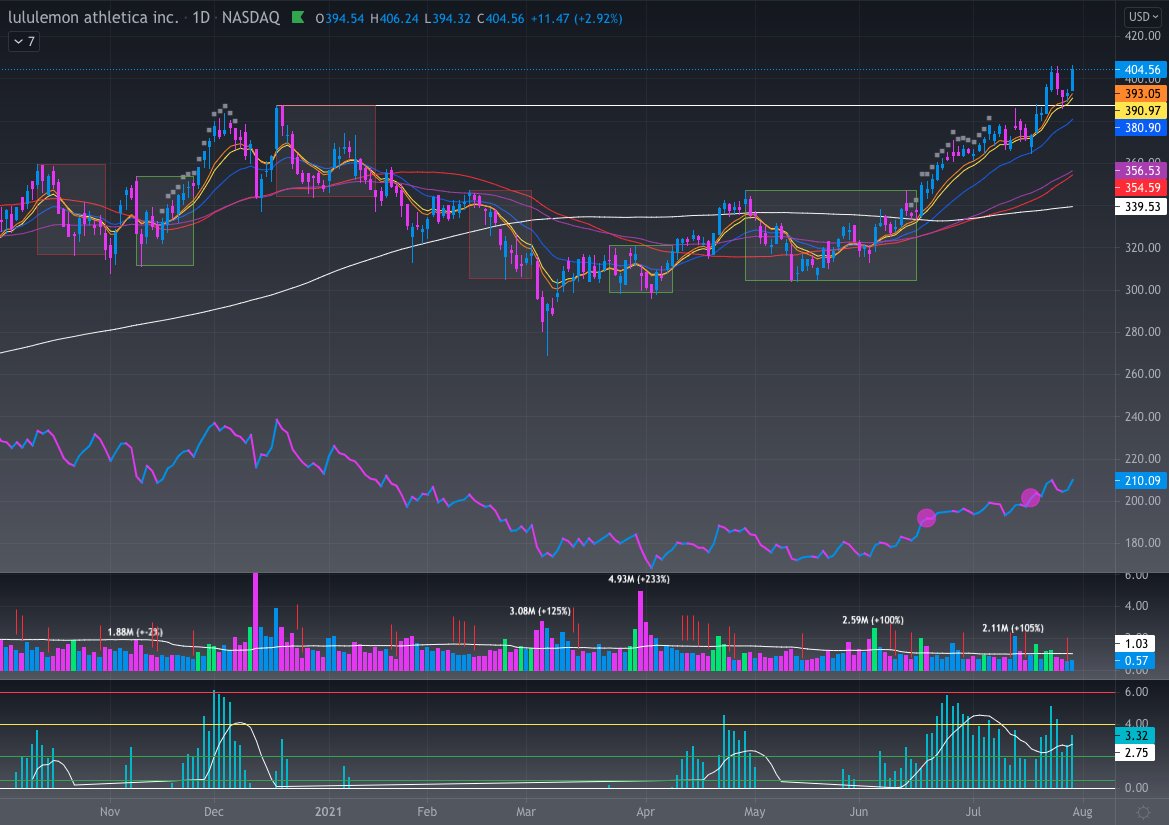
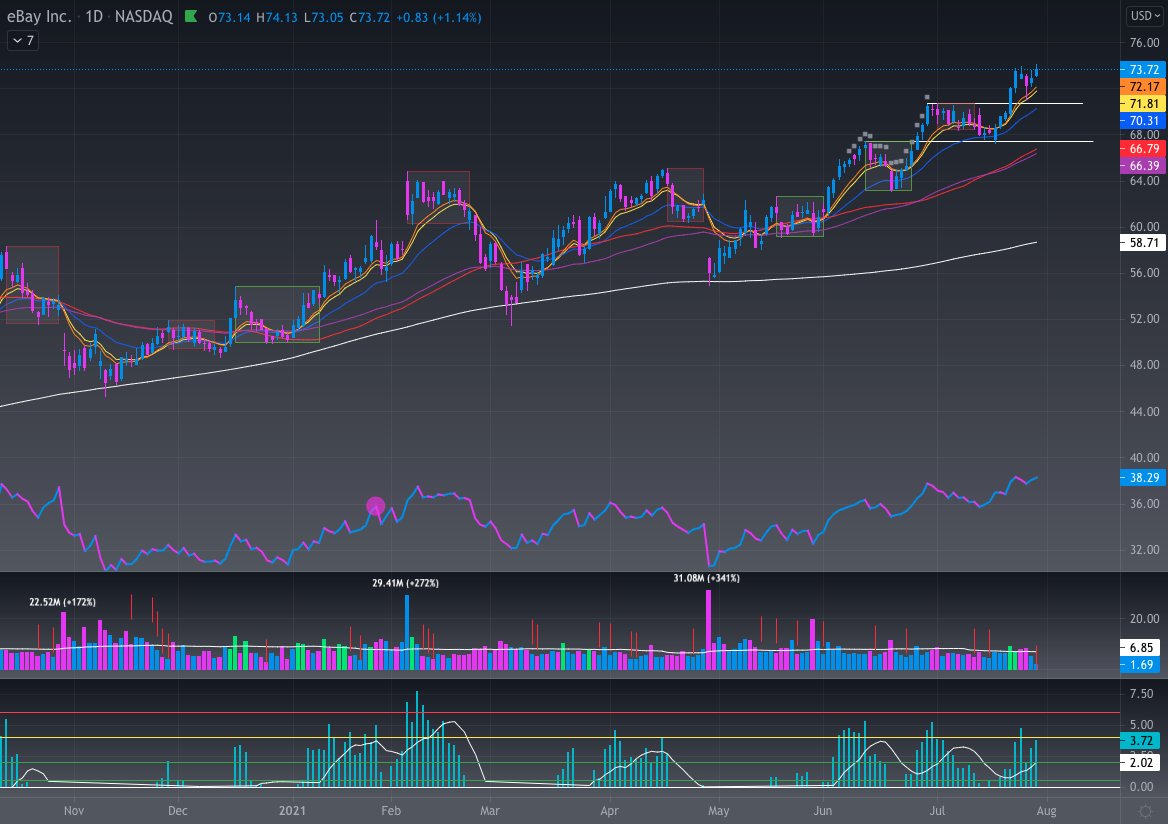
Finally, here's a few names that I believe are currently showing nice relative strength. These are good tools for someone new to both go back to study and to see RS play out in real time.
*I'm not saying you should go and buy these stocks.*
$NET $CMG $LULU $EBAY
*I'm not saying you should go and buy these stocks.*
$NET $CMG $LULU $EBAY
Loading suggestions...