

#ETH
My thoughts. A THREAD.
I use 2 moving averages. 25 Daily EMA and 21 Weekly MA. Some see moving averages as useless but they can be powerful when used in the right way. In particular crosses in the appropriate context. Using structure, trend and horizontal SR.
My thoughts. A THREAD.
I use 2 moving averages. 25 Daily EMA and 21 Weekly MA. Some see moving averages as useless but they can be powerful when used in the right way. In particular crosses in the appropriate context. Using structure, trend and horizontal SR.

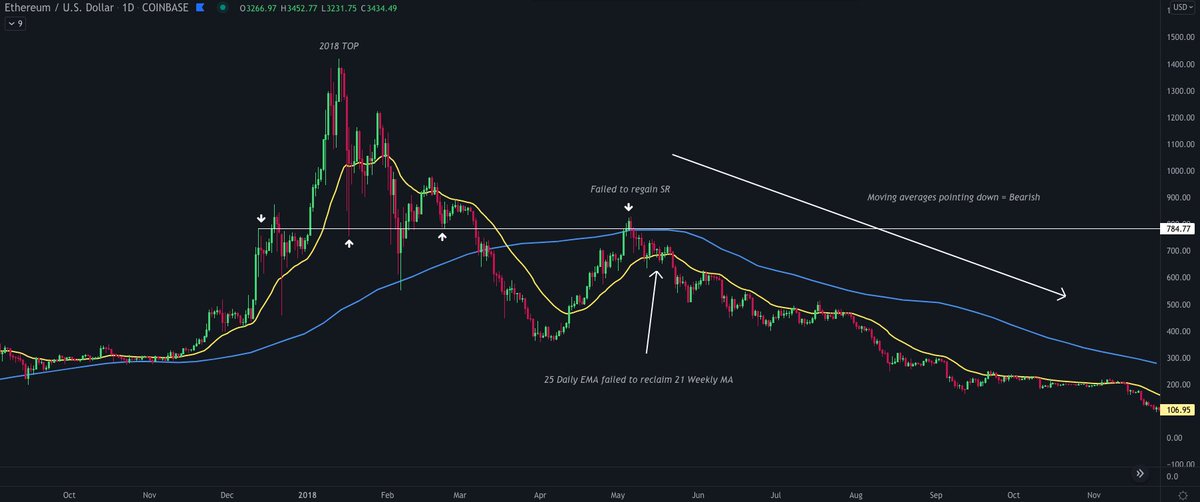
Here is the 2018 TOP in #Ethereum
Notice how there was no reclaim of structure and the 25 Day EMA failed to reclaim 21 Weekly MA.
We then went into a bear market.
Notice how there was no reclaim of structure and the 25 Day EMA failed to reclaim 21 Weekly MA.
We then went into a bear market.
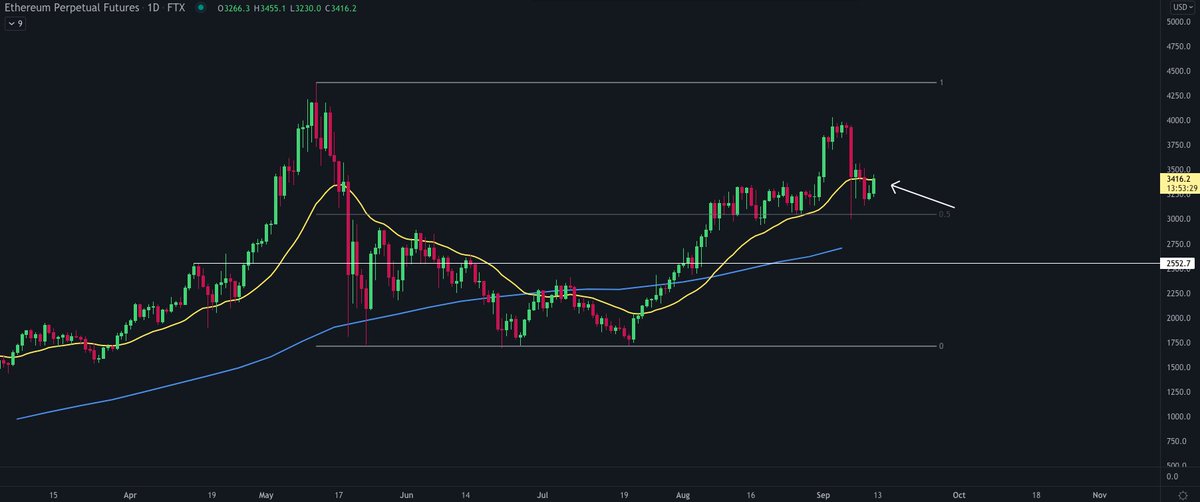
Here we are at the current time. I've tried to use a similar structure to base it off as you see to the left. Very similar to 2017/18.
As you can see we've reclaimed key SR and 25 Day EMA has crossed 21 Weekly MA both trending upwards.
As you can see we've reclaimed key SR and 25 Day EMA has crossed 21 Weekly MA both trending upwards.
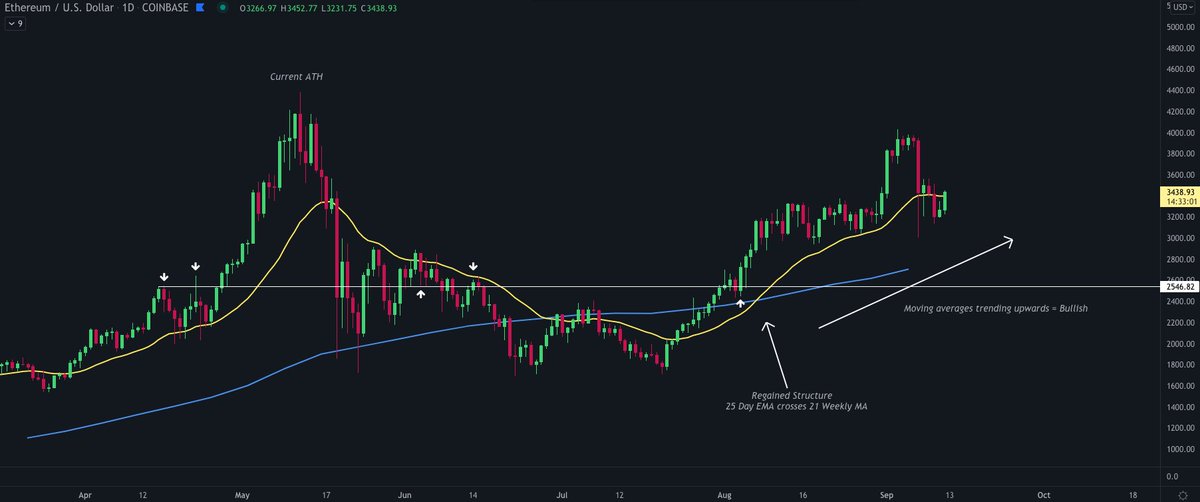
So as you can see the structure is completely different to 2018. Clear indication that this bull run isn't over and #ETH is likely heading higher in the near future.
But why do I think $ETH won't go below 3k?
Here's one reason comparing $ETH to $SOL
But why do I think $ETH won't go below 3k?
Here's one reason comparing $ETH to $SOL
Notice how $ETH is above the midrange of the larger range that we're in. If we were to go below that it isn't exactly bullish. It would likely mean a lot more sideways movement. I don't think we get that.
I think we can go sideways above the midrange just not below. Like this.
I think we can go sideways above the midrange just not below. Like this.
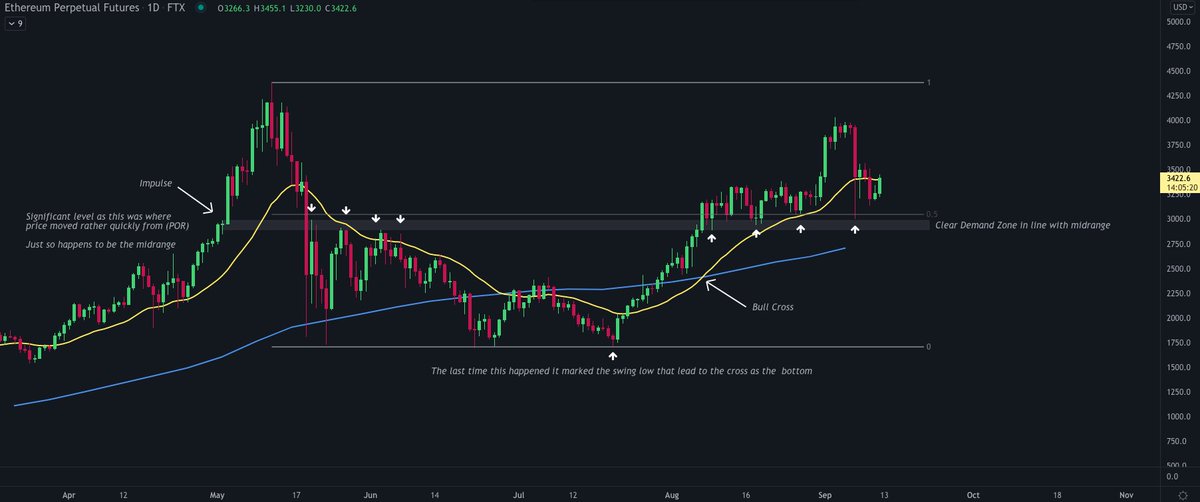
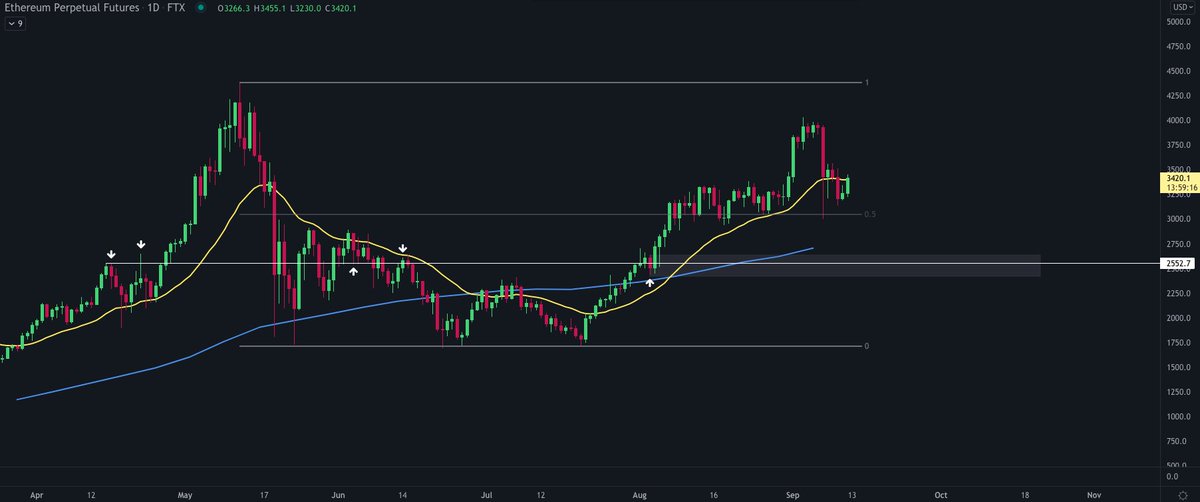
Now let's zoom in again to current PA
My thoughts are detailed on the chart for you. There's a clear demand for 3k and price has been reluctant to go below. Similar to what happened at $1700 from June - Aug before moving higher.
My thoughts are detailed on the chart for you. There's a clear demand for 3k and price has been reluctant to go below. Similar to what happened at $1700 from June - Aug before moving higher.
I see lot's of talk about the area at $2600
Nothing is certain so let's discuss.
Of course price can move down there. It can do whatever it likes. However, if it did move down there then for me momentum is lost, and we would then have to reclaim the midrange again.
Nothing is certain so let's discuss.
Of course price can move down there. It can do whatever it likes. However, if it did move down there then for me momentum is lost, and we would then have to reclaim the midrange again.
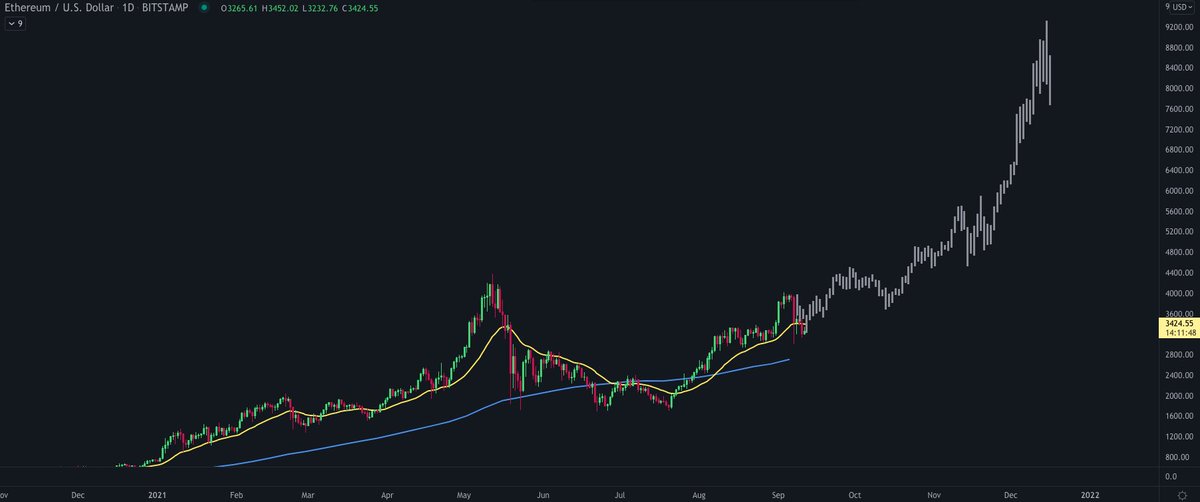
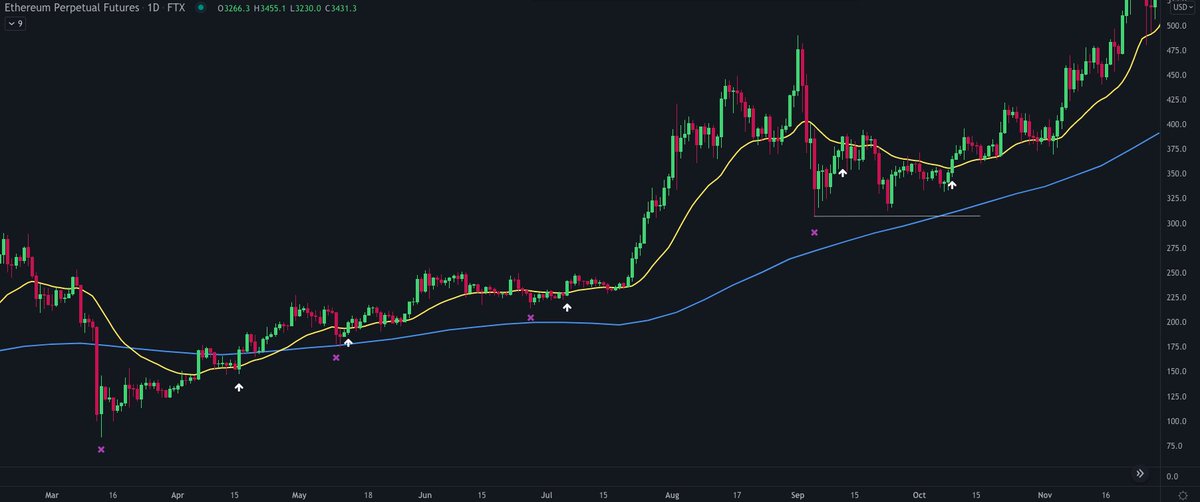
So to the final and most important indication I use as to whether or not momentum continues is a daily close through the 25 Day EMA.
What i've noticed is that when price deviates away from it then shortly after reclaims it with a close back through, it usually marks the low.
What i've noticed is that when price deviates away from it then shortly after reclaims it with a close back through, it usually marks the low.
Examples of this are shown below when ETH started its move from March 2020. You can see how high the probability is of the low staying intact.
So if we do get a close through this area I will begin averaging into a position and accumulating between the 3k and 4k area.
So if we do get a close through this area I will begin averaging into a position and accumulating between the 3k and 4k area.

With this in mind I also have a clear invalidation which is price losing 3k. It's a clear area of demand and losing that isn't bullish at all imo.
If that were to happen we would likely move sideways for a while just like we did when 3k was lost back in May during the dump.
If that were to happen we would likely move sideways for a while just like we did when 3k was lost back in May during the dump.

Finally, my thoughts here are also based on multiple Altcoins popping off. It really wouldn't make sense for ETH to lose momentum here.
As always anything can happen so manage risk accordingly.
If you enjoyed this thread please feel free to share 🤝
As always anything can happen so manage risk accordingly.
If you enjoyed this thread please feel free to share 🤝
This thread is sponsored by @Delta_Exchange
For 10% off fees and up to 30k deposit bonus you can use my link below.
Cheers ledges and enjoy the rest of your weekend 🤝
delta.exchange
For 10% off fees and up to 30k deposit bonus you can use my link below.
Cheers ledges and enjoy the rest of your weekend 🤝
delta.exchange
1 last thing. I don't try to overcomplicate things. I've found keeping things simple is best.
This is very simple to understand. A little bit of common sense, 2 moving averages, basic structure and momentum.
We're clearly still in a macro uptrend so I see plenty of upside left.
This is very simple to understand. A little bit of common sense, 2 moving averages, basic structure and momentum.
We're clearly still in a macro uptrend so I see plenty of upside left.
Loading suggestions...