

Let’s take a look at what some of these common chart patterns look like on a real chart, and how we can fit them into our own trading strategies to add confidence to our trades 🤙
$spy $qqq $tsla $amd $fb $nvda
$spy $qqq $tsla $amd $fb $nvda

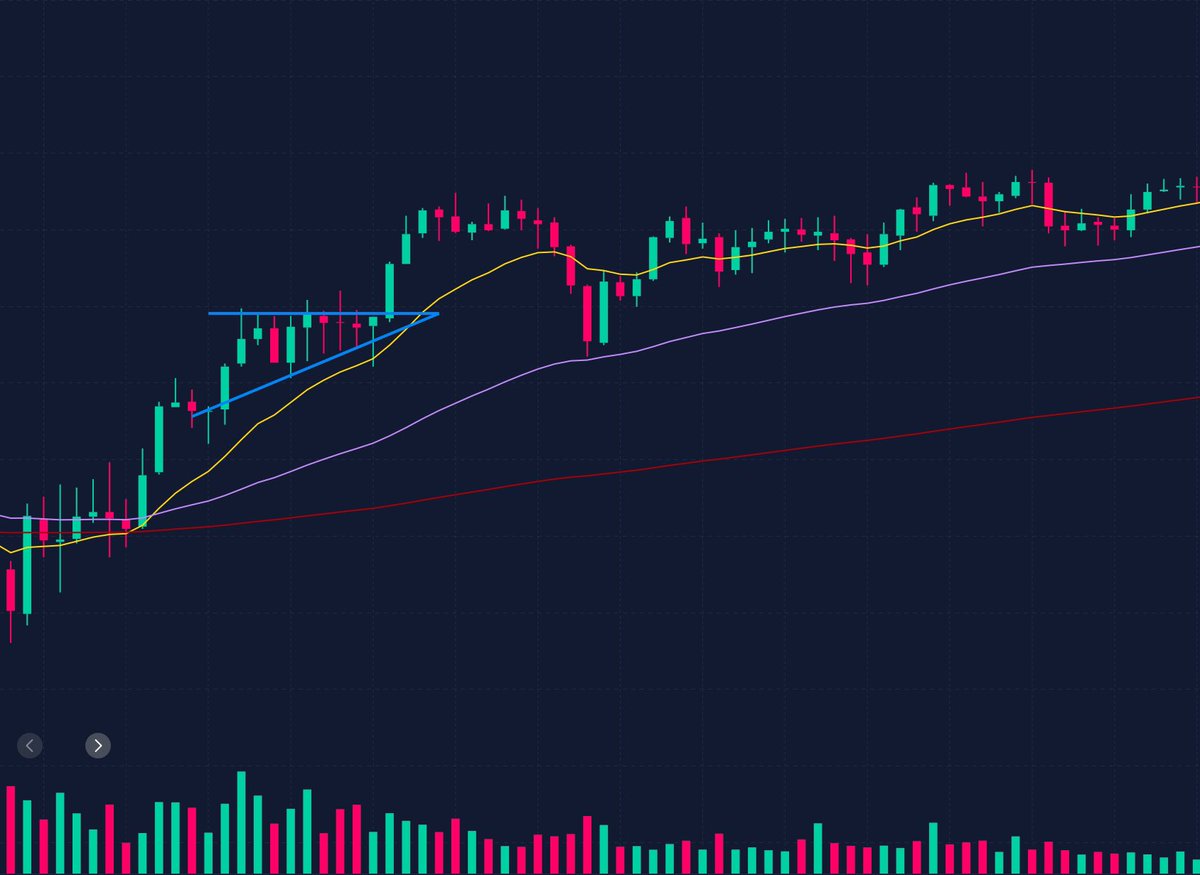
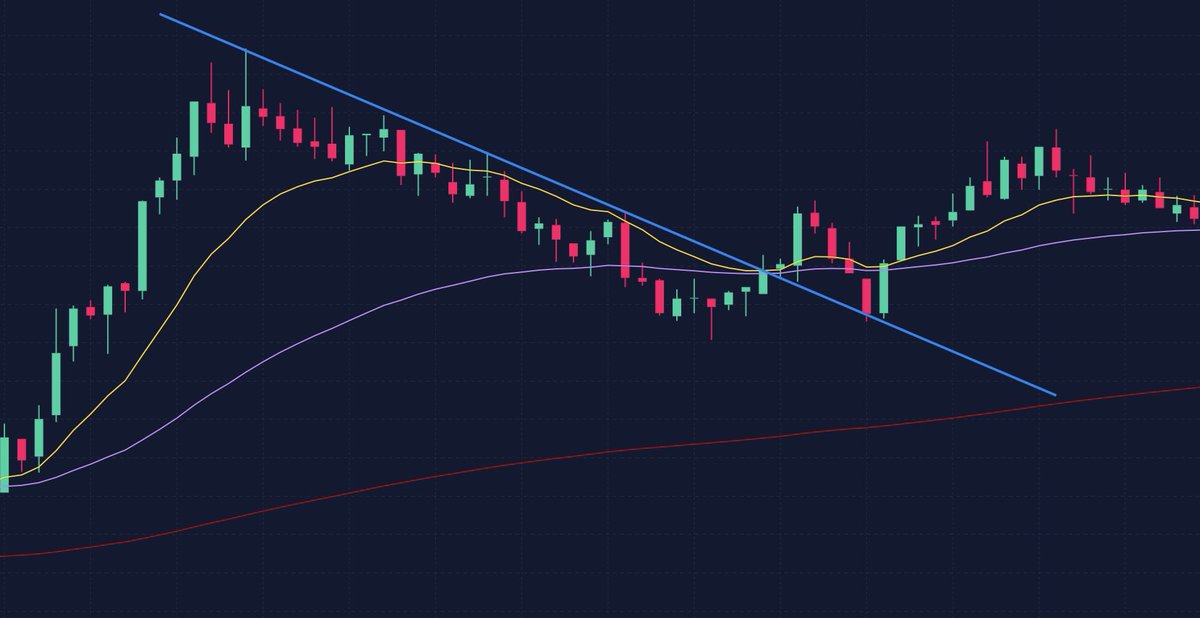
Bull and Bear flags are a favorite of mine. It’s no coincidence they usually break right at our key ema resistance/support levels. Seeing this gives me a lot of confidence that the trend is strong and buying the dip/pullback is safe


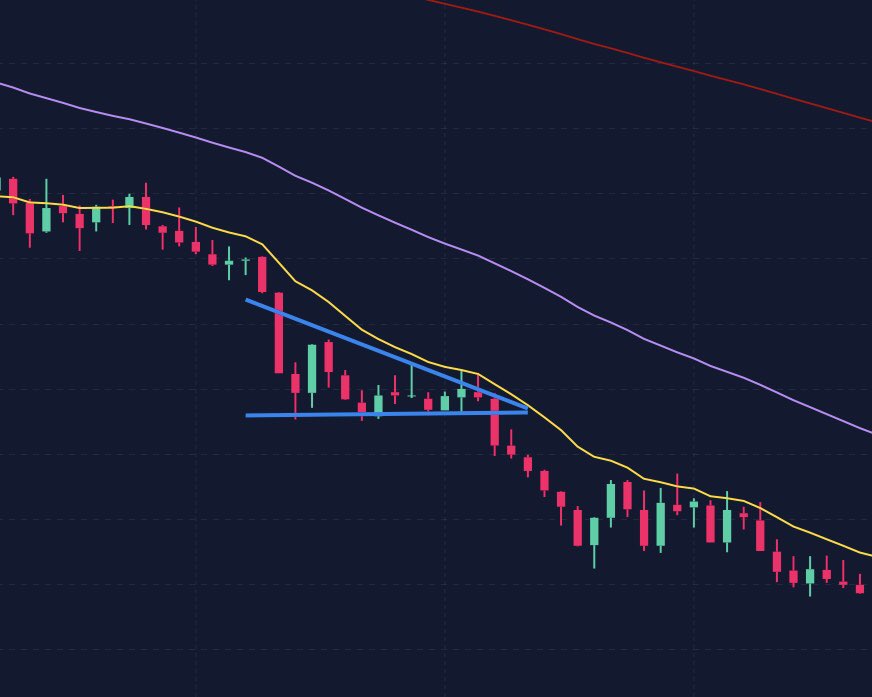
These triangle patterns can be used the same way as flags. They add confirmation to a dip/pullback buy.
They are essentially telling you that we are getting higher lows into ema support on uptrend, or lower highs into ema resistance on downtrend.
They are essentially telling you that we are getting higher lows into ema support on uptrend, or lower highs into ema resistance on downtrend.
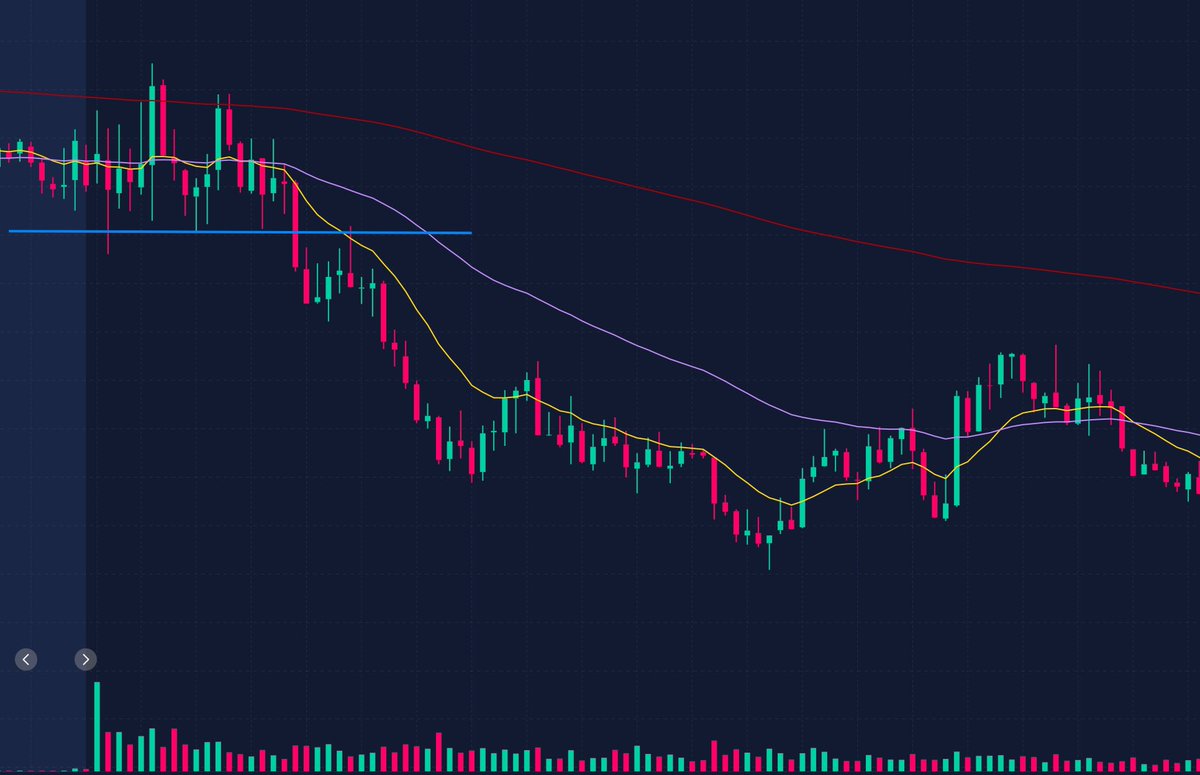
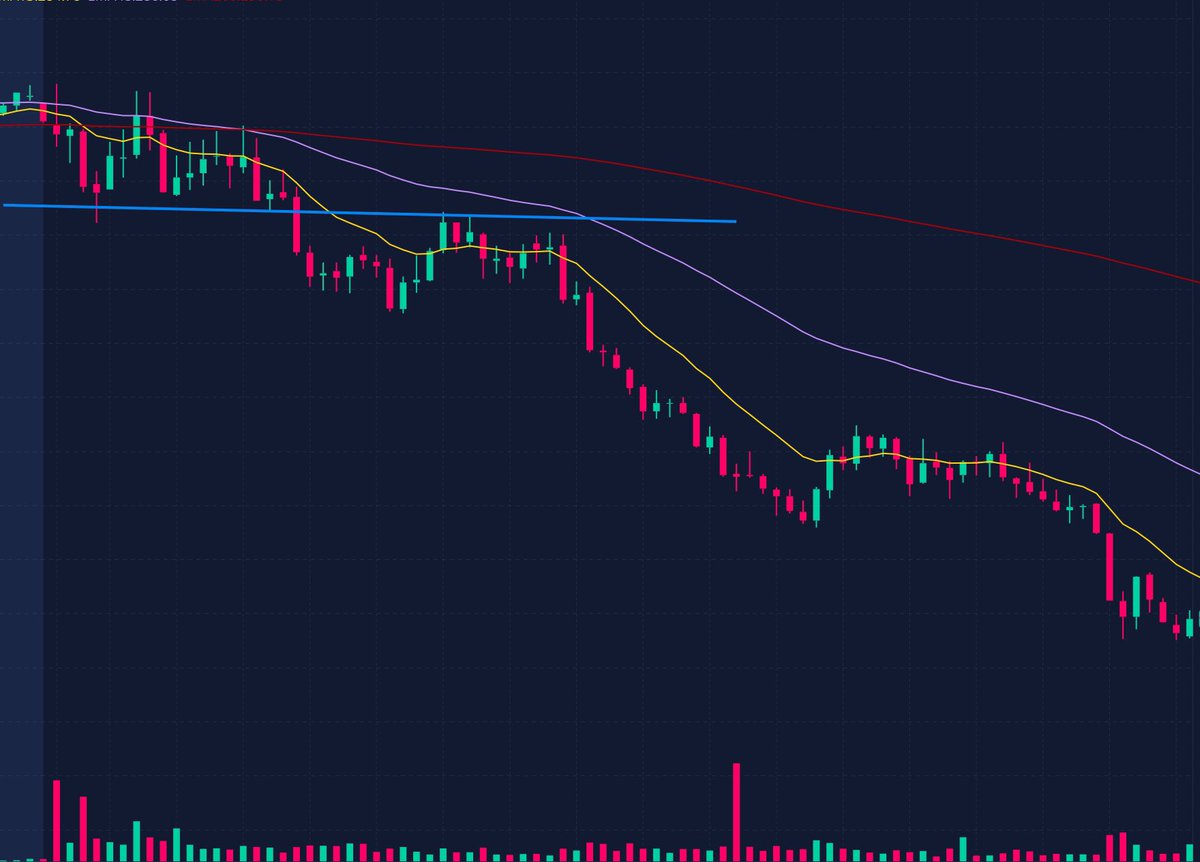
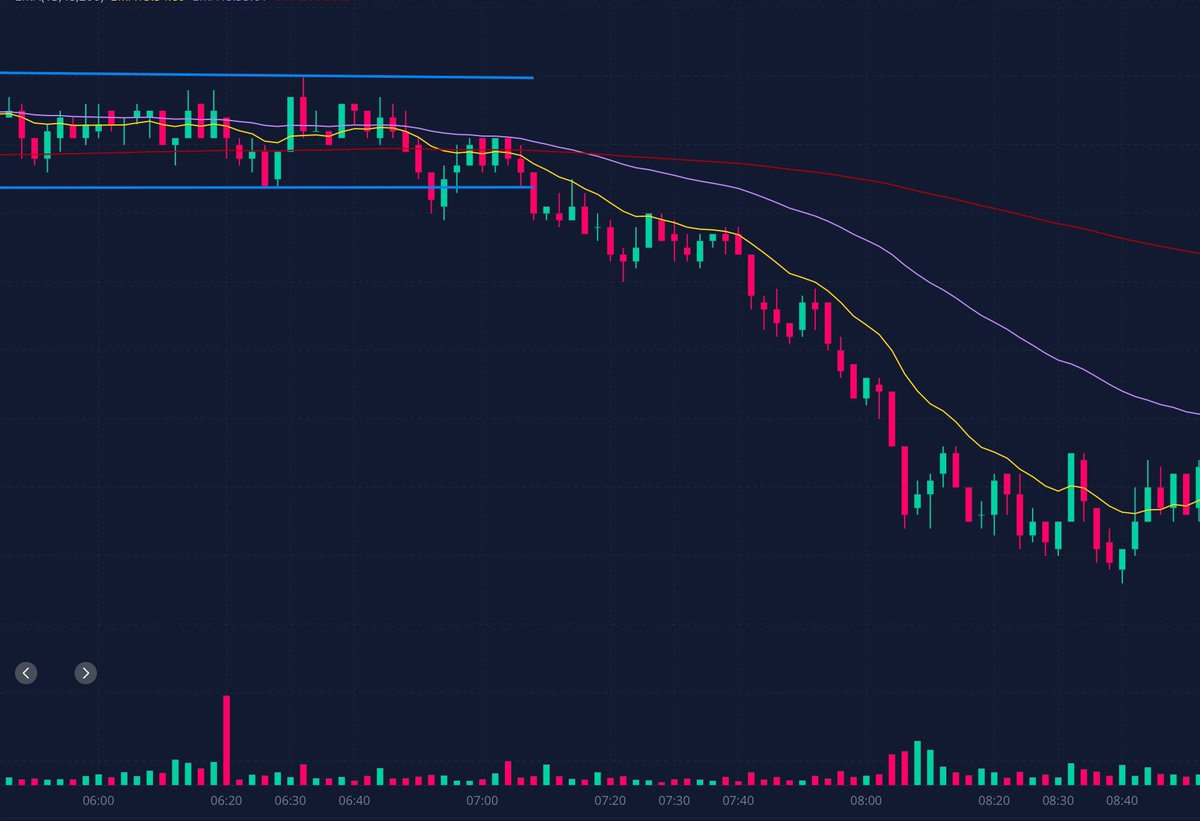
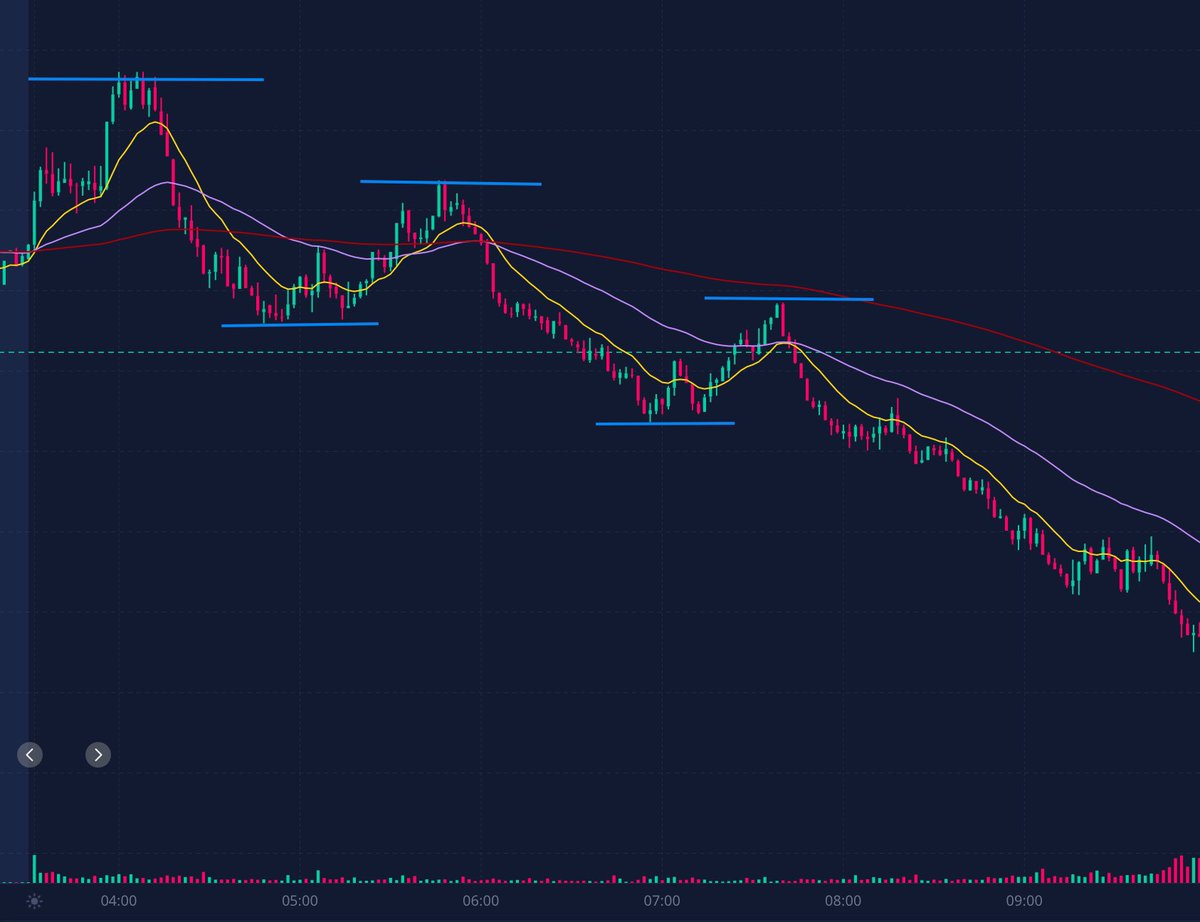
The classic support/resistance. It’s one of the easiest to see and learn. A break and retest of either will add lots of confidence in a play.
In these examples we break support and retest it right at our ema entry point. A++ $spy
In these examples we break support and retest it right at our ema entry point. A++ $spy
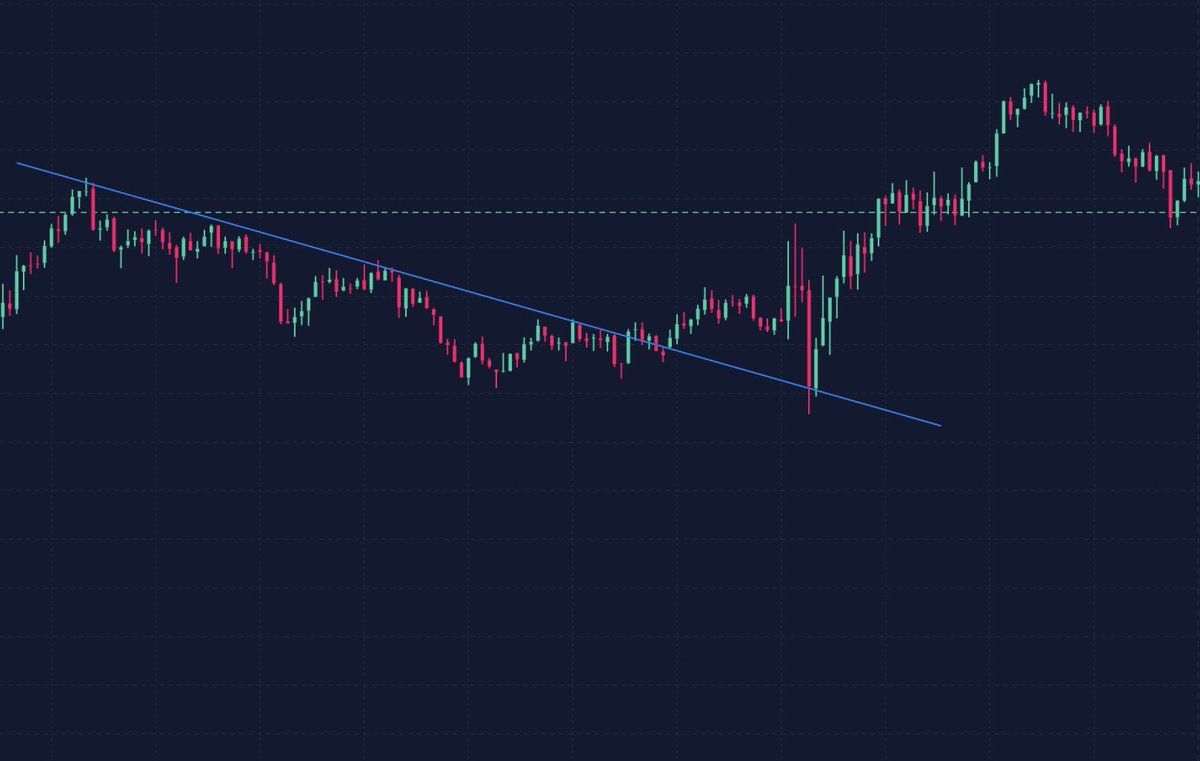
Support and resistance also applies to trend lines. A break and retest of a trend line gives you a good idea of where the stock is going next and you can plan your entry accordingly.

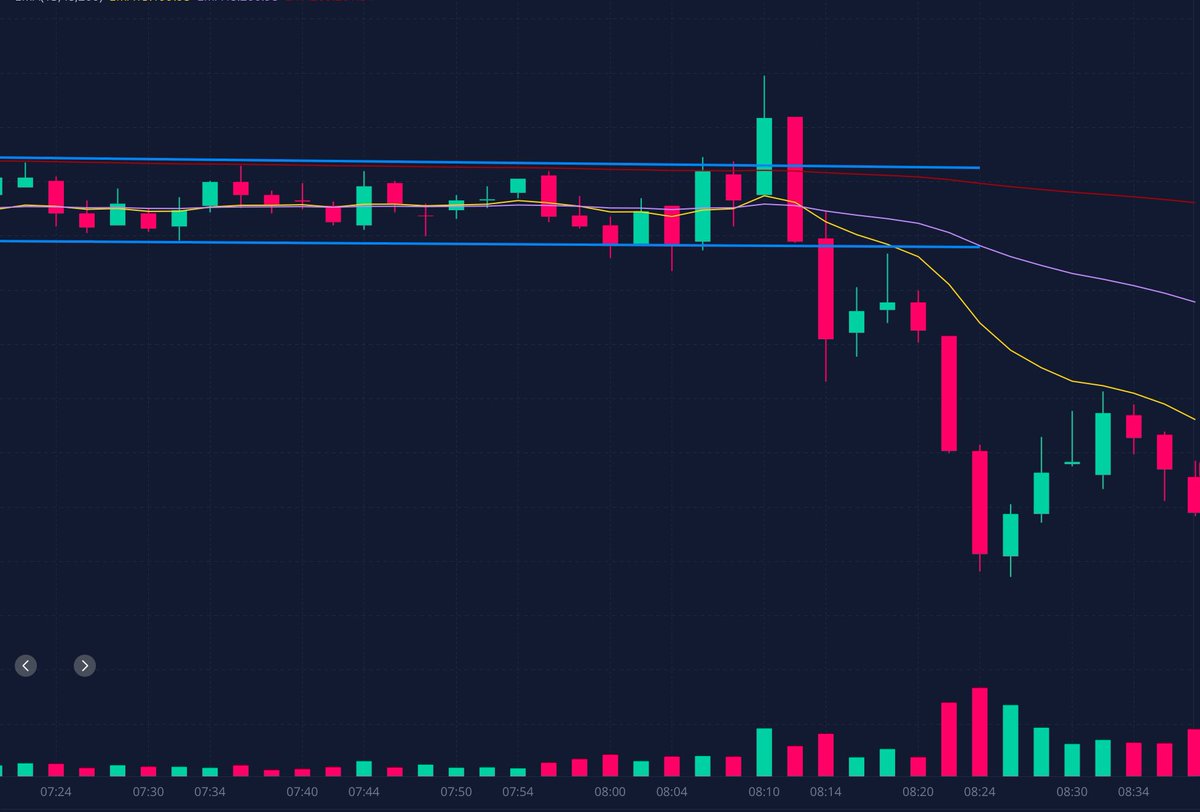
Consolidation channel breaks are also very easy to spot and have excellent results. Once we get a break in one direction or the other, look for a safe entry point at our ema.
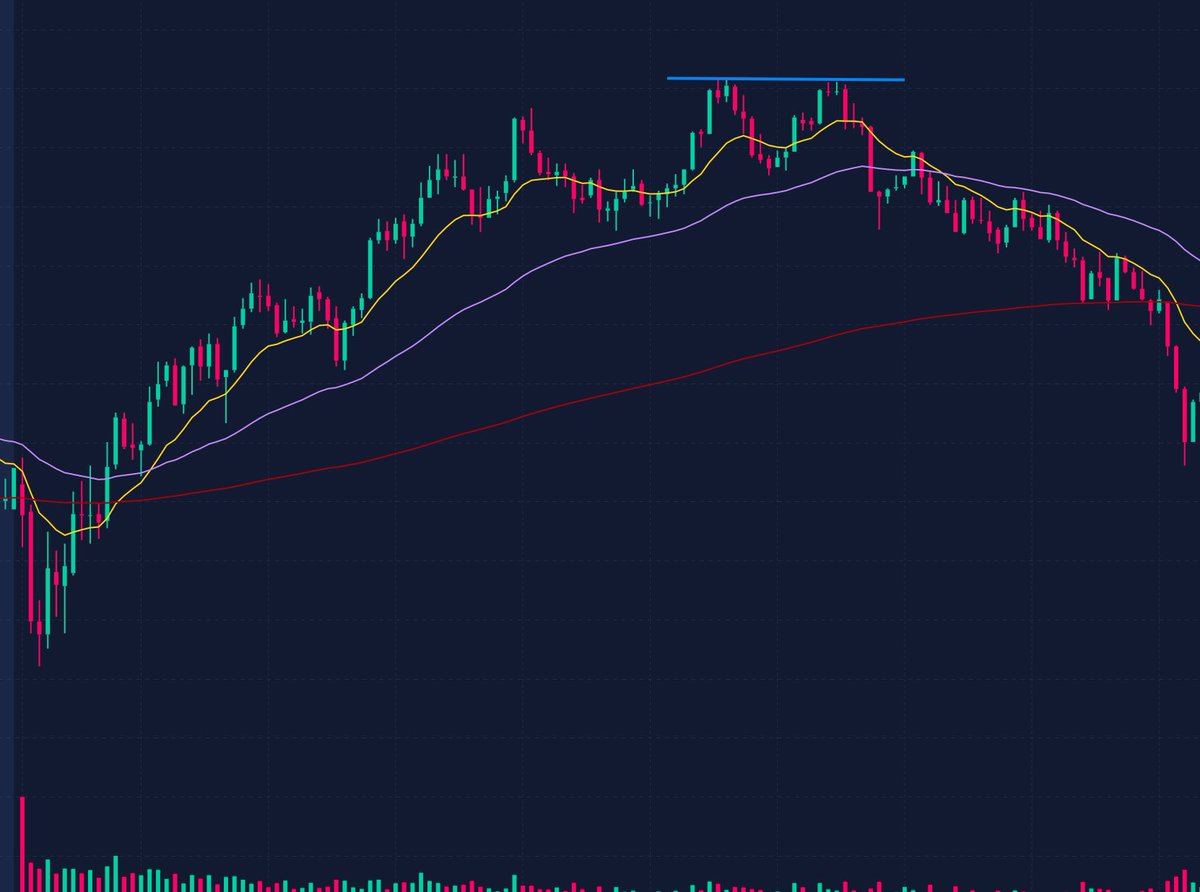
Double tops are a great way to identify the end of a trend. The stock is telling you that it’s exhausted and can’t put in another higher high.
Spotting these can prevent you from buying a dip to the emas that nobody else is buying with you.
Spotting these can prevent you from buying a dip to the emas that nobody else is buying with you.
Zooming out on the chart and noticing lower highs and lower lows or vice versa can be a great way to bring a little clarity to what looks very unpredictable price action. And can make scalping small moves a lot easier
I use these patterns for added confirmation when trading with my 2 minute strategy. They are not required for me to take the trade but a nice reassurance that it’s A+ when they present themselves 🤙 $spy $qqq $amd
Part 2
Loading suggestions...