

I've been asked a lot of times, why I pay attention to gaps and liquidity voids on the chart, and my answer remains the same. It works.
Welcome to the another thread on "Learning Technical Analysis".
Welcome to the another thread on "Learning Technical Analysis".
I got to learn about the concepts of gaps and liquidity voids from @I_Am_The_ICT.
I'll be sharing my own little understanding of the concept.
I'll be sharing my own little understanding of the concept.
For any transaction to be completed, you need a buyer and a seller.
Even in your local market place, when you go buy stuff you need someone to sell to you, when you go to sell, you need a buyer.
Even in your local market place, when you go buy stuff you need someone to sell to you, when you go to sell, you need a buyer.
The absence of a seller when you wish to buy, or a buyer when you wish to sell leaves an imbalance in the market as well as an incomplete transaction.
This same thing can be visualised on the charts.
This same thing can be visualised on the charts.
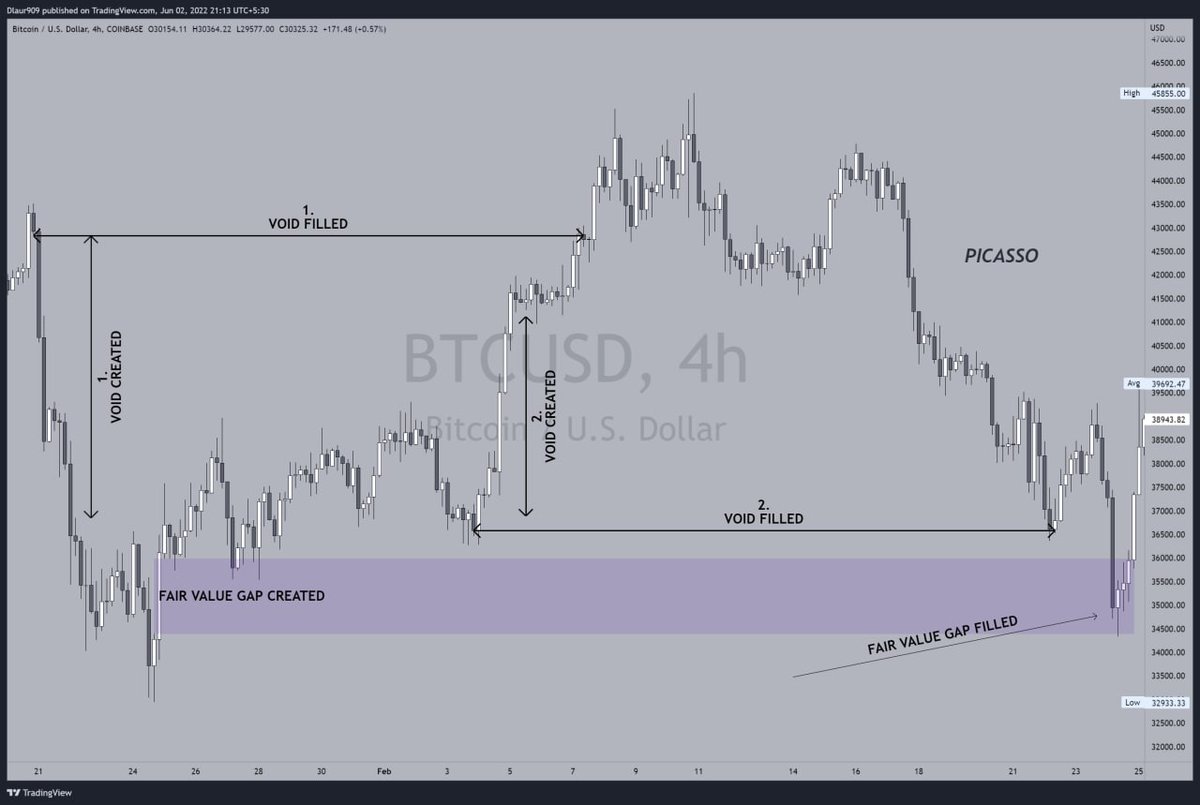
When you see long buy or sell candles that create a gap or void in the market, it simply means that one participant of the transaction has been left behind and at some point, and price has to go back to create a balance in the market and complete the transaction.
I'll show you examples on the chart, but I want you to understand the concept properly beforehand.
Let's assume you go to your local market place to buy stuff and for some reason you forget to pay and begin to leave, you'd get called back by the seller or you'd remember and go back to pay and complete the transaction.
The same thing happens on the charts.
When one side of market decides to run with the price, at some point price has to go back to complete the transaction and fill the gaps or voids they've created, that is going back to provide liquidity to the liquidity voids created.
When one side of market decides to run with the price, at some point price has to go back to complete the transaction and fill the gaps or voids they've created, that is going back to provide liquidity to the liquidity voids created.
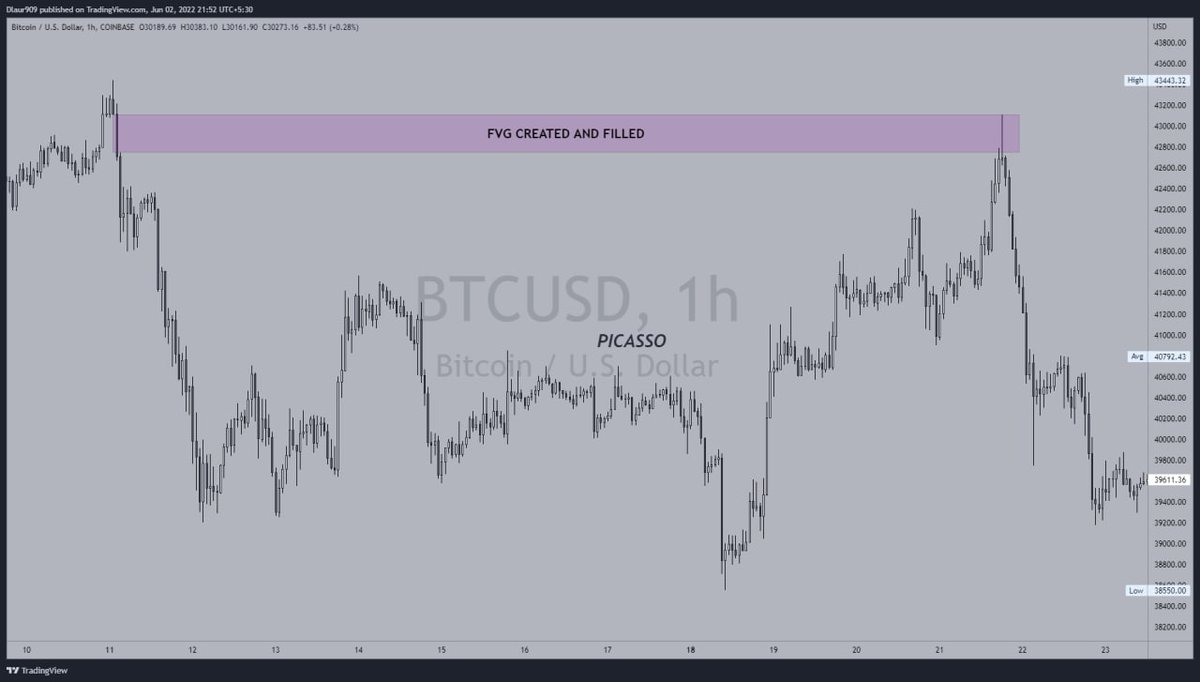
Fair value gaps as explained by @I_Am_The_ICT is a situation where price leaves a specific level
and only has a small section of
price action that is seen as one
directional.
They can present objectives for profits or new setups, depending on the current market environment.
and only has a small section of
price action that is seen as one
directional.
They can present objectives for profits or new setups, depending on the current market environment.
Let's look at some examples.
Kindly study the images and see how price reacted to the liquidity voids and gaps created.
Kindly study the images and see how price reacted to the liquidity voids and gaps created.
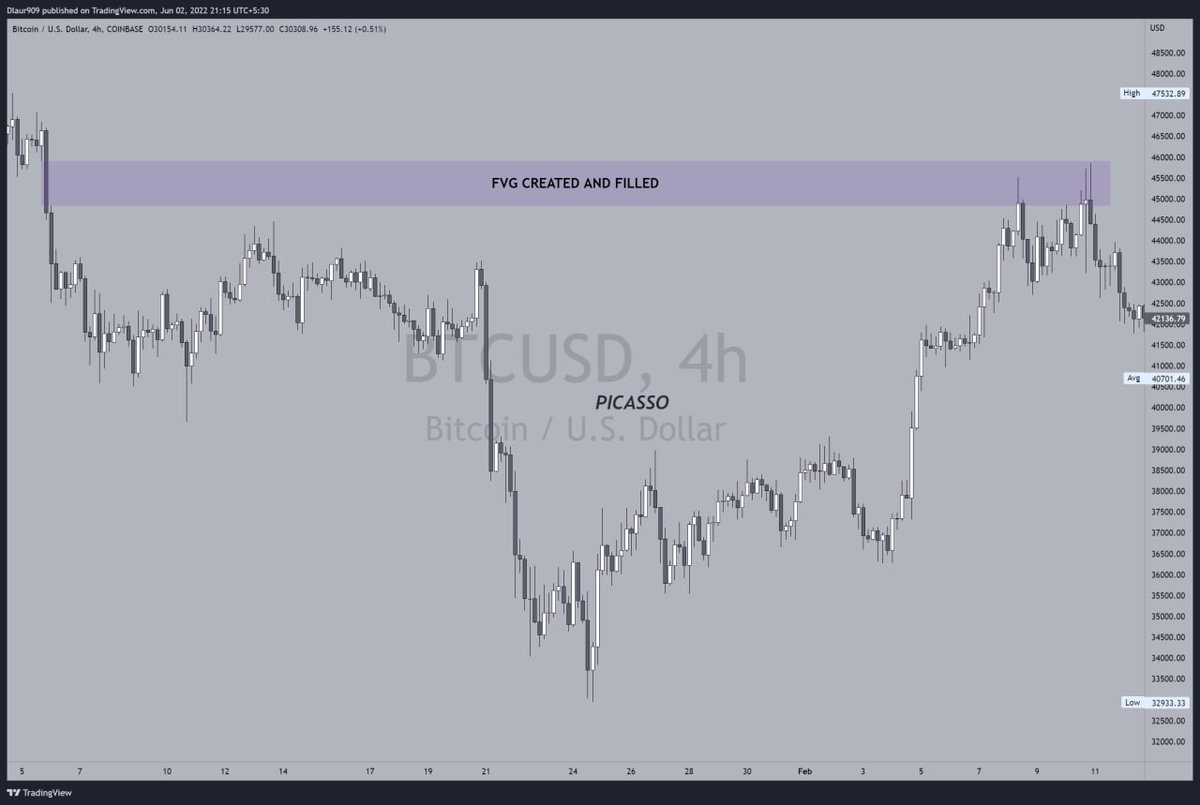
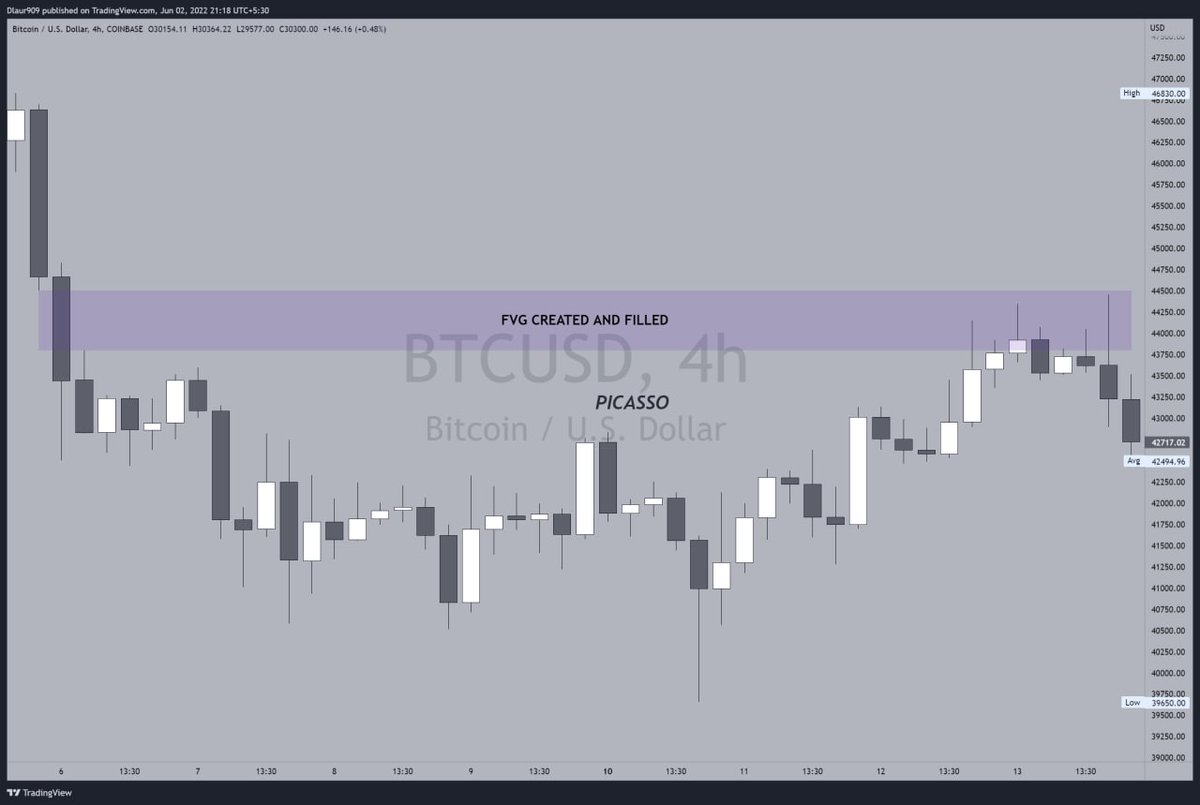
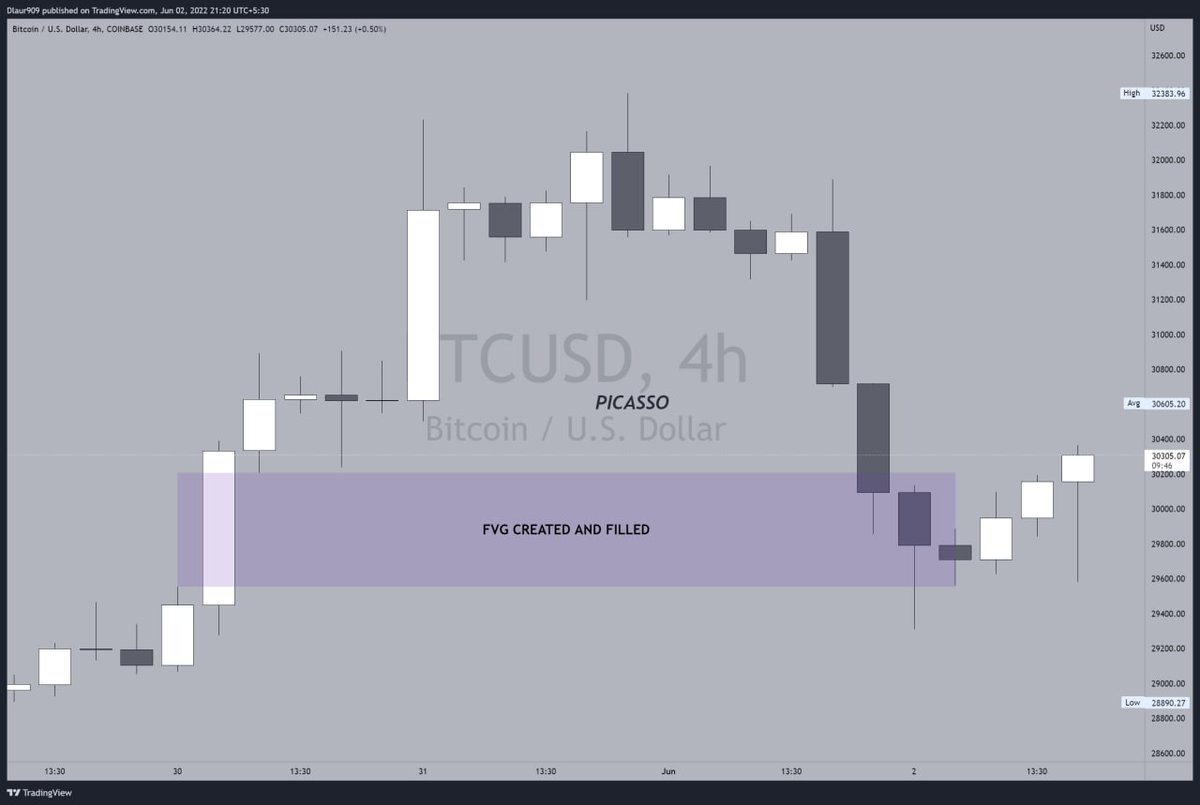
There are some I didn't label, you can use that as an exercise for yourself, look at the images and identify the gaps created and filled.
Also go back to your chart and look for yourself, backtest and forward test.
You won't fully understand it till you look for yourself.
Also go back to your chart and look for yourself, backtest and forward test.
You won't fully understand it till you look for yourself.
I personally use fair value gaps as profit targets. They can also be used as entries, but in peculiar situations.
I don't want to make this thread too bulky, so subsequently I'll drop chart examples of trade setups involving Gaps and voids.
For now do well to study all I've said here and get a better understanding about it.
For now do well to study all I've said here and get a better understanding about it.
Kindly do well to share this piece.
Follow me for more content like this.
Like and retweet if you find it valuable.
Trade safe.
Peace.
✌
Follow me for more content like this.
Like and retweet if you find it valuable.
Trade safe.
Peace.
✌
Here's a thread of all my Educational threads.
Loading suggestions...