

This graph shows the gamma exposure profile of the MM. As we can see the gamma exposure of the MM is positive (in this case). The MM has to hedge its gamma exposure to be delta neutral. This way the MM is not at risk from market movement. And how do they do this?
🧵1/4
👇
🧵1/4
👇
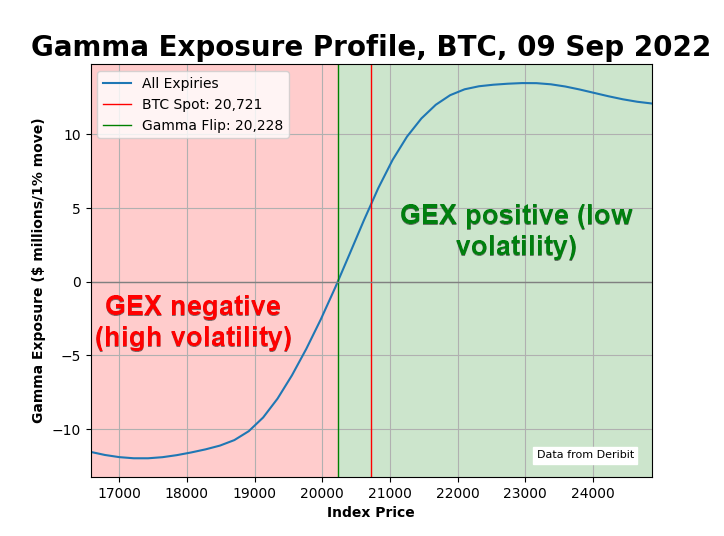
Well, if the gamma is positive, they sell when the price rises and buy if the price falls (spot/futures).
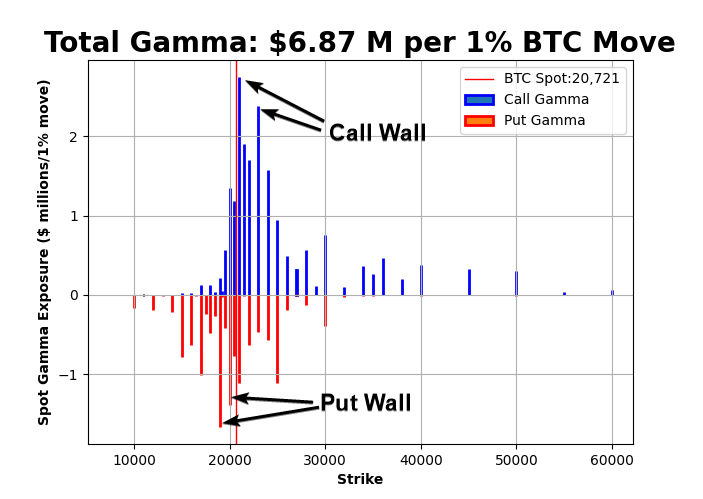
And how much does the MM have to buy or sell to hedge? Well, this other graph shows the amount that the MM has to buy or sell per 1% of BTC move.
🧵2/4
👇
And how much does the MM have to buy or sell to hedge? Well, this other graph shows the amount that the MM has to buy or sell per 1% of BTC move.
🧵2/4
👇

This chart also shows important levels where the OI is high and therefore can act as resistance (Call Wall)/support (Put Wall) levels.
🧵3/4
👇
🧵3/4
👇
🧵4/4
This is a very quick analysis of these two charts. But there is more and it is more complex. We'll comment on it...
Please share if you find it interesting. Thank you!
Have a nice weekend...
This is a very quick analysis of these two charts. But there is more and it is more complex. We'll comment on it...
Please share if you find it interesting. Thank you!
Have a nice weekend...
Loading suggestions...