

Chart 1) SPX. If you've been following, then you will understand why I was bearish into September (see pinned tweet). It does seem as though a low for the year could be printed soon (next 2-3 weeks). However, I do not think this will be end to bear market (read on)
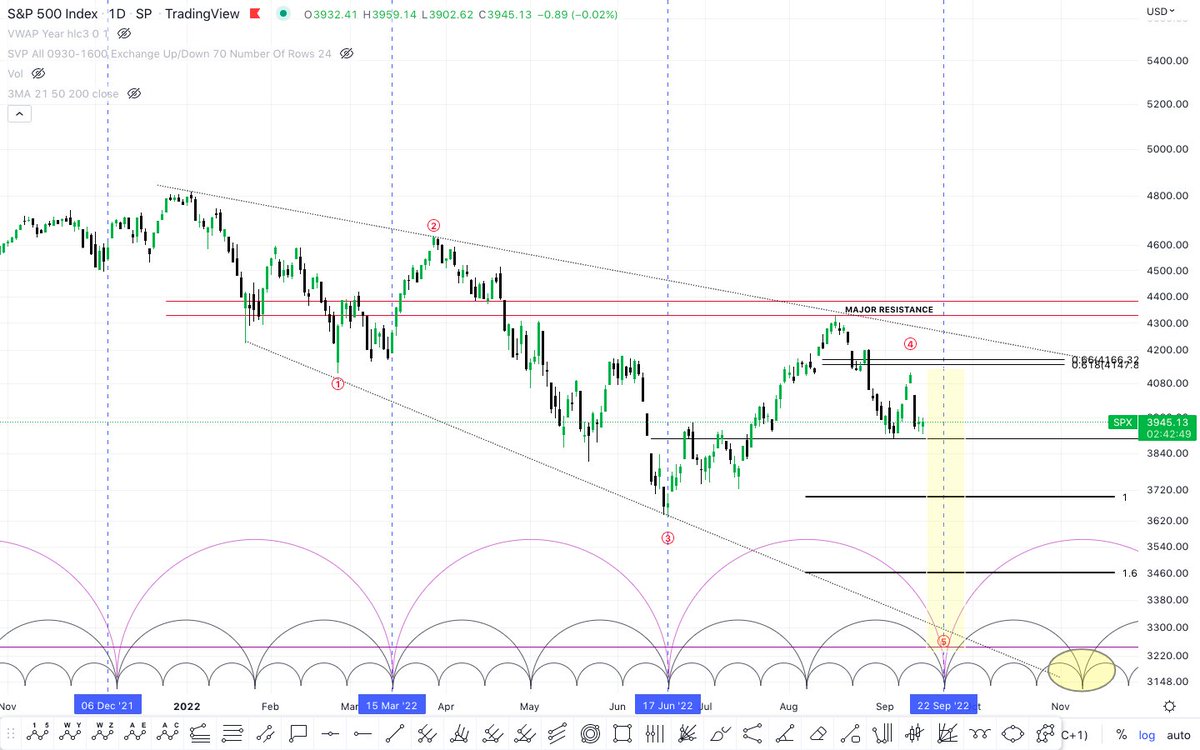
Chart 2) DXY. This is the wave count I have been tracking. I try to have the wave analysis in sync with the cyclical patterns. This suggest a dollar top around October and a low towards the end of the year. Probably followed by a period of dollar strength - maybe more rate hikes?
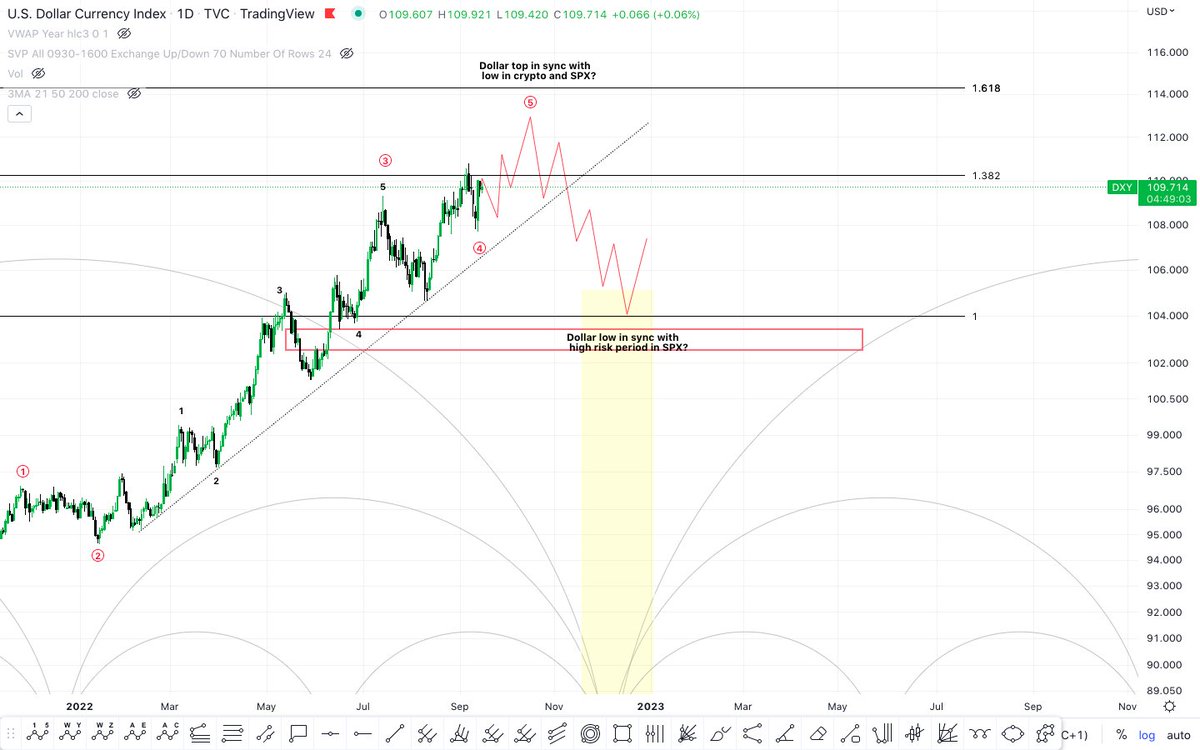
Chart 4) Regular #Bitcoin chart. Posted this many times. This chart also has October/ November as a significant low. Based on the DXY I would favour this as an A wave (could eventually print running correction)
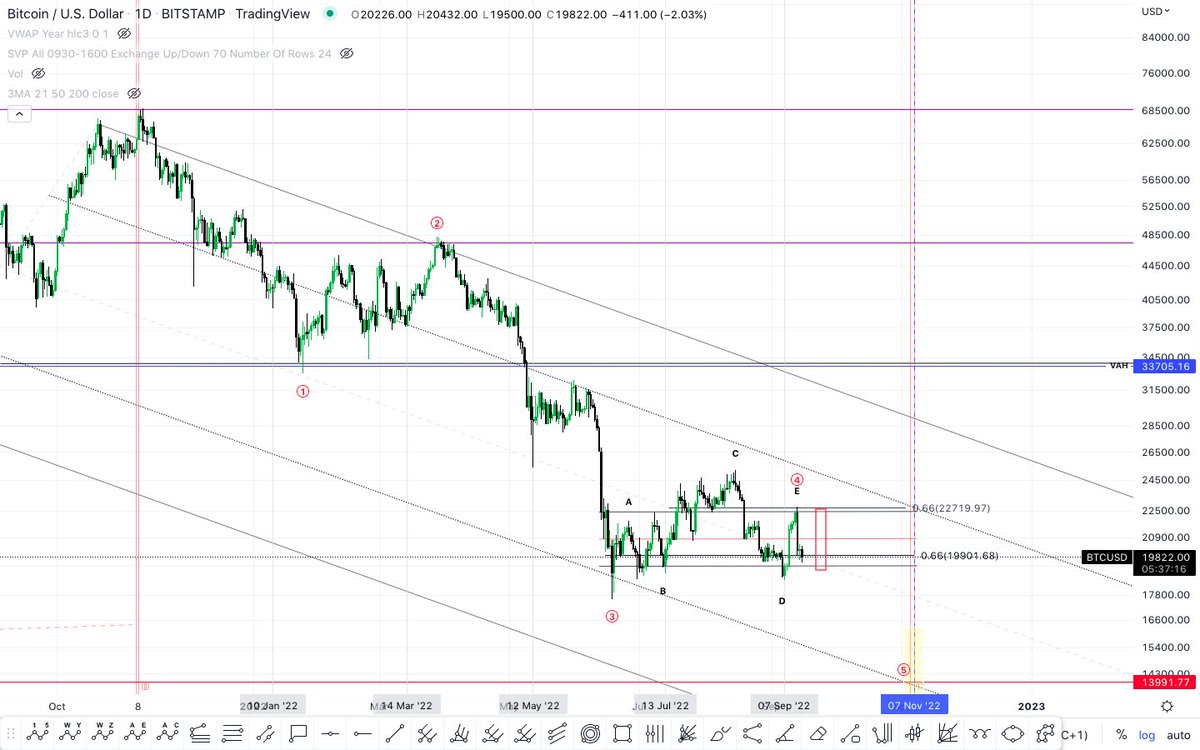
Chart 5) #api3 I track the high risk assets (liquidity will leave these first) The cycle patterns have been hit consistently. The recent cycle is slightly left translated, so one would assume a lower low will be printed. I am more interested in the date (again early November).
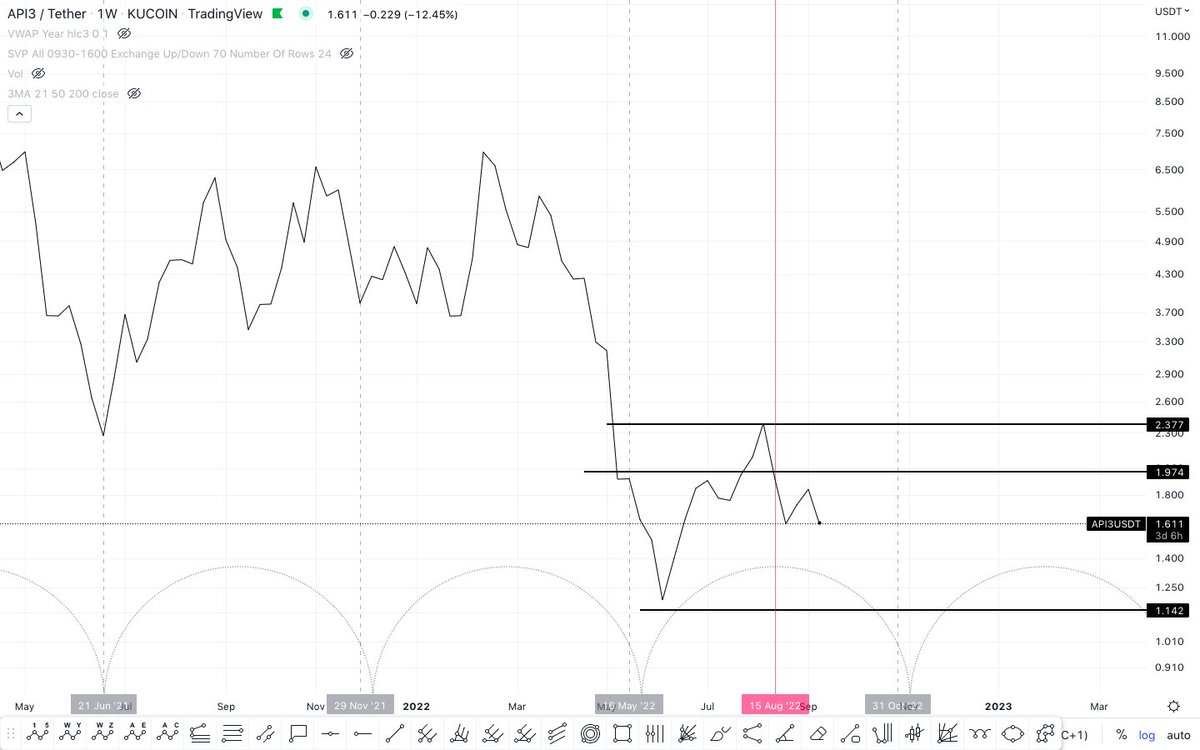
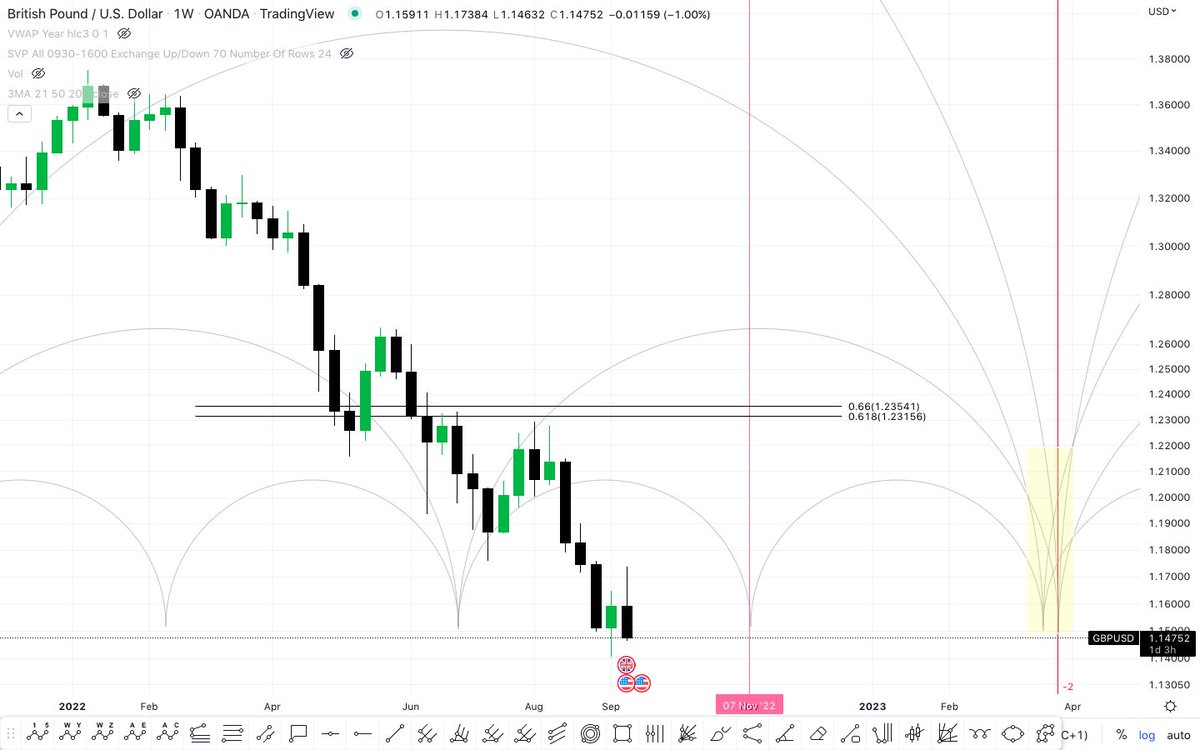
Chart 6) GBP. st low is again projected in early November. Interestingly the dominant low is in April 2023, which is the same as the SPX (maybe a good candidate for a bear market low)
Conclusion (i). DXY is showing great strength, based on EW count, cycle analysis & fib extension targets, it is due for a pull back. We could anticipate a top sometime in October. It does however seem as though 2023 will be a period of strength for this index (continuation of QT)
(ii) Risk on assets are in sync for a low sometime in Oct/ early Nov. BUT based on the EW & DXY I think we should be cautious in 2023. I do think probability favours a more prolonged rally. DXY low due in December. So late Oct/ Nov - Dec could be the time risk assets see relief
(iii) More htf we can see a lot of confluence around March - April 2023 for a more significant low. The caveat here re #Bitcoin is that it is a risk on asset, so these assets get sold off first but bought back first. But I aways go ABC before 12345
(iv) IMO now is the time to plan for an end of year rally from October to December, but managed your risk. Yes I have, after 11 moths, FINALLY posted something moderately bullish. Will continue to update as we get more data. Please consider liking if you find these updates useful
Loading suggestions...