

Dynamic hedging of a long call 101
This is going to be a really rough basics of dynamic hedging with no math. It's how I taught the Salomon Brothers and Bridgewater associates training class this topic. Just concepts. It's important to understand because sometimes the dynamic
This is going to be a really rough basics of dynamic hedging with no math. It's how I taught the Salomon Brothers and Bridgewater associates training class this topic. Just concepts. It's important to understand because sometimes the dynamic
Hedging activity in the market dominates all other flow. So what is it. Basically when someone is long an option and all they want to capture is the difference between the implied volatility the paid and the realized volatility the experience. Many market participants want
This sort of exposure. Many others have it thrust upon them as market makers in options. So let's explain how it works. First you've probably seen this payoff graph. I stole it from investopedia because I'm writing this on my phone
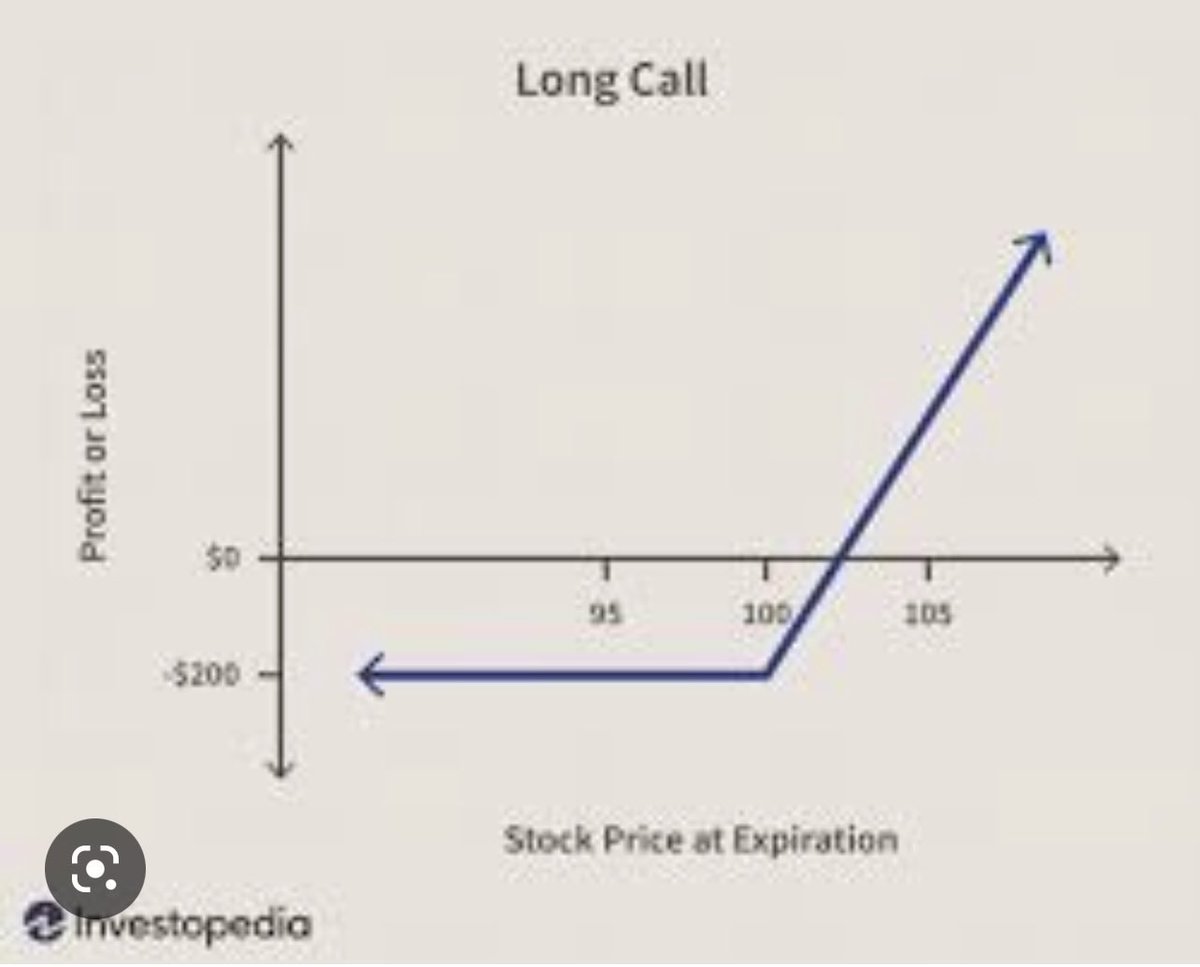
It is 100 strike call that someone paid $2 per contract with the contract size the standard 100 shares per contract. Notice that the owner makes money above 102 and loses money capped at 200 as the stock falls below 102. Also notice that the upside above 102 is $ for $ with
Owning 100 shares. Okay this is the expiration payoff. But before the expiration the option trades more smoothly like this. Again drew this with my finger
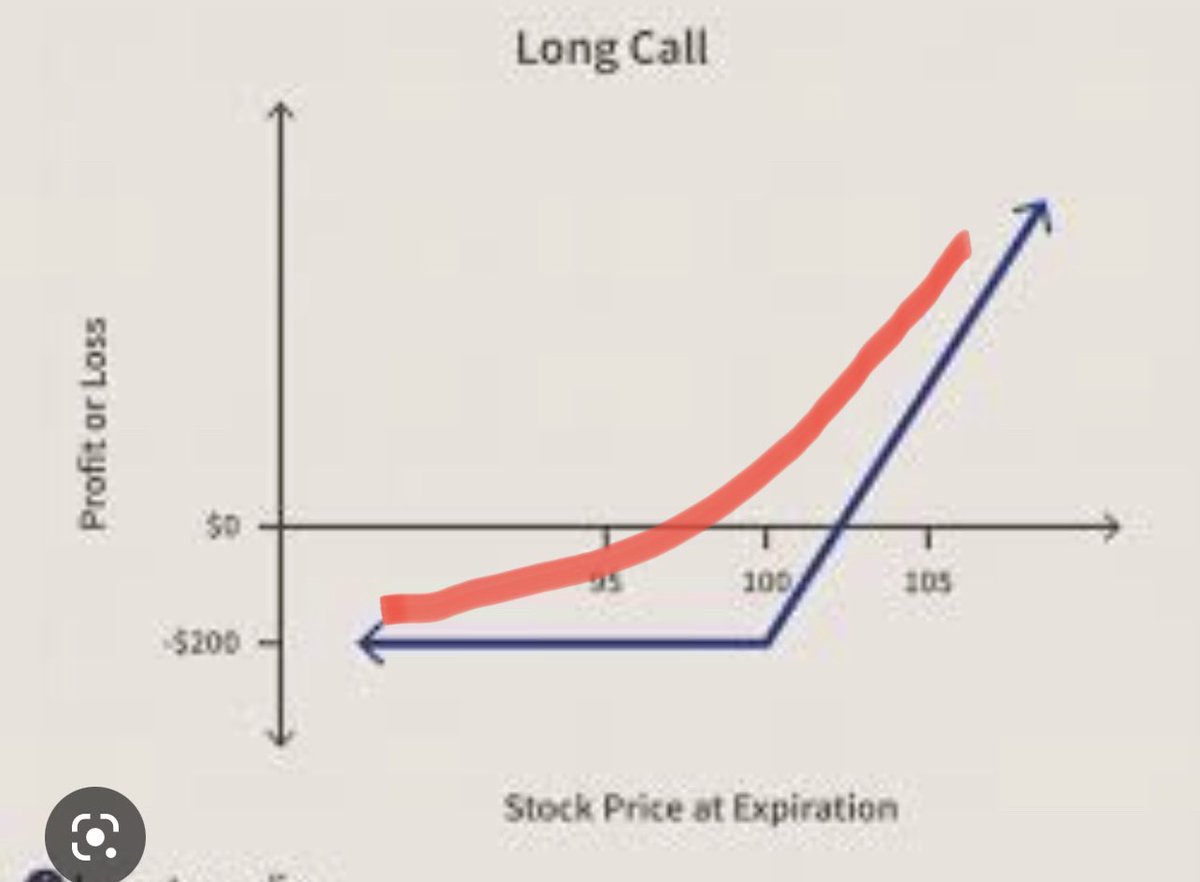
Notice the cup like shape that's called convexity. Also notice that the option price is 200 at about 98 and close to zero at call it zero at 85. Also notice at 110 it's starting to go up in price at 1 for 1 again but still trades at a slight premium to a share of stock.
Here's the money shot. Each of those green lines is a different slope. Flat on the left medium in the middle and steep on the right. These lines are actually the derivative of the red line determined at price of the stock. That's why derivatives are called derivatives imho.
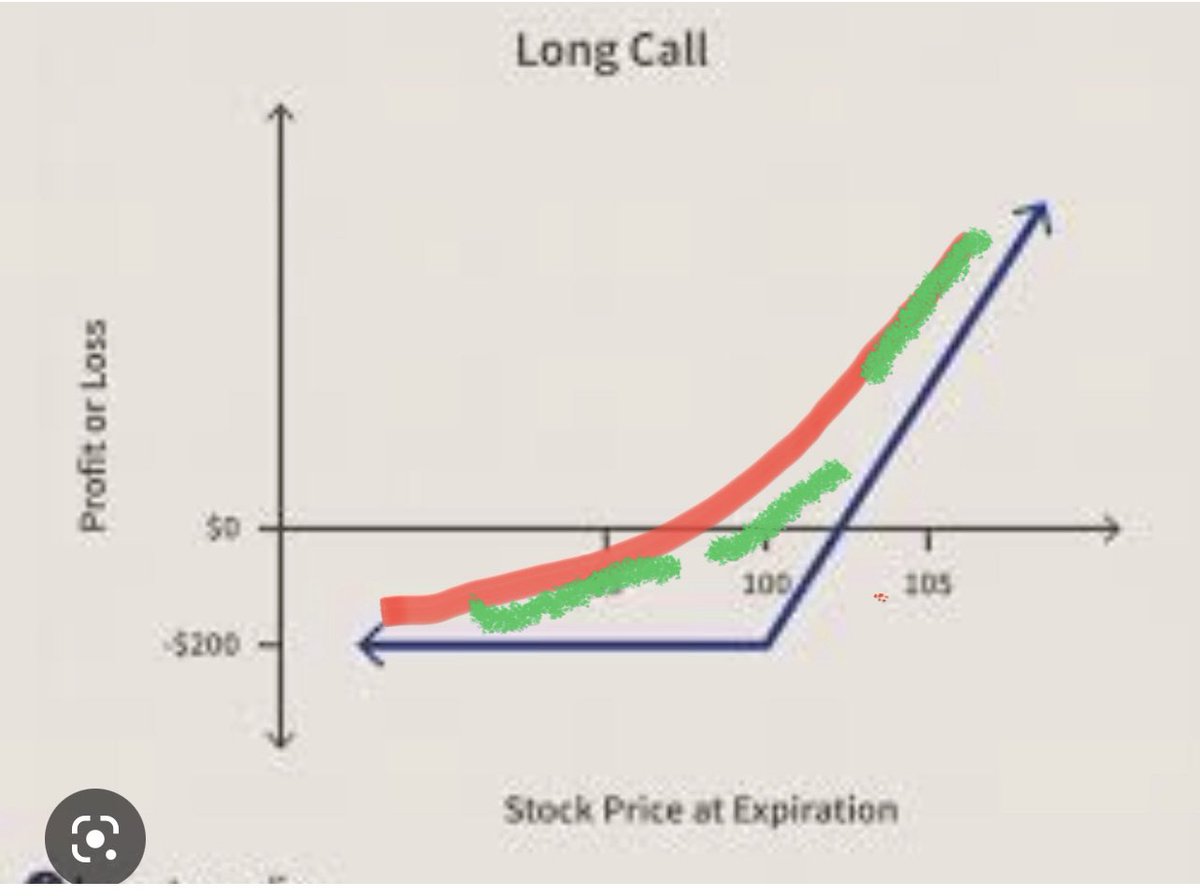
Anyway no more math. The important thing is each green line is represents the price change you would expect in the option for a change in the stock price. It's called the delta of the option. If you didn't get this go back and try again.
Ok here we go. If a buyer wants to
Ok here we go. If a buyer wants to
Capture the cheapness of an option but doesn't want to be on the direction she shorts the delta amount of stock. Let's say she pays $200 with the stock at 98 and calculates the delta as 50%. She shorts 50 shares and she now has no exposure to a change in price of the stock
But let's say the stock falls to 90. She now only needs 30% delta. Because the price of the option is less sensitive to the change in the stock price as it is out of the money. She buys 20 shares at 95 that she sold at 98 and books $60 in profit. Yay. Then the stock goes back
Up to 98 and she needs to sell 20 shares again. She is hedged. Then the stock goes up to 104 and the delta rises to 70%. She sells another 20 shares. Then the stock returns to 98 and she covers those 20 shares for a 6 point gain and books 120 bucks. Yay. This is great.
Just by delta hedging the hedger gets to buy low and sell high and book profits. But RIP the option expires and the hedger only has collected $180, it's out of the money and the the hedger closes out her hedge for 98. The option she paid 200 for is worthless and she only booked
180 in hedging profits. She loses $20. Why is that. When she paid $200 she expected to earn at least $200 in delta hedging profits but the realized volatility only allowed for $180 of profit. She paid too much implied volatility than was realized.
What's useful in this example is you can imagine the seller of the option delta hedging the exposure too. In this case the call seller would have bought 50 shares initially and sold 20 shares low at 95 bought 20 share back at 98 bought 20 shares at 104 and sold them at 98
Yuck he sold low and bought high. Losing money on every dynamic hedging transaction. BUT he was paid $200 upfront to do those money losing trades and the losses were less than $200. He made $20. That it. That's all that happens when people talk about gamma and dynamic hedging
However lots of weird things can happen when the options volumes are very high and the dynamic hedging is only done by one side of the trade. If the dynamic hedger is long the option and it's huge relative to volume/liquidity of the underlying the dynamic hedging of buying low
And selling high can dampen the volatility because real money buyers and sellers have a liquidity provider in the dynamic hedger. On the other hand if the option seller is the only side of the trade dynamically hedging they are selling into a down market and buying into an
Up market and they demand liquidity from the market and can exacerbate the volatility of the market. So when you read all these fintwit gamma graphs. What these guys are attempting to do with some neat tic data of each and every option trader is to assess whether a market maker
Bought the option traded or sold the option trade. The assumption being that a market maker is always dynamically hedging every trade. The other side of the trade is likely not dynamically hedging but many smart gamma graph providers humble those assumptions because the world
Doesn't work quite that cleanly. Anyway these gamma graphs show what the dynamic hedges are likely to be doing. Exacerbating the volatility or dampening it. Useful! Anyway there are two topics I have written about dynamic hedging that people like. When a dynamic hedger
Is long a huge position they can pin the stock to a specific price. When meme guys gamma squeezed the market makers they introduced large volatility into the stocks. Here are both thread
This was about GME. Now 25
*95 ugh
Loading suggestions...