
Technology
Finance
Trading Strategies
Investing
Investment
Technical Analysis
Day Trading
Stock Trading

Day Trading Stocks On the 1-Minute Chart
It's simpler than you think.
Here's how to do it...within the first 30 mins of the trading day.
🧵👇👇
It's simpler than you think.
Here's how to do it...within the first 30 mins of the trading day.
🧵👇👇
Most people think of the 1-minute chart as "noisy."
It is actually very clean if you know what to look for.
Specific patterns, in specific conditions.
Let's get to it...
It is actually very clean if you know what to look for.
Specific patterns, in specific conditions.
Let's get to it...
We'll look at:
-what stocks to trade
-when to trade them
-a mammoth money-maker strategy
-things to watch for
-position sizing
-common issues
-learning more
-what stocks to trade
-when to trade them
-a mammoth money-maker strategy
-things to watch for
-position sizing
-common issues
-learning more
Types of stocks:
I only day trade stocks that tend to move a lot during the day. 5% or more per day as a long-term average.
With high volume: typically over 10 million share per day.
I update a list weekly:
tradethatswing.com
I only day trade stocks that tend to move a lot during the day. 5% or more per day as a long-term average.
With high volume: typically over 10 million share per day.
I update a list weekly:
tradethatswing.com

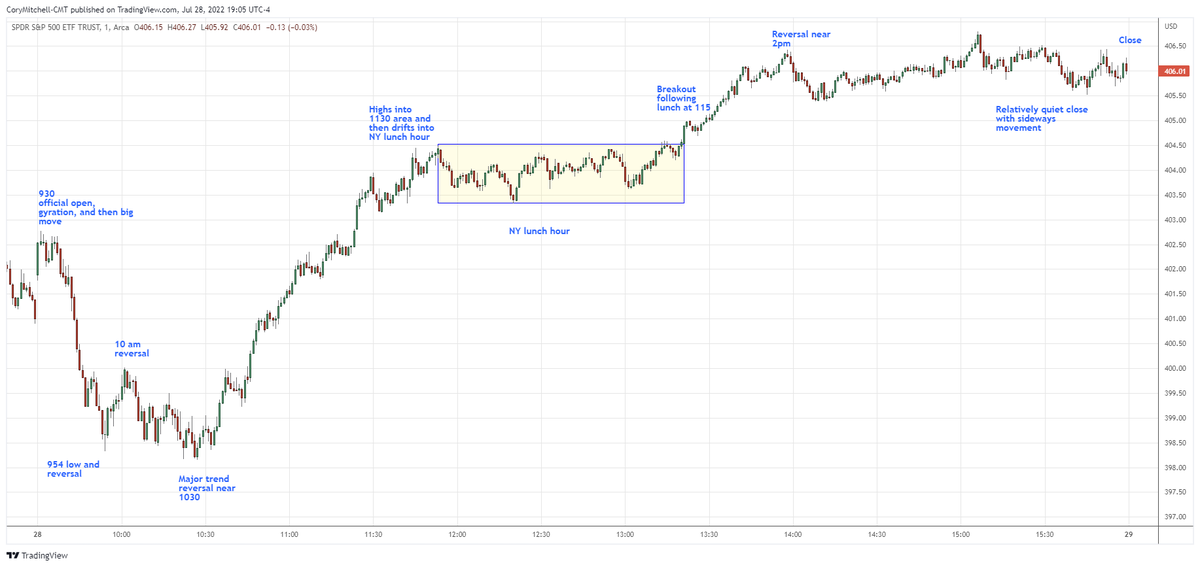
When to Day Trade Stocks:
The first 15 minutes of the day is my most profitable with the method below.
The first 90 minutes of the day is good overall.
Avoid trading 1130 - 1330 EST.
The last 60-90 minutes of the session is good if you want to get more trading in.
The first 15 minutes of the day is my most profitable with the method below.
The first 90 minutes of the day is good overall.
Avoid trading 1130 - 1330 EST.
The last 60-90 minutes of the session is good if you want to get more trading in.
Why avoid the NY lunch hour?
I was a prop-firm trader for 7 years. Most everyone lost money during lunch.
Price action tends to be choppier.
There are certain intraday price patterns that tend to play out day after day.
See them here: tradethatswing.com
I was a prop-firm trader for 7 years. Most everyone lost money during lunch.
Price action tends to be choppier.
There are certain intraday price patterns that tend to play out day after day.
See them here: tradethatswing.com

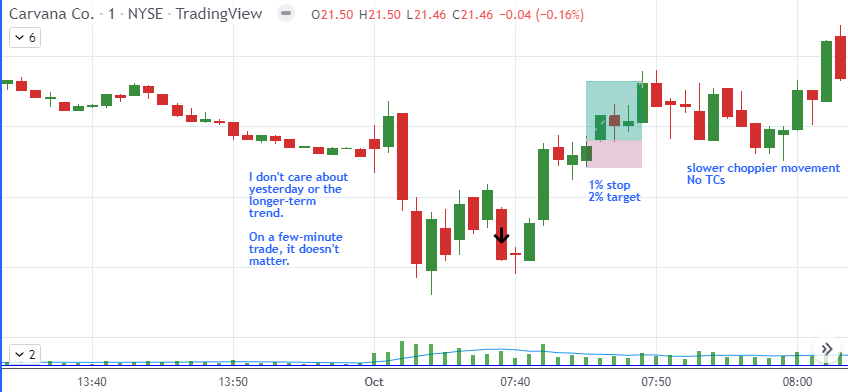
Day Trading Stocks Strategy:
The Trend Continuation (TC) is a simple yet powerful pattern.
To short:
-sharp drop (near vertical is better)
-wait for pullback
-enter short when price drops below the last candle low in the pullback
-stop loss above that candle
-2:1 target
The Trend Continuation (TC) is a simple yet powerful pattern.
To short:
-sharp drop (near vertical is better)
-wait for pullback
-enter short when price drops below the last candle low in the pullback
-stop loss above that candle
-2:1 target
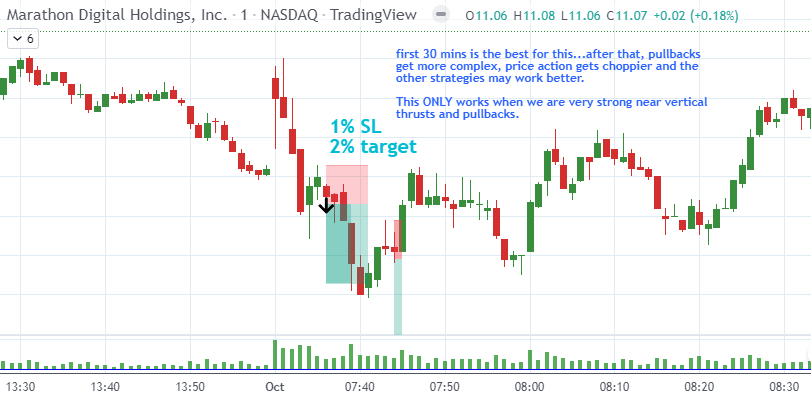
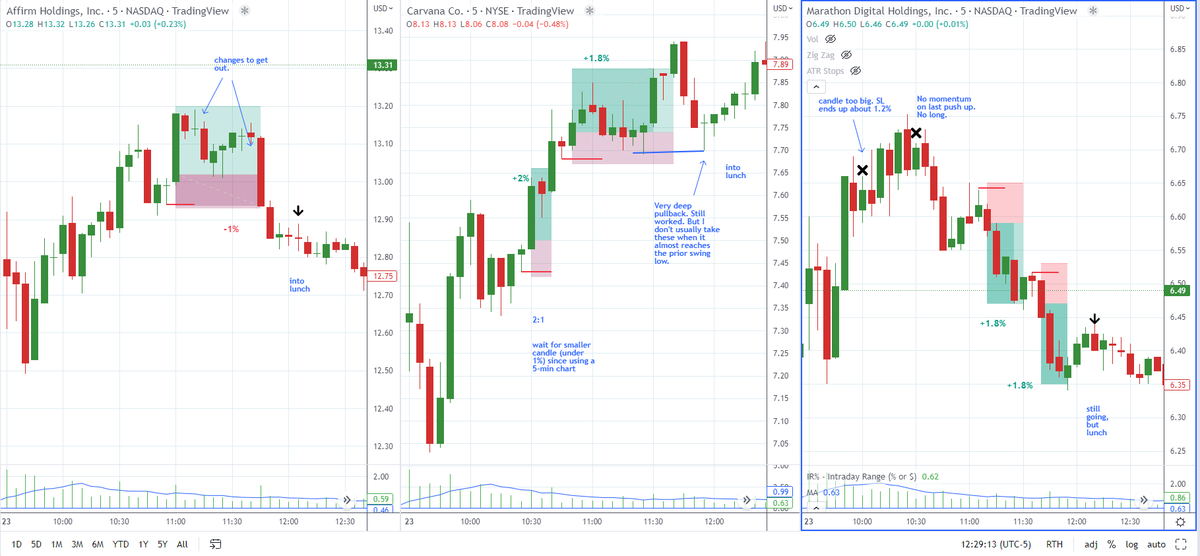
In the example above, sharp drop.
There's a visible pullback.
Enter IF and WHEN the price drops below the last candle low.
Price drops below the green candle low. Enter short.
Stop loss above the green candle.
Target at 2x stop loss size.
There's a visible pullback.
Enter IF and WHEN the price drops below the last candle low.
Price drops below the green candle low. Enter short.
Stop loss above the green candle.
Target at 2x stop loss size.
We can estimate our SL size before the trade because we can only enter if the price drops below a CLOSED candle.
Our stop loss will be slightly bigger than that closed candle if the price drops below it triggering us into a trade.
Our stop loss will be slightly bigger than that closed candle if the price drops below it triggering us into a trade.
Measure the size of the vertical drop that occurred before the pullback.
If it was a 3% drop, your target should be less than that with a 2:1 reward:risk. If it isn't, don't take the trade.
0.5% to 1% SL is fine. You can use a 1%-2% target.
2% stop loss bad (4% target).
If it was a 3% drop, your target should be less than that with a 2:1 reward:risk. If it isn't, don't take the trade.
0.5% to 1% SL is fine. You can use a 1%-2% target.
2% stop loss bad (4% target).
Use $ if you prefer.
$0.40 drop, then pullback.
Only trade if target is >$0.30 (>$0.15 for SL). Be conservative. Big moves won't keep happening in the same direction forever.
This strategy aims to get in & out, not hold through lots of pullbacks.
See: tradethatswing.com
$0.40 drop, then pullback.
Only trade if target is >$0.30 (>$0.15 for SL). Be conservative. Big moves won't keep happening in the same direction forever.
This strategy aims to get in & out, not hold through lots of pullbacks.
See: tradethatswing.com

If you want to hold through pullbacks, you can. Compensate yourself with bigger targets.
The more pullbacks we hold through the more likely one of them will reverse.
I prefer to avoid holding through pullbacks, that's why I measure waves & put my target INSIDE typical movement.
The more pullbacks we hold through the more likely one of them will reverse.
I prefer to avoid holding through pullbacks, that's why I measure waves & put my target INSIDE typical movement.
To go long:
-sharp rise (near vertical is better)
-wait for pullback
-enter long when price rises above the last candle high in the pullback
-stop loss below that candle
-2:1 target
-sharp rise (near vertical is better)
-wait for pullback
-enter long when price rises above the last candle high in the pullback
-stop loss below that candle
-2:1 target
Things to Watch For:
The vertical rise of fall is key. We usually get these types of moves in the first 30 mins of the day.
I don't care about yesterday or pre-market, only what's happening today, on this time frame.
The vertical rise of fall is key. We usually get these types of moves in the first 30 mins of the day.
I don't care about yesterday or pre-market, only what's happening today, on this time frame.
When starting out, stick to 1 entry per pullback.
If it keeps pulling back (a loss). Leave it. Await another setup.
As your skill improves you can add in trying to enter again. Without skill and practice, it's easy to lose multiple times in a row when a pullback keeps going.
If it keeps pulling back (a loss). Leave it. Await another setup.
As your skill improves you can add in trying to enter again. Without skill and practice, it's easy to lose multiple times in a row when a pullback keeps going.
Also, it is a TREND continuation...
My definition of a trend, for trading purposes, is very simple:
For an uptrend, price must have made a higher swing high (relative to prior swing high).
My entry must occur above the prior swing low (so the entry is at a higher swing low).
My definition of a trend, for trading purposes, is very simple:
For an uptrend, price must have made a higher swing high (relative to prior swing high).
My entry must occur above the prior swing low (so the entry is at a higher swing low).
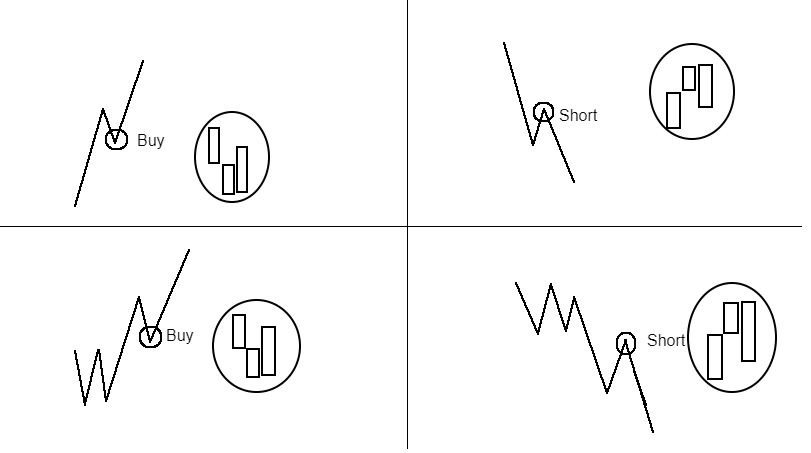
For a downtrend, price must have made a lower swing low (relative to prior swing low).
My entry must occur below the prior swing high (so the entry is at a lower swing high).
Look at the trades above. These rules are in play.
My entry must occur below the prior swing high (so the entry is at a lower swing high).
Look at the trades above. These rules are in play.
This is more to understanding price action than just these concepts, yet those rules above define much of what I do and how I trade.
For more on understanding price action and trading off of it, See: tradethatswing.com
For more on understanding price action and trading off of it, See: tradethatswing.com

Position Sizing:
We can estimate SL size before the TRADE.
We know our ACCOUNT value.
Don't risk more than 1% of the ACCOUNT per TRADE.
0.25% or less when starting out.
Risking 1% may mean most of the account capital is deployed on the TRADE.
See: tradethatswing.com
We can estimate SL size before the TRADE.
We know our ACCOUNT value.
Don't risk more than 1% of the ACCOUNT per TRADE.
0.25% or less when starting out.
Risking 1% may mean most of the account capital is deployed on the TRADE.
See: tradethatswing.com

Some other tips:
Use a 5-minute chart if you prefer a less hectic pace.
2:1 reward to risk is a good starting point. You can start at 1.5:1 even. Work up to 2.5 or 3:1 when the market allows (prior wave size helps us determine this).
5 min chart👇
Use a 5-minute chart if you prefer a less hectic pace.
2:1 reward to risk is a good starting point. You can start at 1.5:1 even. Work up to 2.5 or 3:1 when the market allows (prior wave size helps us determine this).
5 min chart👇
If the price is very close to a target and starts pulling way, just close the trade.
The market did what we thought.
Don't give up nearly a full profit to make a tiny bit more.
Over time you can refine these early exit rules based on your results and testing.
The market did what we thought.
Don't give up nearly a full profit to make a tiny bit more.
Over time you can refine these early exit rules based on your results and testing.
Common issues:
Trading when there's no vertical move, or vertical move is small. I need to see a strong move up/down to trade a TC. As momentum dies, don't trade this.
Trading when SL is too big for price waves. Target should be easily hit with 2:1 based on recent movement.
Trading when there's no vertical move, or vertical move is small. I need to see a strong move up/down to trade a TC. As momentum dies, don't trade this.
Trading when SL is too big for price waves. Target should be easily hit with 2:1 based on recent movement.
Learn this strategy more in-depth, as well as other strategies, in the Price Action Stock Day Trading Course.
Learn when to hit the gas and when to hit the brakes.
Learn to fine-tune the entry points to avoid whipsaws and gain further confirmation.
tradethatswing.com
Learn when to hit the gas and when to hit the brakes.
Learn to fine-tune the entry points to avoid whipsaws and gain further confirmation.
tradethatswing.com

If you enjoyed this, and want to learn more about day trading (stocks and forex) give me a follow @corymitc.
Retweet this thread it you believe it will help others.
But most of all, I hope you learned something and your trading improves as a result.
Retweet this thread it you believe it will help others.
But most of all, I hope you learned something and your trading improves as a result.
Loading suggestions...