

1/16
Thread about how I use Open Interest and Cumulative Volume Delta to adjust my timing when it comes to entering a trade
Rules are pretty simple, but they give me a good confluence with regular TA.
@coinalyzetool has all you need, so let's get started:
Thread about how I use Open Interest and Cumulative Volume Delta to adjust my timing when it comes to entering a trade
Rules are pretty simple, but they give me a good confluence with regular TA.
@coinalyzetool has all you need, so let's get started:
I'll start by defining these key concepts.
OI: amount of contracts open in a market. OI going up means more money is entering in the market, it going down means money is leaving. Nothing more nothing less.
OI: amount of contracts open in a market. OI going up means more money is entering in the market, it going down means money is leaving. Nothing more nothing less.
CVD: delta is the difference between longs and shorts (or buyers and sellers). The cumulative part of the name comes from the fact that values of previous candles are also added, so you can see the evolution of delta.
I'm also dividing between spot and futures CVD in this thread
I'm also dividing between spot and futures CVD in this thread
Let's talk as well about the correlation between these two, so you can experiment outside of my explanation.
OI up, CVD up = long opening
-OR-
More positions, more buyers = longs opening
OI up, CVD down = shorts opening
-OR-
More positions, more sellers = shorts opening
OI up, CVD up = long opening
-OR-
More positions, more buyers = longs opening
OI up, CVD down = shorts opening
-OR-
More positions, more sellers = shorts opening
OI down, CVD down = longs closing
-OR-
Less positions, less buyers = longs closing
OI down, CVD up = shorts closing
-OR-
Less positions, less sellers = shorts closing
-OR-
Less positions, less buyers = longs closing
OI down, CVD up = shorts closing
-OR-
Less positions, less sellers = shorts closing
Hope this has been clear to you, if not, you can always reread or DM me and I'll explain more detailedly. But for now, I'll write about what conditions make me use these tools more:
First and foremost, not in ranging markets. It's totally useless.
Second, I have used Coinalyze for both BTC and alts.
Imo it's better for alts, but feel free to test on any coin that's decently liquid.
Second, I have used Coinalyze for both BTC and alts.
Imo it's better for alts, but feel free to test on any coin that's decently liquid.
Back to the first point, I like to use it on volatile markets, after an impulse and making sure my conclusions are aligned with the fundamental reason of why price is moving.
So this thread is also directed to narrative/news traders, which have been gaining traction lately.
So this thread is also directed to narrative/news traders, which have been gaining traction lately.
I think that was enough of an introduction, so let's get into what I look at, using $BIT as an example — one of my recent trades.
If you're going to trade news, going to say again to make sure you have fundamental confluence, always.
If you're going to trade news, going to say again to make sure you have fundamental confluence, always.
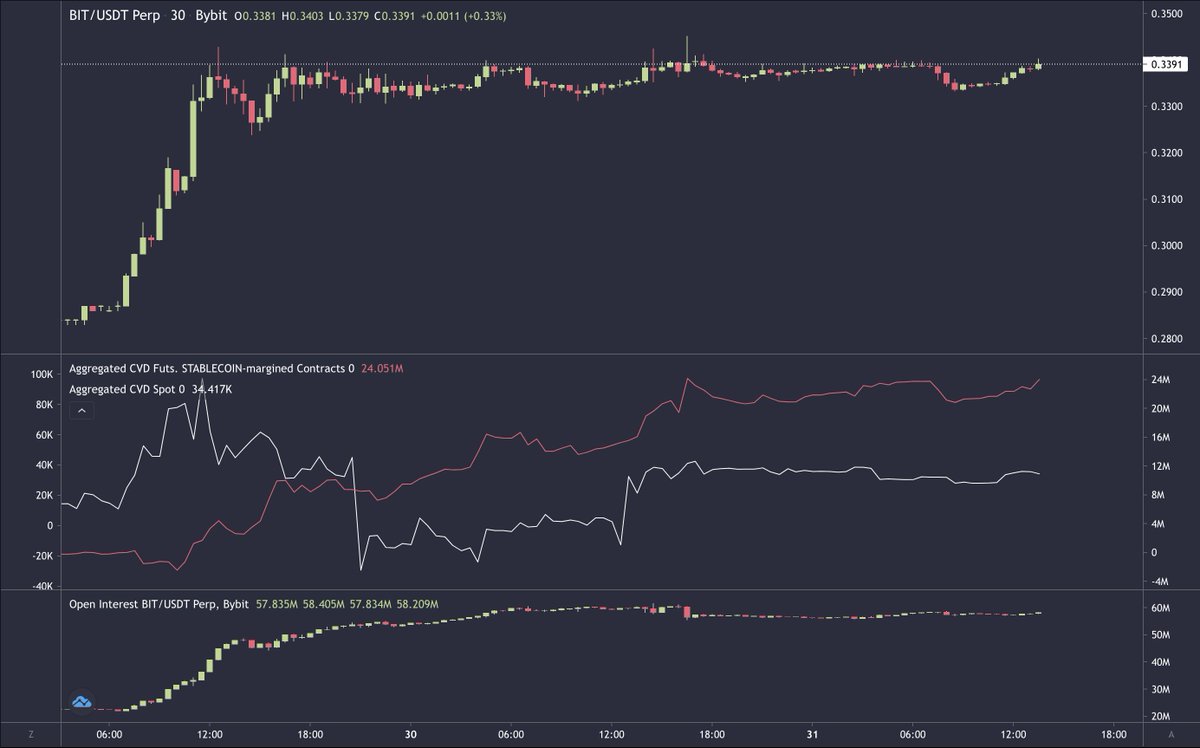
1. In a steady uptrend three things happen:
- OI grows due to new position being opened, more money flowing in.
- Futures/perps CVD increases due to usage of leverage
- Spot CVD can catch up, or it can not. If it doesn't, it's usually a sign to fade the move.
- OI grows due to new position being opened, more money flowing in.
- Futures/perps CVD increases due to usage of leverage
- Spot CVD can catch up, or it can not. If it doesn't, it's usually a sign to fade the move.
The last point is a key takeaway for this thread: "Spot and futures CVD diverging is never a good sign".
2. When price is more stable:
- OI is still growing steadily, and so is perps CVD.
- Spot CVD is actually decreasing
2. When price is more stable:
- OI is still growing steadily, and so is perps CVD.
- Spot CVD is actually decreasing
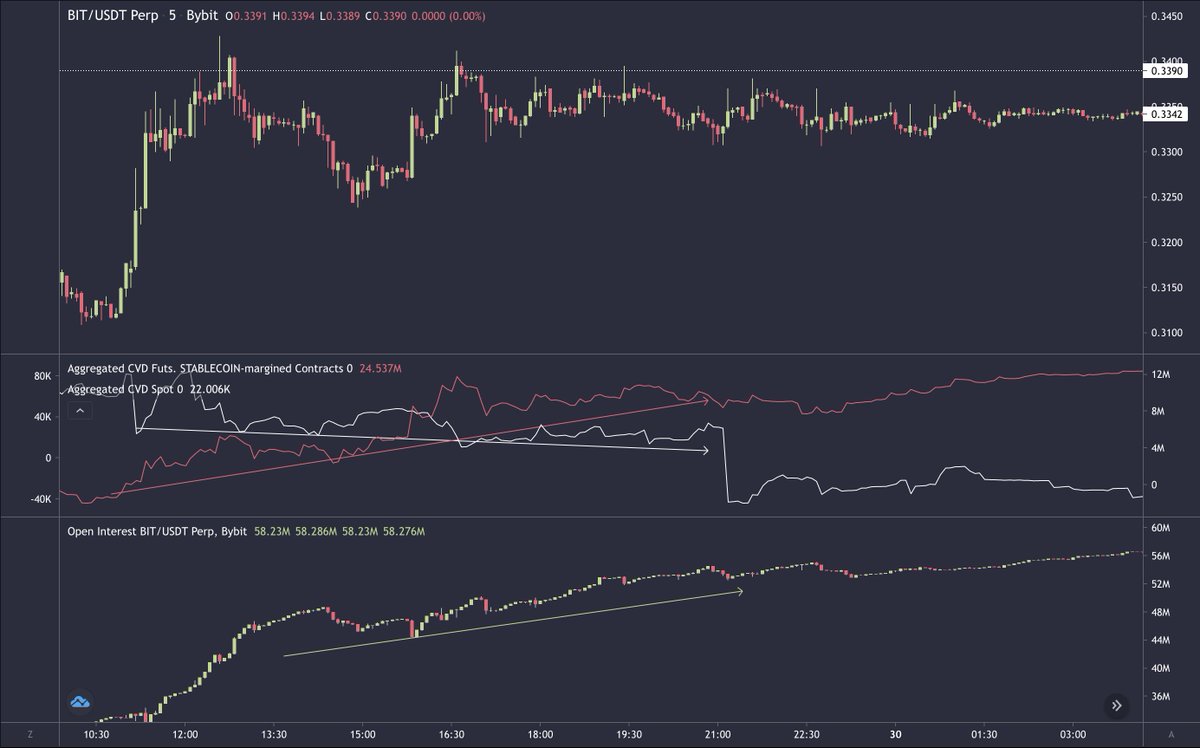
I just said, divergences are not a good sign. Well, there you had it. A brand new and shiny top and late longers are starting to come in. Now what?
3. First signs of reversal
- OI tops out, no more interest as market is already exhausted
- CVDs start decreasing as well
3. First signs of reversal
- OI tops out, no more interest as market is already exhausted
- CVDs start decreasing as well

Longs will be tired of waiting and exhausted or eventually liquidated due to smaller moves inside the consolidation
And then, we get back to phase 1, with a sole exception, which is that there can be a slower bleed instead of a fast retracement.
And then, we get back to phase 1, with a sole exception, which is that there can be a slower bleed instead of a fast retracement.
And these are the 3 stages to identify, you can either long (1) until it's finished — riding the trend — or you can prepare your position in (3).
Once more, don't use this alone, try to combine it with your trading style as none of this is serious advice, thus just my rants.
Once more, don't use this alone, try to combine it with your trading style as none of this is serious advice, thus just my rants.
I think I've explained enough today, so it's time to wrap up everything:
"Spot and perps CVD diverging is never a good sign"
"Money rotates from longs to shorts — or vice versa — by first flowing out of the market, and then flowing in again on the opposite side"
"Spot and perps CVD diverging is never a good sign"
"Money rotates from longs to shorts — or vice versa — by first flowing out of the market, and then flowing in again on the opposite side"
If you've made it to the end of the thread, really appreciate you and you're always invited to slide in my DMs to ask questions.
Like/RT if you enjoyed and have a happy 2023!
Like/RT if you enjoyed and have a happy 2023!
Loading suggestions...