

The P/E ratio sucks
It’s a metric that easily deceives investors
Here are 8 reasons why the P/E ratio can be INCREDIBLY misleading (and what metrics to use instead): ⤵️
It’s a metric that easily deceives investors
Here are 8 reasons why the P/E ratio can be INCREDIBLY misleading (and what metrics to use instead): ⤵️
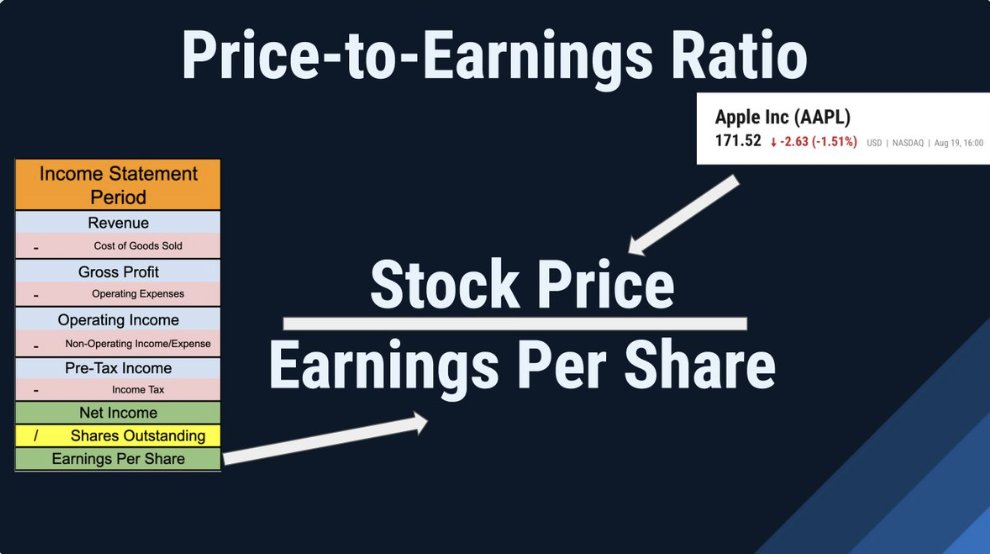
What is the P/E ratio?
P/E stands for “price-to-earnings”
It’s a simple metric for determining a company’s current valuation
It divides the stock price by the last 12 months of earnings per share
P/E stands for “price-to-earnings”
It’s a simple metric for determining a company’s current valuation
It divides the stock price by the last 12 months of earnings per share
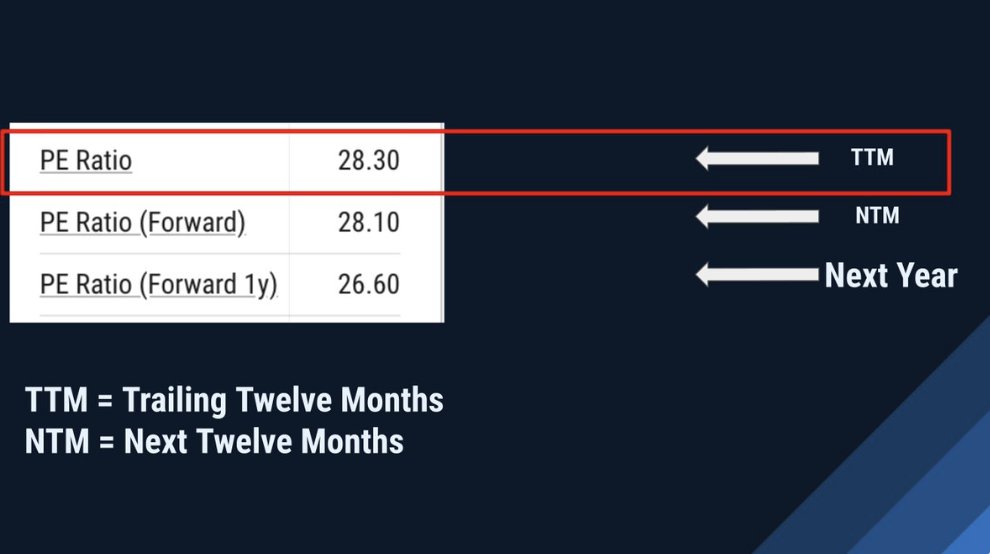
There are 3 main P/E ratios
They all use a different denominator
1: P/E TTM earnings (actual)
2: P/E Forward: NTM earnings (estimates)
3: P/E Forward 1 yr: Next Fiscal Year earnings (estimates)
#1 is the most popular & referenced by far
They all use a different denominator
1: P/E TTM earnings (actual)
2: P/E Forward: NTM earnings (estimates)
3: P/E Forward 1 yr: Next Fiscal Year earnings (estimates)
#1 is the most popular & referenced by far
What’s wrong with the P/E ratio?
It all boils down to the many ways that “Earnings” can be misleading
If “Earnings” aren’t sustainable or are artificially inflated/depressed, the P/E ratio doesn’t work
It all boils down to the many ways that “Earnings” can be misleading
If “Earnings” aren’t sustainable or are artificially inflated/depressed, the P/E ratio doesn’t work
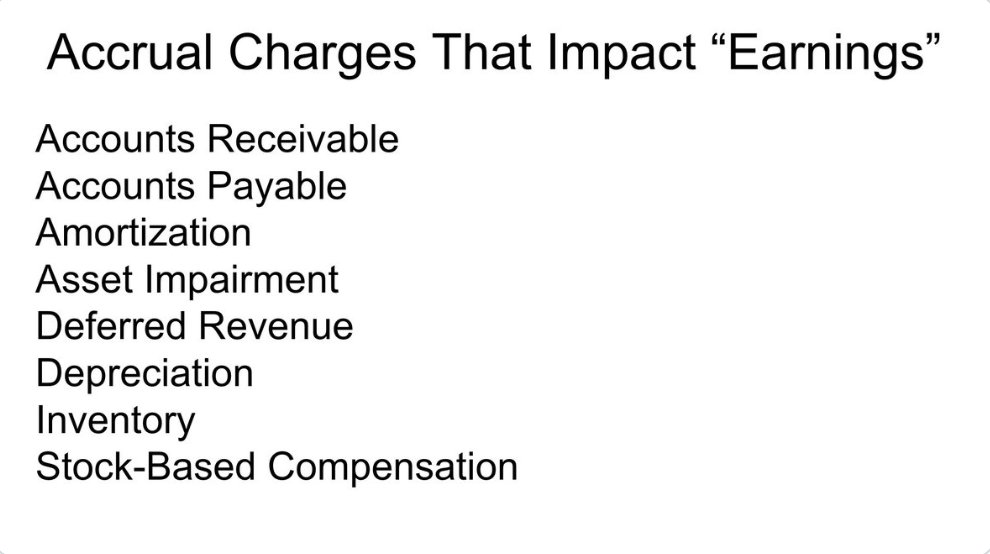
1: Accrual Accounting
The GAAP income statement uses accrual accounting
Accrual accounting is useful, but it’s basically an accountant’s opinion
There are lots of charges that can cause reported “Earning” to be higher or lower than the actual cash flow of a business
The GAAP income statement uses accrual accounting
Accrual accounting is useful, but it’s basically an accountant’s opinion
There are lots of charges that can cause reported “Earning” to be higher or lower than the actual cash flow of a business
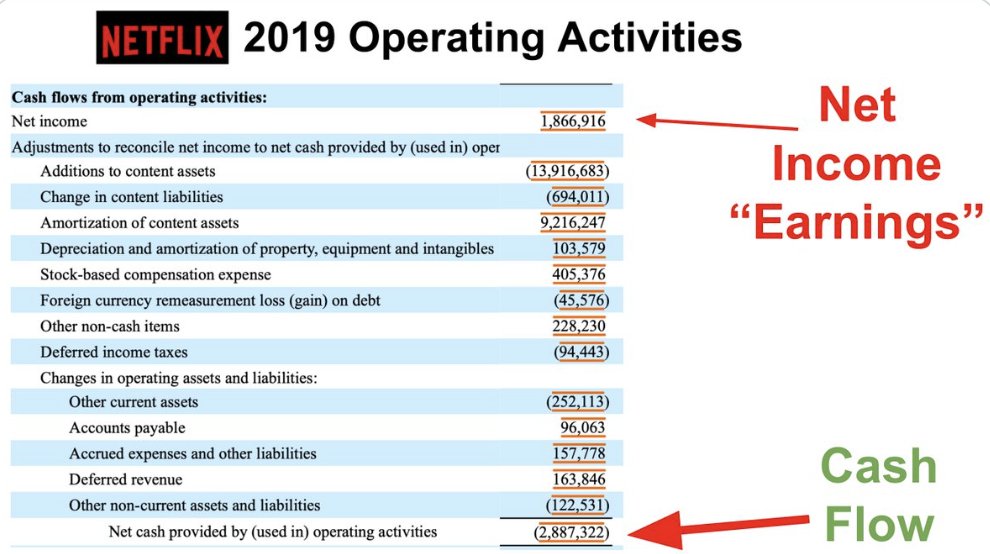
Ex: In 2019, $NFLX reported $1.9 billion in earnings, but its operating cash flow was NEGATIVE $2.9 billion
While it was “profitable” on a net income basis, its actual cash outflow was enormous
The P/E ratio doesn’t reflect this at all
While it was “profitable” on a net income basis, its actual cash outflow was enormous
The P/E ratio doesn’t reflect this at all
2: Equity investments
Some companies buy stock in other businesses
Ex: $SHOP owns a bunch of $AFRM stock
GAAP accounting requires that companies mark UP their “other income” when their investments increase in value and DOWN when they decline
Some companies buy stock in other businesses
Ex: $SHOP owns a bunch of $AFRM stock
GAAP accounting requires that companies mark UP their “other income” when their investments increase in value and DOWN when they decline
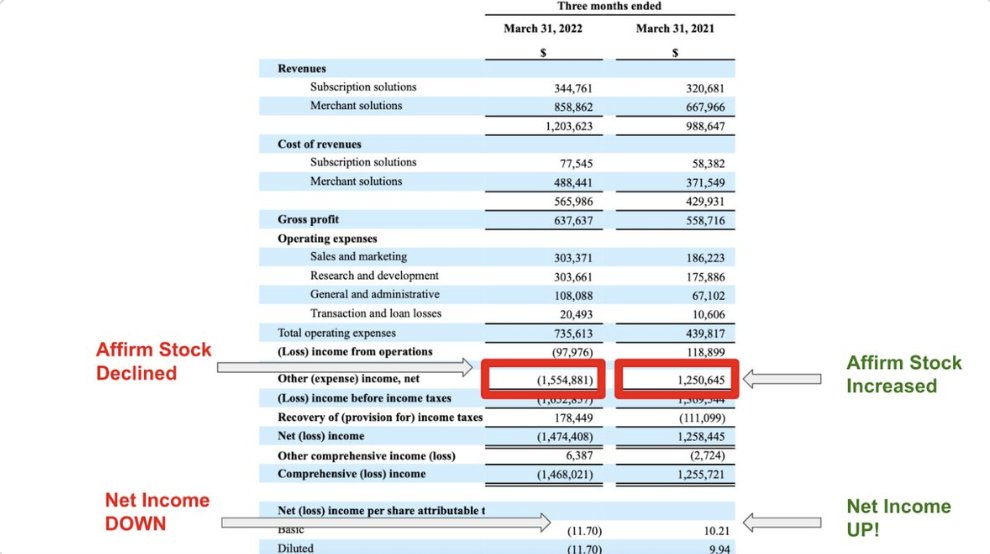
This is doing WILD things to $SHOP EPS, which makes its P/E ratio all but useless
The same is true for $AMZN, $BRK, $GOOG, $ABMD, and more
The same is true for $AMZN, $BRK, $GOOG, $ABMD, and more
3: One-time events
Ever receive a windfall?
Lottery? Bonus? Inheritance?
Companies receive windfalls from taxes, asset sales, and one-off deals
When this happens, “earnings” can SKYROCKET
Ever receive a windfall?
Lottery? Bonus? Inheritance?
Companies receive windfalls from taxes, asset sales, and one-off deals
When this happens, “earnings” can SKYROCKET
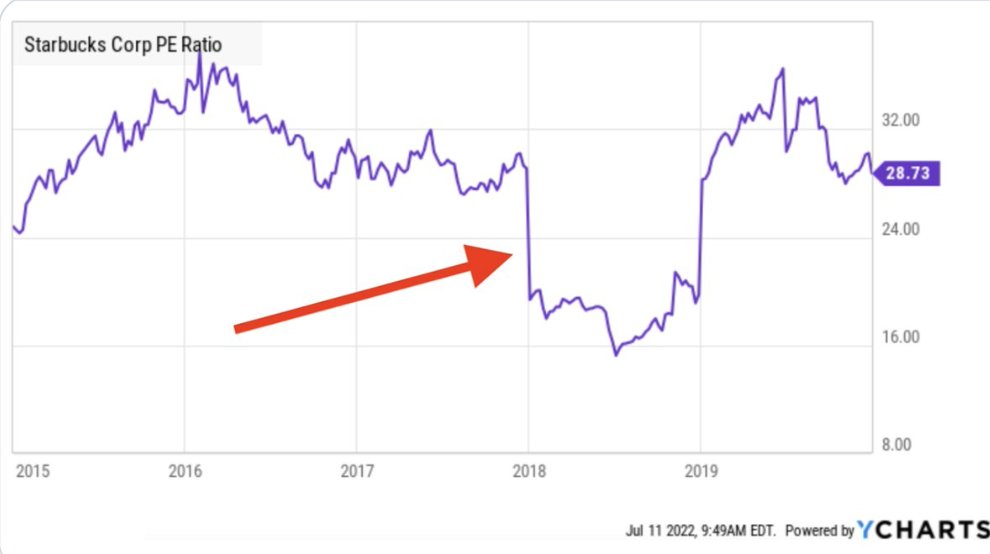
This happened to $SBUX in 2018
They received a $1.4 billion payment from a joint venture with Nestle
These HUGELY boosted earnings, which artificially DEPRESSED the P/E that whole year
During the year, the P/E ratio was artificially LOW, and it was a deceiving metric
They received a $1.4 billion payment from a joint venture with Nestle
These HUGELY boosted earnings, which artificially DEPRESSED the P/E that whole year
During the year, the P/E ratio was artificially LOW, and it was a deceiving metric
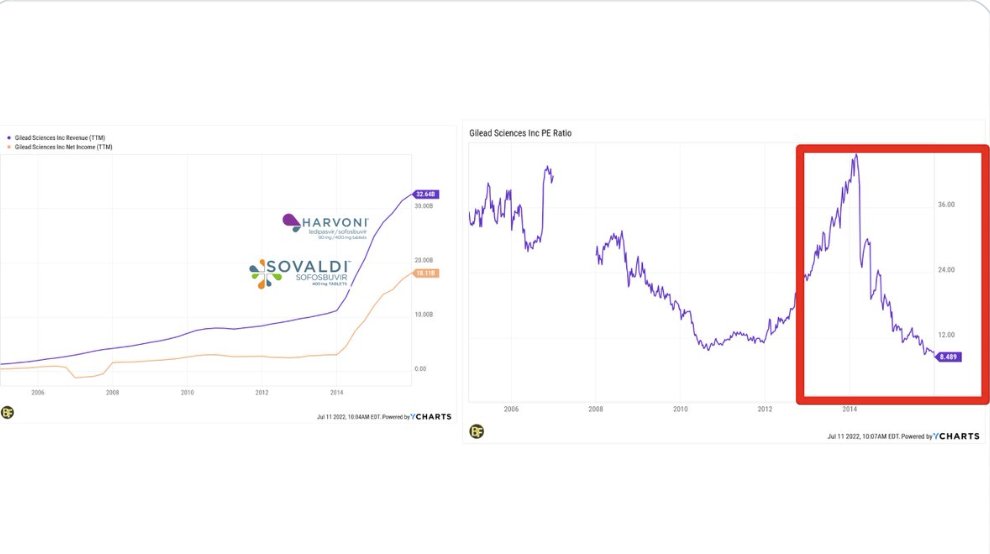
4: Unsustainable trend
Sometimes businesses ride a short-term trend that causes profits to boom
Ex: $GILD in 2014
It launched two blockbuster drugs that cured patients of Hepatitis-C
Revenue & profits EXPLODED, which caused the P/E ratio to sink to just 8!
Sometimes businesses ride a short-term trend that causes profits to boom
Ex: $GILD in 2014
It launched two blockbuster drugs that cured patients of Hepatitis-C
Revenue & profits EXPLODED, which caused the P/E ratio to sink to just 8!
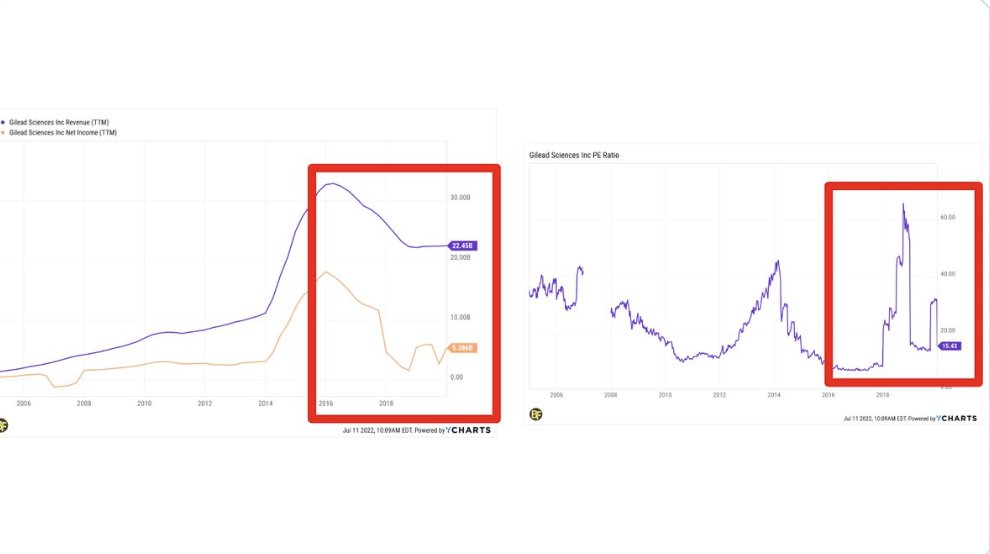
But, Gilead was riding an unsustainable trend
Competition soon entered, which drove prices down, down, down
Revenue & profits fell sharply, which cause the P/E ratio to expand
If you bought because of the “cheap” P/E ratio (like me), you did poorly
Competition soon entered, which drove prices down, down, down
Revenue & profits fell sharply, which cause the P/E ratio to expand
If you bought because of the “cheap” P/E ratio (like me), you did poorly
5: Disruption
Sometimes a company’s earnings are in a permanent state of decline due to disruption
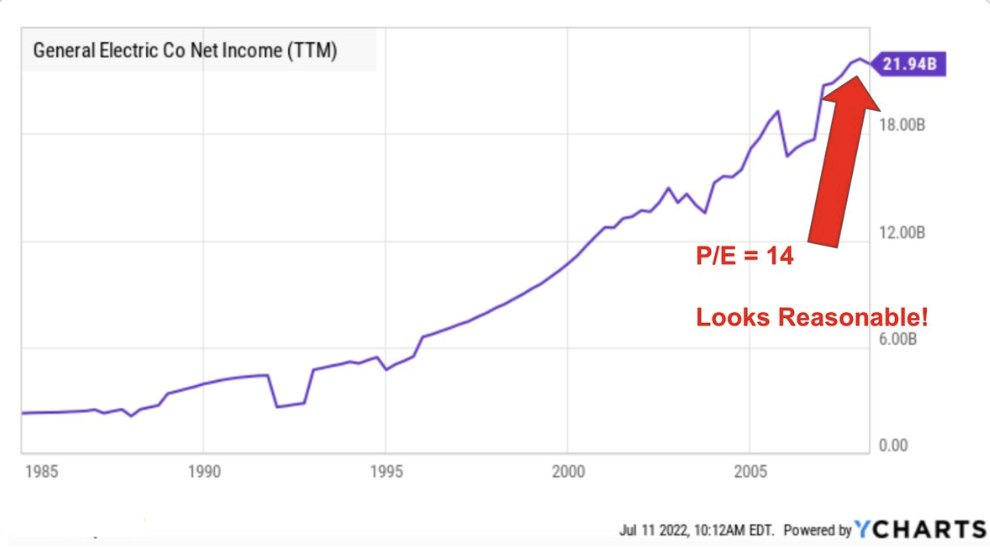
Consider what has happened to $GE
Net income had grown for a century+, and in 2008 its P/E ratio was just 14. Reasonable!
Sometimes a company’s earnings are in a permanent state of decline due to disruption
Consider what has happened to $GE
Net income had grown for a century+, and in 2008 its P/E ratio was just 14. Reasonable!
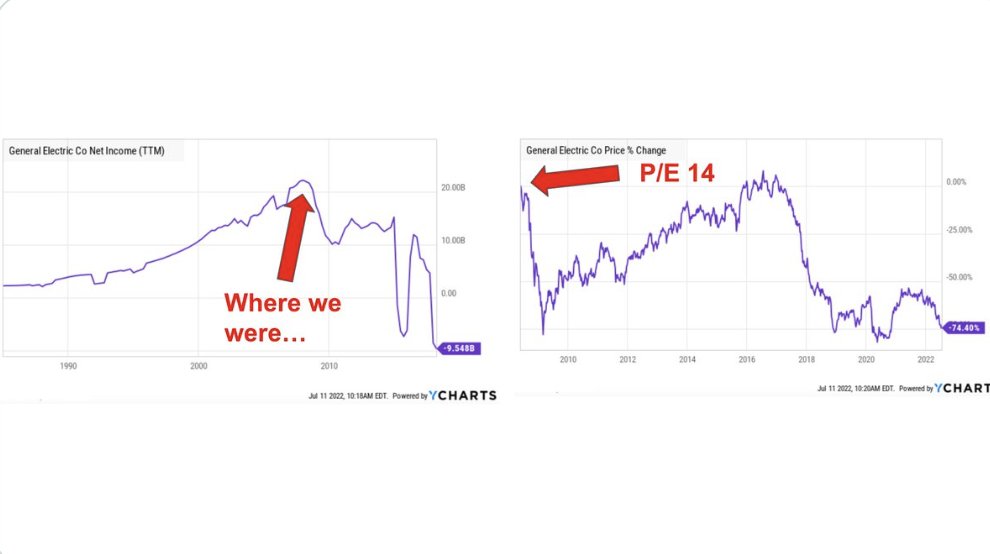
It turns out that $GE made a series of big bets that didn’t pay off, partially due to disruption
Net income was at a peak
Shareholders are down ~70+% since they, even though they thought they were buying a “blue chip” at a reasonable P/E ratio
Net income was at a peak
Shareholders are down ~70+% since they, even though they thought they were buying a “blue chip” at a reasonable P/E ratio
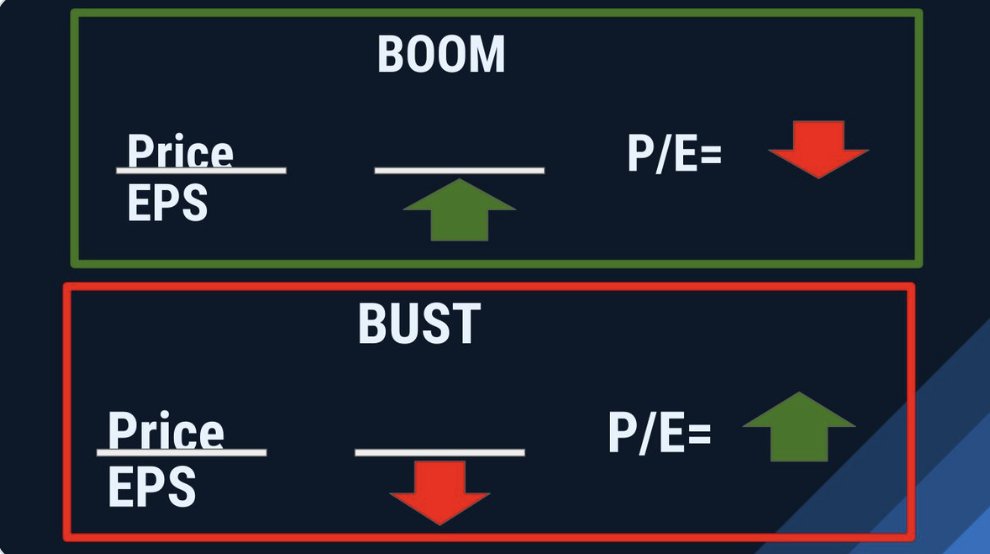
6: Cyclical demand
Some industries are prone to frequent booms and busts
Earnings explode during boom times and crash during bust times
For these companies, the P/E ratio literally works backward
Some industries are prone to frequent booms and busts
Earnings explode during boom times and crash during bust times
For these companies, the P/E ratio literally works backward
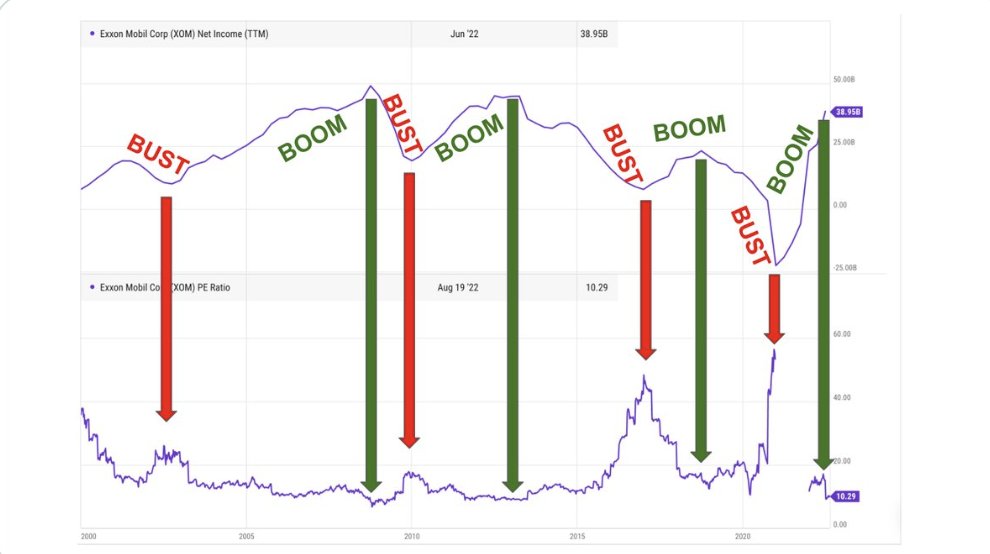
Consider $XOM
Profits surges when energy prices are high and sink when they fall
The worst time to invest is at a cyclical peak, which is when the P/E ratio looks cheapest (the inverse is also true)
Profits surges when energy prices are high and sink when they fall
The worst time to invest is at a cyclical peak, which is when the P/E ratio looks cheapest (the inverse is also true)
7: Industries Dynamics
There are several industries where the P/E ratio just doesn’t work because of the nature of the industry
Ex:
Banks: Credit cycles
Biotech: Losses, then a big payout
REITs: High depreciation charges
For these industries, the P/E ratio doesn't work
There are several industries where the P/E ratio just doesn’t work because of the nature of the industry
Ex:
Banks: Credit cycles
Biotech: Losses, then a big payout
REITs: High depreciation charges
For these industries, the P/E ratio doesn't work
8: Business Growth Cycle
When a new company is created, it is optimized for GROWTH, not profits
Management plows all available resources into hiring & expansion
This artificially UNDERSTATES the true earnings power of the business, which artificially OVERSTATES the P/E ratio
When a new company is created, it is optimized for GROWTH, not profits
Management plows all available resources into hiring & expansion
This artificially UNDERSTATES the true earnings power of the business, which artificially OVERSTATES the P/E ratio
Look at $AMZN
For decades, the company was optimized for growth, not earnings, so the P/E ratio looked crazy
In 2017, it finally started to optimize for earnings
For decades, the company was optimized for growth, not earnings, so the P/E ratio looked crazy
In 2017, it finally started to optimize for earnings
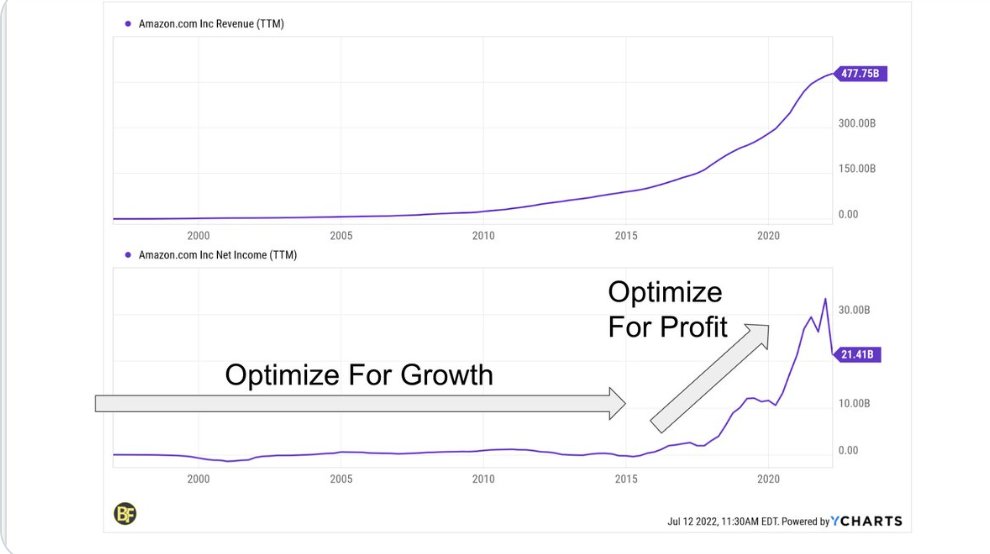
Even today, $AMZN is dealing with overspending from the COVID boom. It’s still NOT optimized for earnings
The P/E ratio will only be useful once the true earnings power of the business shines through
The P/E ratio will only be useful once the true earnings power of the business shines through
What can investors do about this?
Learn when the P/E ratio is USEFUL and when it’s USELESS
Use other metrics when earnings are overstated/understated
Learn when the P/E ratio is USEFUL and when it’s USELESS
Use other metrics when earnings are overstated/understated
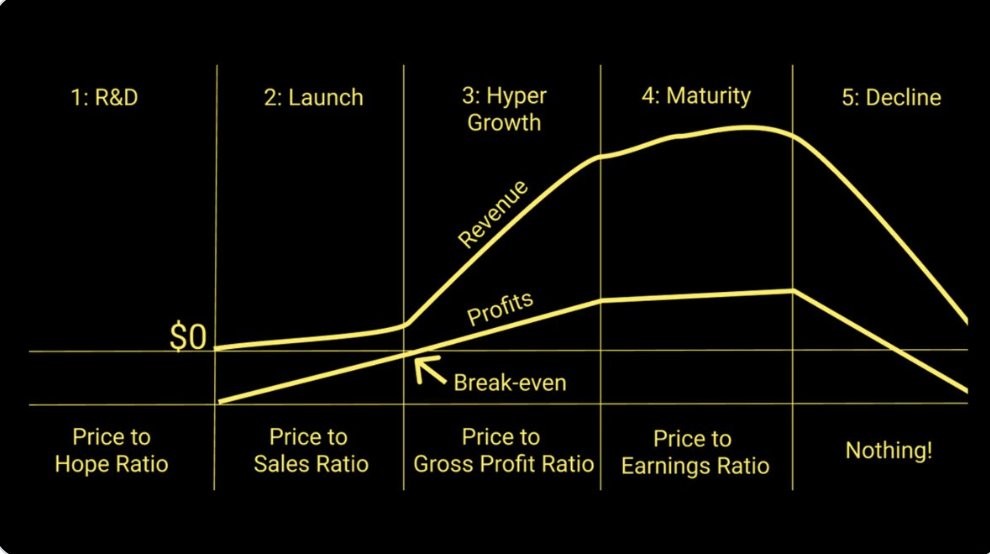
*Key Question*
What part of the income statement is the company currently optimized for?
Sales ➡️ P/S ratio
Gross Profit ➡️ P/Gross Profit ratio
Operating Income➡️ P/EBIT ratio
Earnings➡️ P/E Ratio
Free Cash Flow➡️P/FCF Ratio
What part of the income statement is the company currently optimized for?
Sales ➡️ P/S ratio
Gross Profit ➡️ P/Gross Profit ratio
Operating Income➡️ P/EBIT ratio
Earnings➡️ P/E Ratio
Free Cash Flow➡️P/FCF Ratio
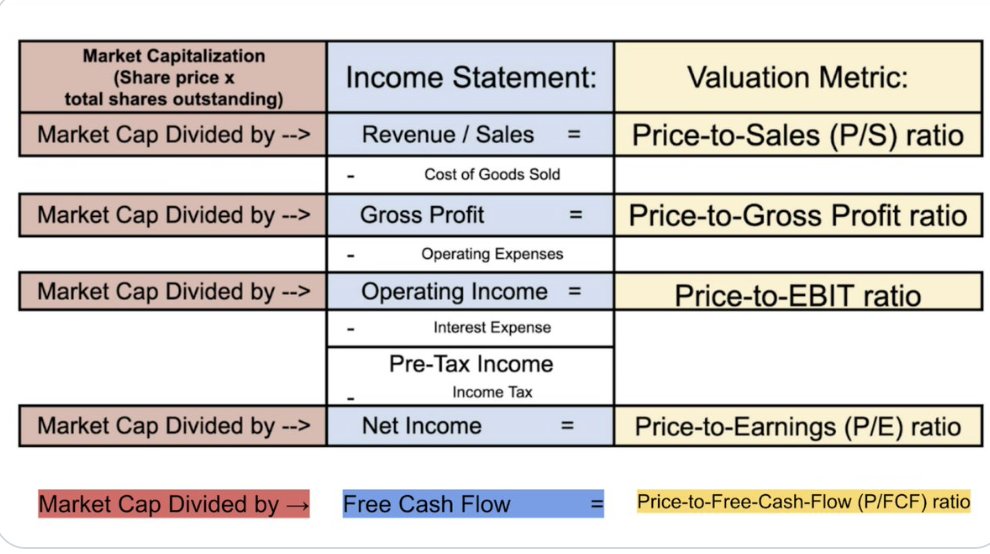
Use this picture as a general guide
(and understand that it has flaws and is FAR from perfect)
(and understand that it has flaws and is FAR from perfect)
Find this helpful? You'll LOVE the course @BrianFeroldi and I teach:
*Financial Statements Explained Simply*
Our third cohort starts January 10th. DM me and I'll give you a code for HUNDREDS off the list price.
But hurry, enrollment closes January 9th
maven.com
*Financial Statements Explained Simply*
Our third cohort starts January 10th. DM me and I'll give you a code for HUNDREDS off the list price.
But hurry, enrollment closes January 9th
maven.com

@BrianFeroldi That's a wrap!
If you enjoyed this thread:
1. Follow me @Brian_Stoffel_ for more of these
2. RT the tweet below to share this thread with your audience
If you enjoyed this thread:
1. Follow me @Brian_Stoffel_ for more of these
2. RT the tweet below to share this thread with your audience
Loading suggestions...