

Ichimoku Cloud, also known as Ichimoku Kinko Hyo 🧵
It's a technical indicator that is used to identify trends and potential buy and sell signals.
It was developed by Goichi Hosoda, a Japanese journalist, in the late 1930s.
This is my go-to indicator for any timeframe 🔥
1/16
It's a technical indicator that is used to identify trends and potential buy and sell signals.
It was developed by Goichi Hosoda, a Japanese journalist, in the late 1930s.
This is my go-to indicator for any timeframe 🔥
1/16
In this thread:
•Ichimoku Indicator Settings
•How to read an Ichimoku Chart
•Signal generation using Ichimoku cloud
2/
•Ichimoku Indicator Settings
•How to read an Ichimoku Chart
•Signal generation using Ichimoku cloud
2/
The Ichimoku cloud's default settings are 9/26/52/26.
9: Tenkan Sen
26: Kijun sen
52: Senkou span B
26: Displacement of the Senkou span A, Senkou span B, and Chikou span
However, these settings are adjusted for the stock market, which is only traded during the work week.
3/
9: Tenkan Sen
26: Kijun sen
52: Senkou span B
26: Displacement of the Senkou span A, Senkou span B, and Chikou span
However, these settings are adjusted for the stock market, which is only traded during the work week.
3/
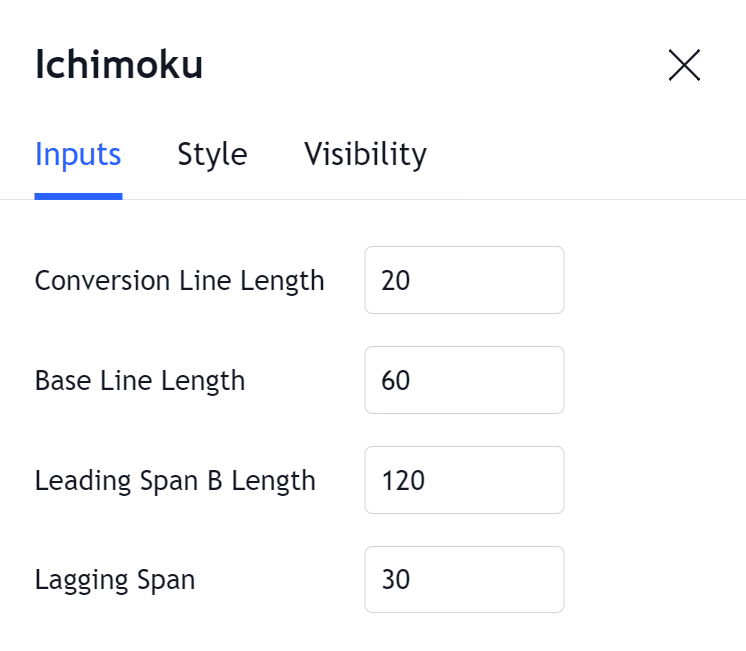
The crypto is open and traded 24/7 and therefore the settings of the Ichimoku cloud could be adjusted to 20/60/120/30.
20: Tenkan Sen
60: Kijun sen
120: Senkou span B
30: Displacement of the Senkou span A, Senkou span B, and Chikou span
4/
20: Tenkan Sen
60: Kijun sen
120: Senkou span B
30: Displacement of the Senkou span A, Senkou span B, and Chikou span
4/
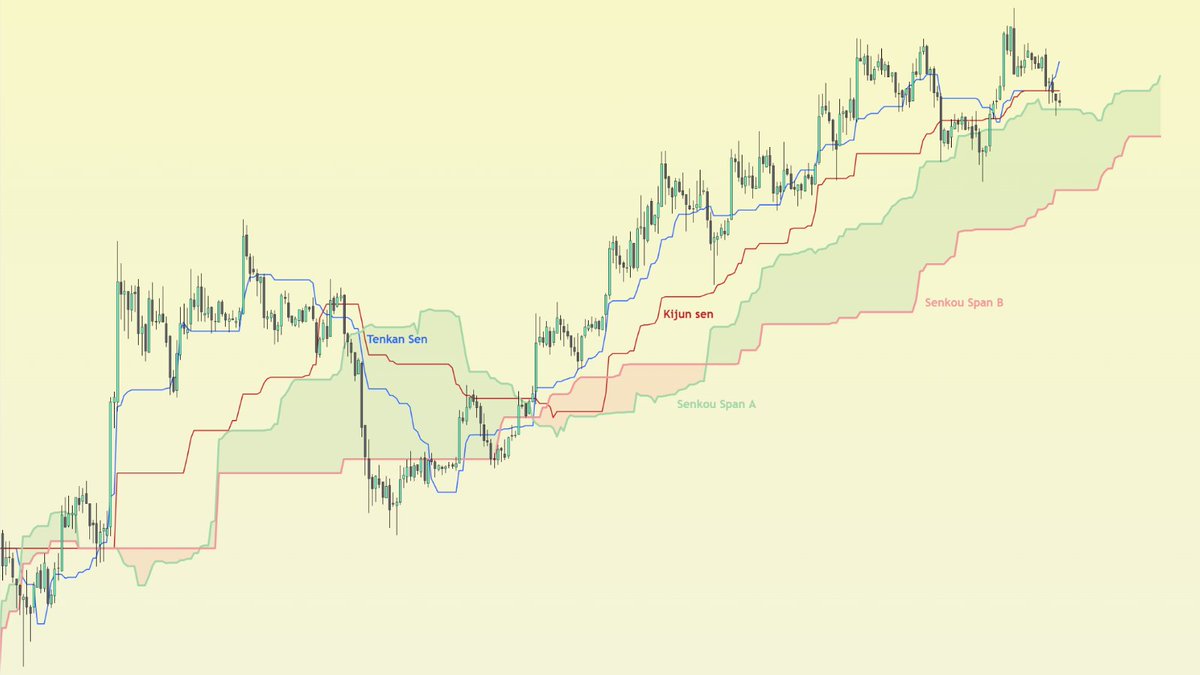
How to read an Ichimoku Chart: The Ichimoku Cloud is made up of five lines.
•Tenkan-sen
•Kijun-sen
•Senkou Span A
•Senkou Span B
•Chikou Span
5/
•Tenkan-sen
•Kijun-sen
•Senkou Span A
•Senkou Span B
•Chikou Span
5/
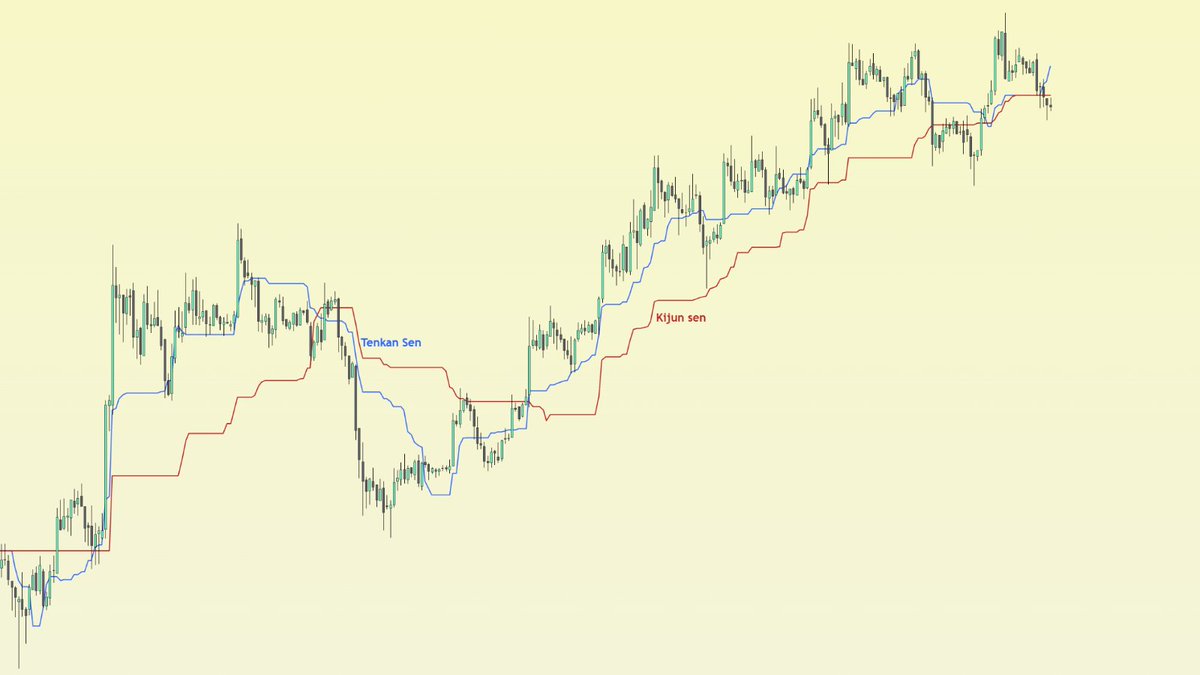
1) The Tenkan-sen, also known as the conversion line, is calculated by taking the average of the highest high and the lowest low over the past 20 periods. It is used as a short-term trend indicator.
6/
6/

2) The Kijun-sen, also known as the baseline, is calculated by taking the average of the highest high and the lowest low over the past 60 periods. It is used as a medium-term trend indicator.
7/
7/
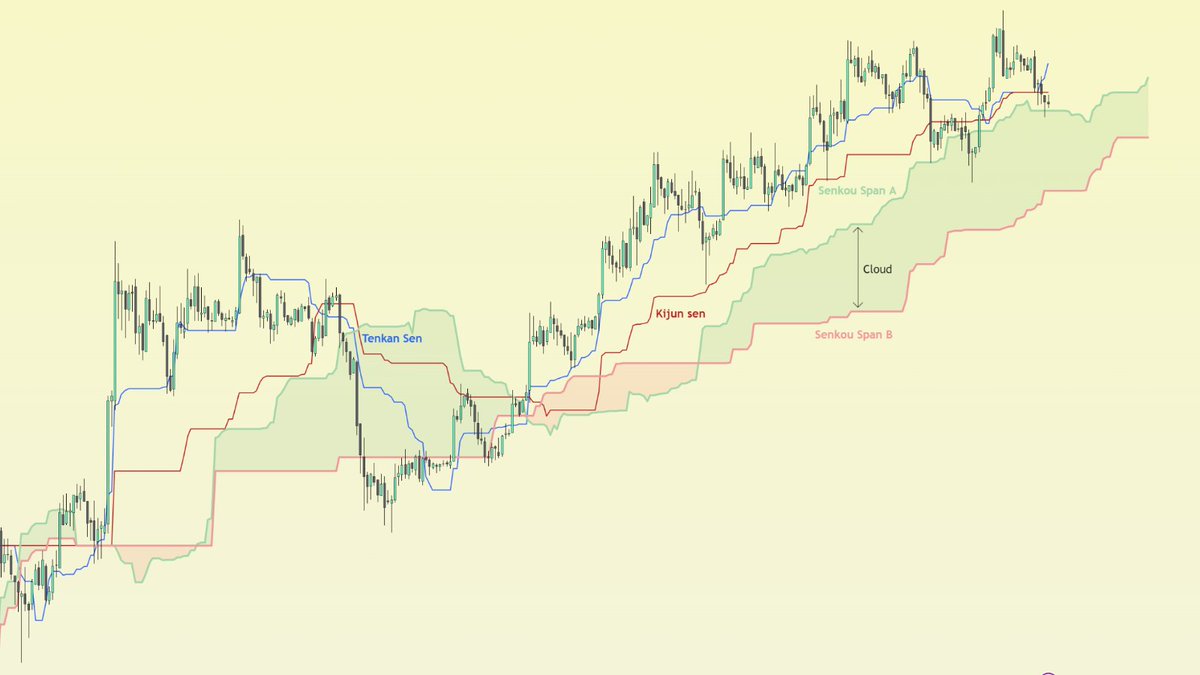
3) The Senkou Span A, also known as the leading span A, is calculated by taking the average of the Tenkan-sen and the Kijun-sen and then plotting that average 30 periods ahead. It is used to identify the potential future direction of the trend.
8/
8/
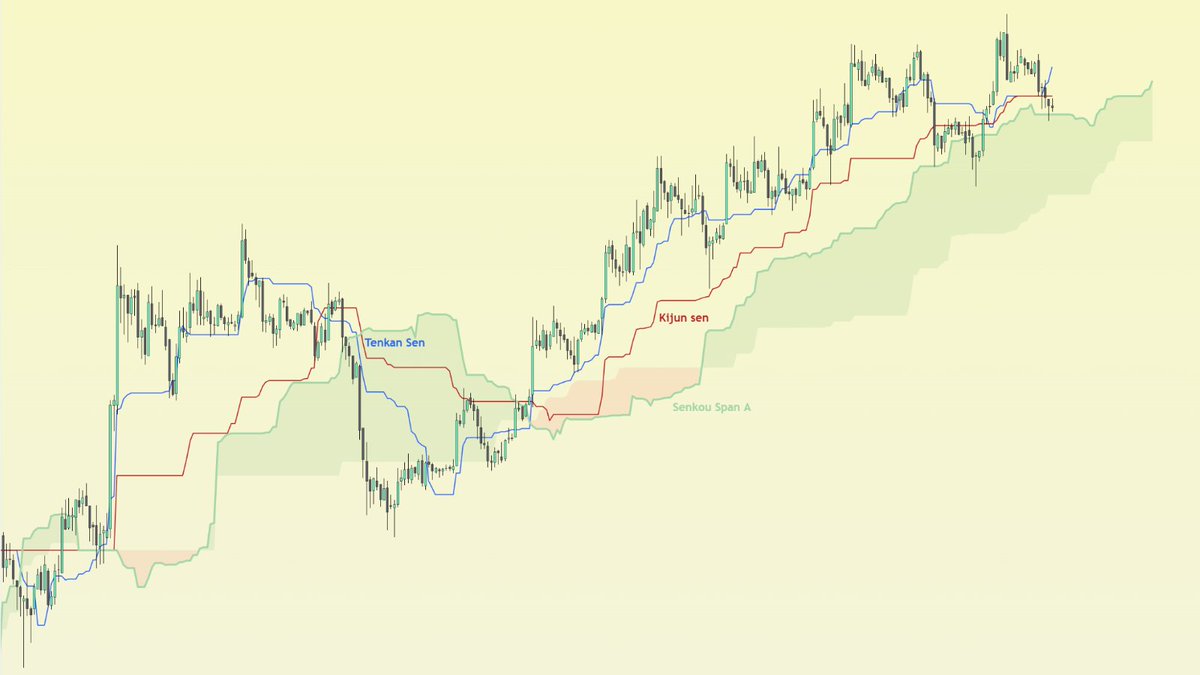
4) The Senkou Span B, also known as the leading span B, is calculated by taking the average of the highest high and the lowest low over the past 120 periods and then plotting that average 30 periods ahead.
9/
9/
It is used in conjunction with the Senkou Span A to identify the potential future direction of the trend.
10/
10/
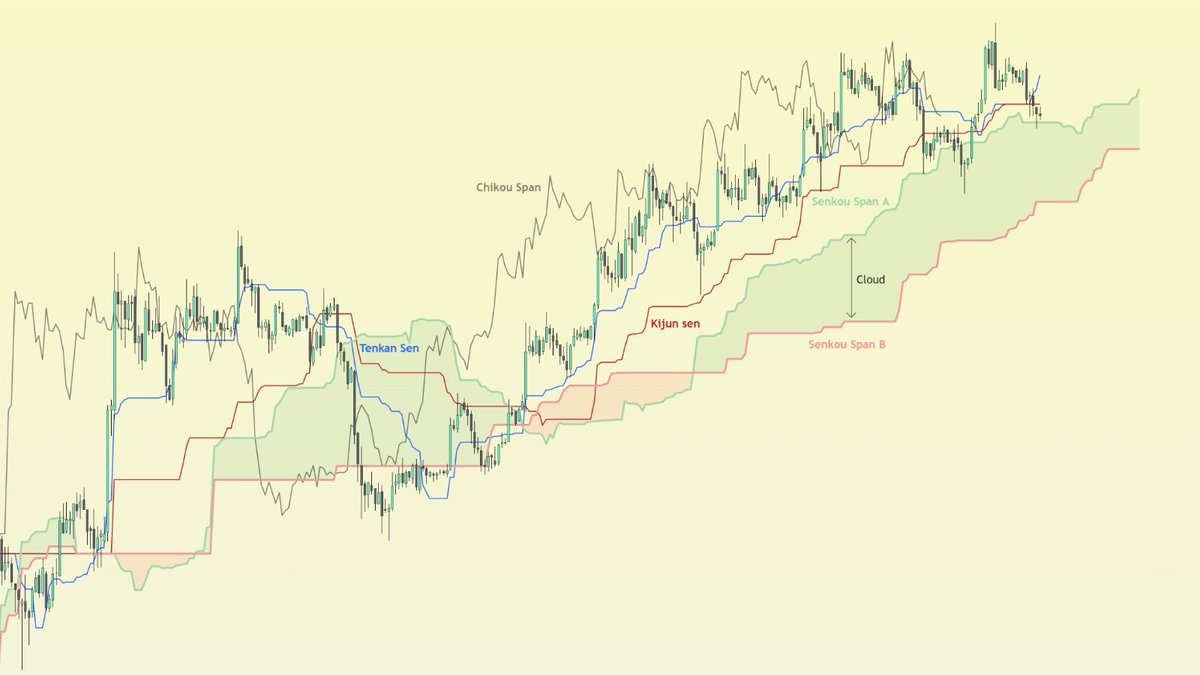
5) The Chikou Span, also known as the lagging span, is the current closing price plotted 30 periods behind. It is used to confirm trend signals.
11/
11/
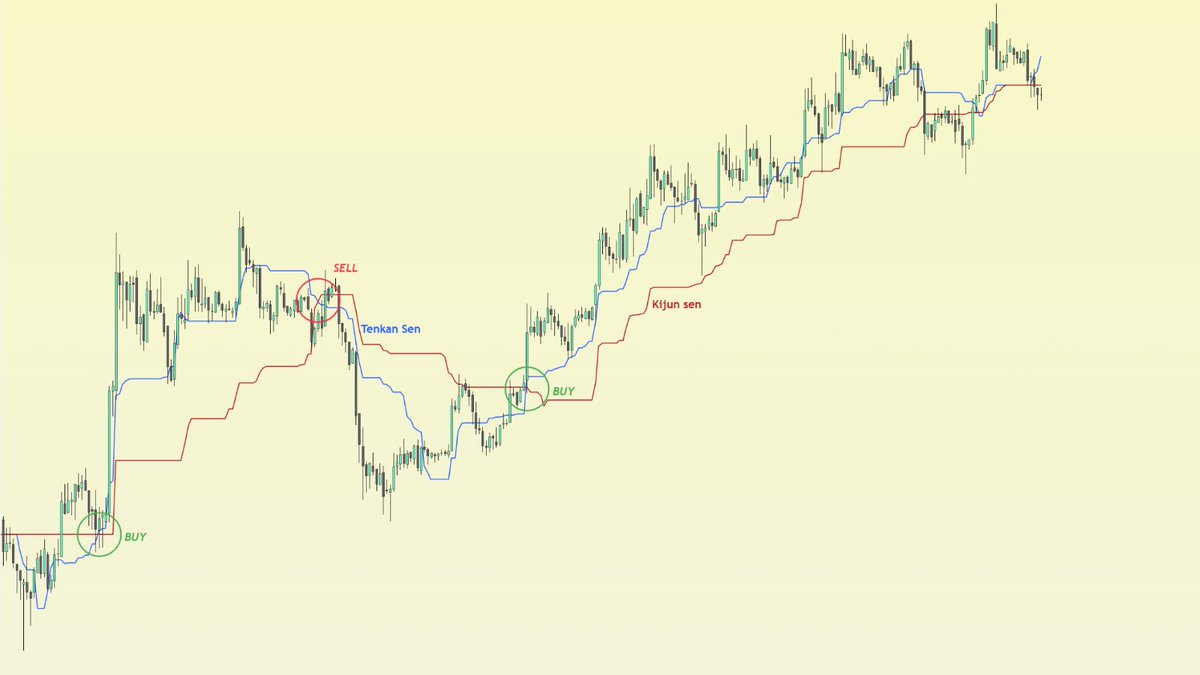
Signal: 1
Traders typically use the Ichimoku Cloud to identify trend direction and to generate buy and sell signals. A buy signal is generated when the Tenkan-sen crosses above the Kijun-sen, and a sell signal is generated when the Tenkan-sen crosses below the Kijun-sen.
12/
Traders typically use the Ichimoku Cloud to identify trend direction and to generate buy and sell signals. A buy signal is generated when the Tenkan-sen crosses above the Kijun-sen, and a sell signal is generated when the Tenkan-sen crosses below the Kijun-sen.
12/
Signal: 2
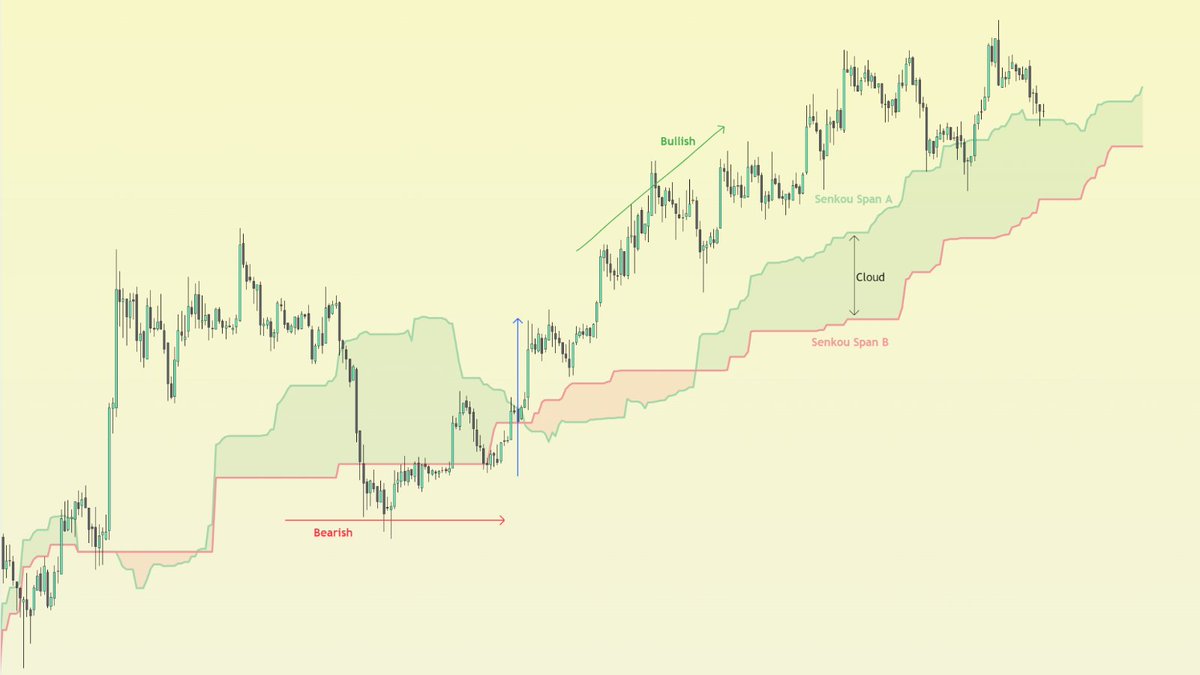
When the price is above the cloud, it is considered bullish, and when it is below the cloud, it is considered bearish.
The cloud itself also acts as a support and resistance.
Kumo Breakouts ( Cloud Breakouts) are good trend reversal signals.
13/
When the price is above the cloud, it is considered bullish, and when it is below the cloud, it is considered bearish.
The cloud itself also acts as a support and resistance.
Kumo Breakouts ( Cloud Breakouts) are good trend reversal signals.
13/
Signal: 3
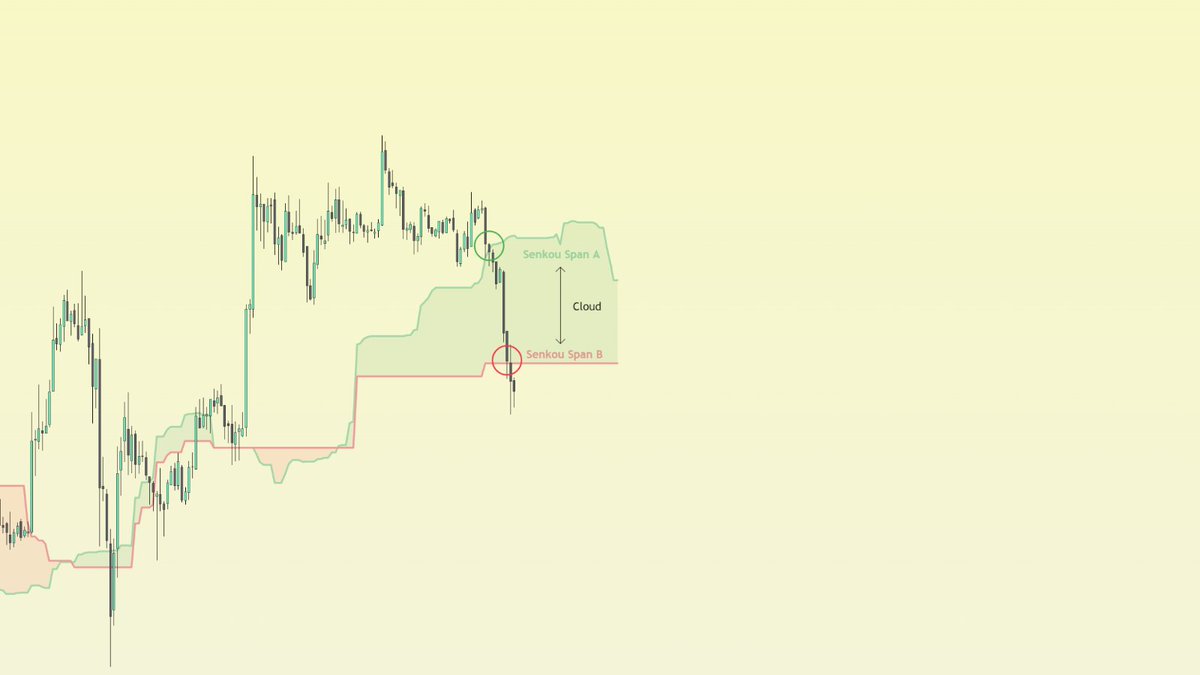
Edge-to-Edge of the cloud: When the price enters from one end and goes towards the next end.
When the prices breaks inside the Cloud, an entry can be taken targeting the other end of the cloud.
14/
Edge-to-Edge of the cloud: When the price enters from one end and goes towards the next end.
When the prices breaks inside the Cloud, an entry can be taken targeting the other end of the cloud.
14/
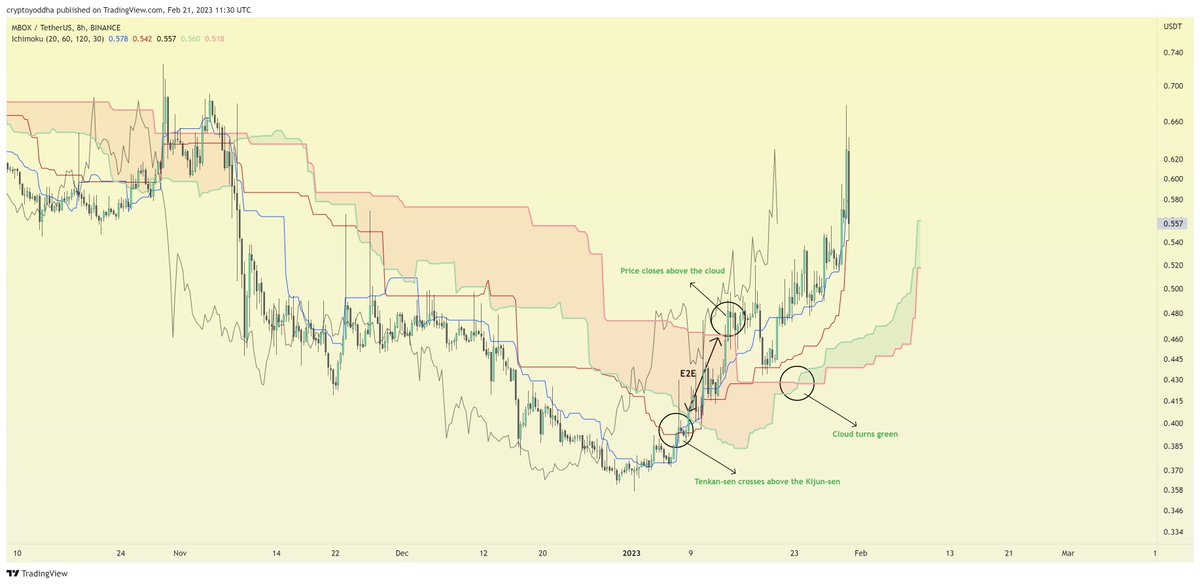
Here's a bullish scenario for explaining the combination of Signals 1, 2 & 3.
-The price enters the cloud for E2E
-Cloud turns green
-Price gets above the cloud
-Chikou Span gets above the cloud too for final confirmation
15/
-The price enters the cloud for E2E
-Cloud turns green
-Price gets above the cloud
-Chikou Span gets above the cloud too for final confirmation
15/
That's all there is to it; I hope you enjoyed reading it and learned something. It took a lot of time and work to put this together, so likes & Retweets would be very appreciated.
End/
End/
Loading suggestions...