

IOmega went up 13,800% in less than 2 years in the mid to late 90s, and was one of the biggest winning stocks of all time.
You've probably never seen the chart.
In this thread, we walk through its move from $1 to $138 🧵
You've probably never seen the chart.
In this thread, we walk through its move from $1 to $138 🧵
First, some backstory.
IOmega was a prominent tech company in the mid 90s specializing in storage solutions for computers.
Their flagship product was the Zip Drive, which offered much more storage compared to floppy disks at the time.
IOmega was a prominent tech company in the mid 90s specializing in storage solutions for computers.
Their flagship product was the Zip Drive, which offered much more storage compared to floppy disks at the time.
A traditional floppy disk could store only 1.44 MB, while the 1st Zip drive held 100 MB.
Amidst a growing need for storage options due to the rise of personal computers and the internet, demand for their Zip Drive exploded.💥
Amidst a growing need for storage options due to the rise of personal computers and the internet, demand for their Zip Drive exploded.💥
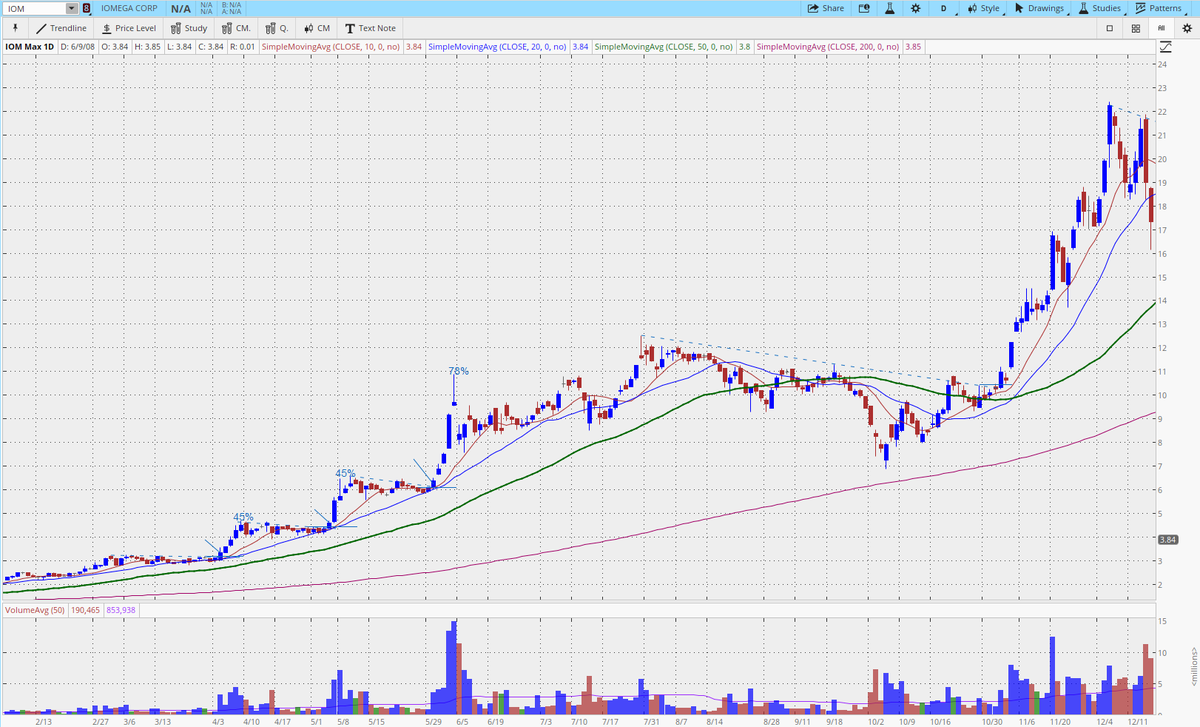
The first setup occurs on April 4th, 1995. After going up 171% in 84 days, the stock builds a high tight flag on the 10/20 moving averages, and breaks out on massive volume.
I believe @markminervini bought this flag as he talks about in this video at 1:10
buff.ly
I believe @markminervini bought this flag as he talks about in this video at 1:10
buff.ly


@markminervini From the 1st buy point, IOM increases 45% in just 6 days, before building yet another gorgeous high tight flag (HTF), surfing right on the 10 and 20 day moving averages.⛳
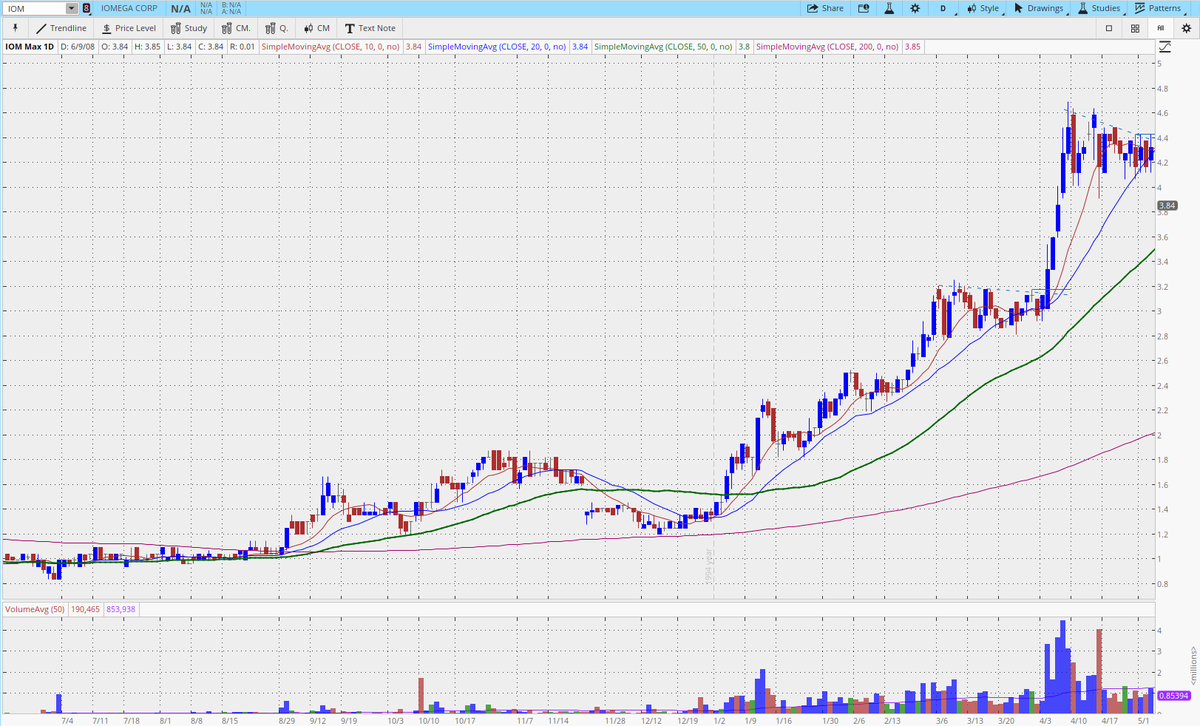
@markminervini Wait, it gets even better! After increasing another 45% from the 2nd high tight flag in 6 days (up over 100% from the 1st entry), the stock builds ANOTHER perfect HTF right on the 10/20, yet again. 🤩
@markminervini From there, the stock goes parabolic increasing 78% in 5 days! After 3 perfect setups so close together, the stock takes a breather from its insane run from $1.25 to over $12!
But wait. There's more....
But wait. There's more....
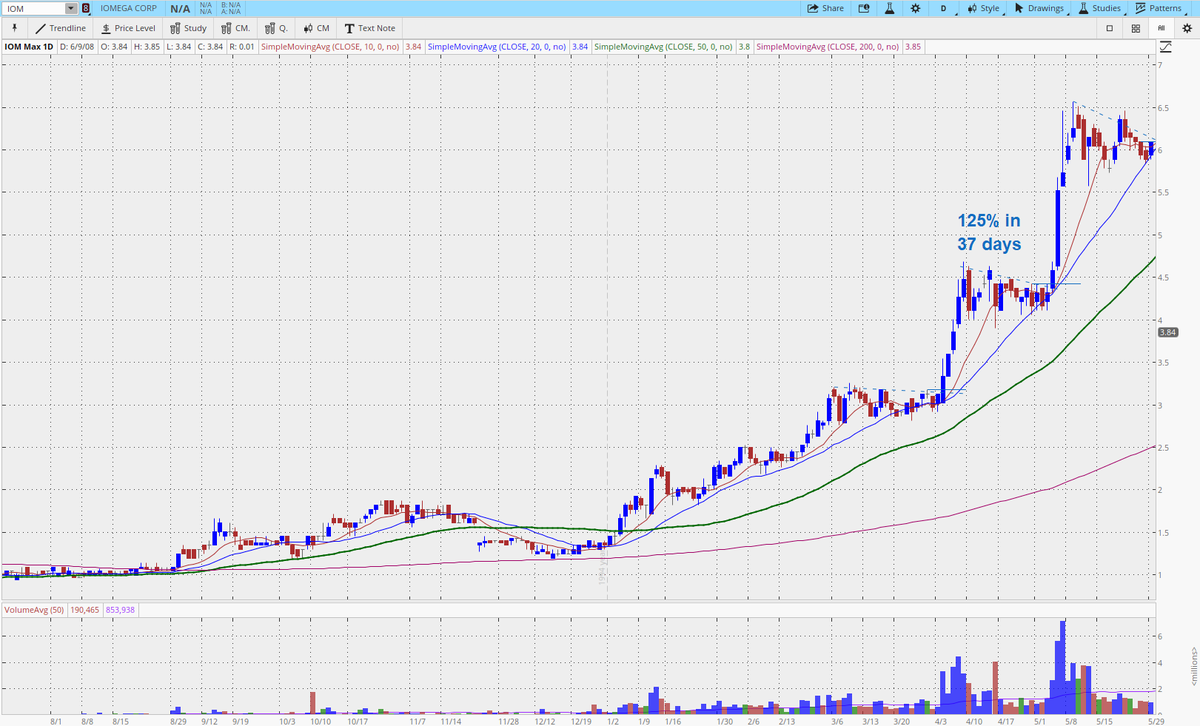
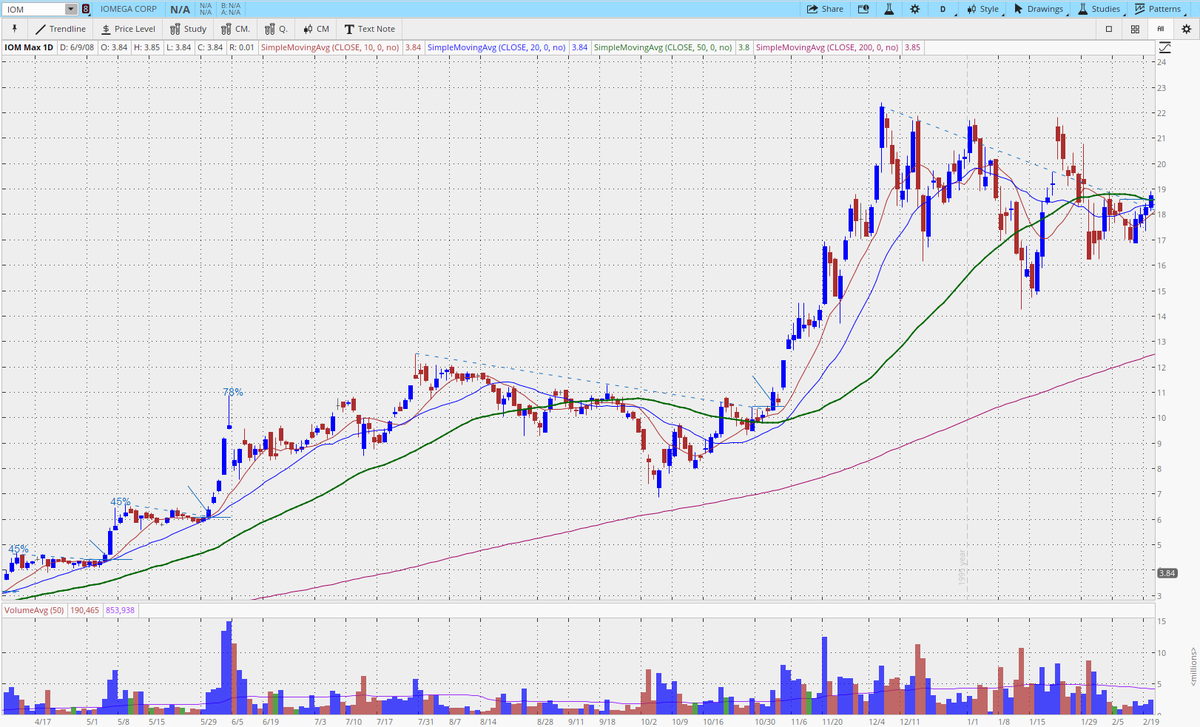
@markminervini After a few months of consolidation, the stock sets up again, this time as a large base breakout! The volatility contracts, and then the stock breaks out for another leg higher!
This time the stock increases 115% in 30 days.💥
There's still more...
This time the stock increases 115% in 30 days.💥
There's still more...
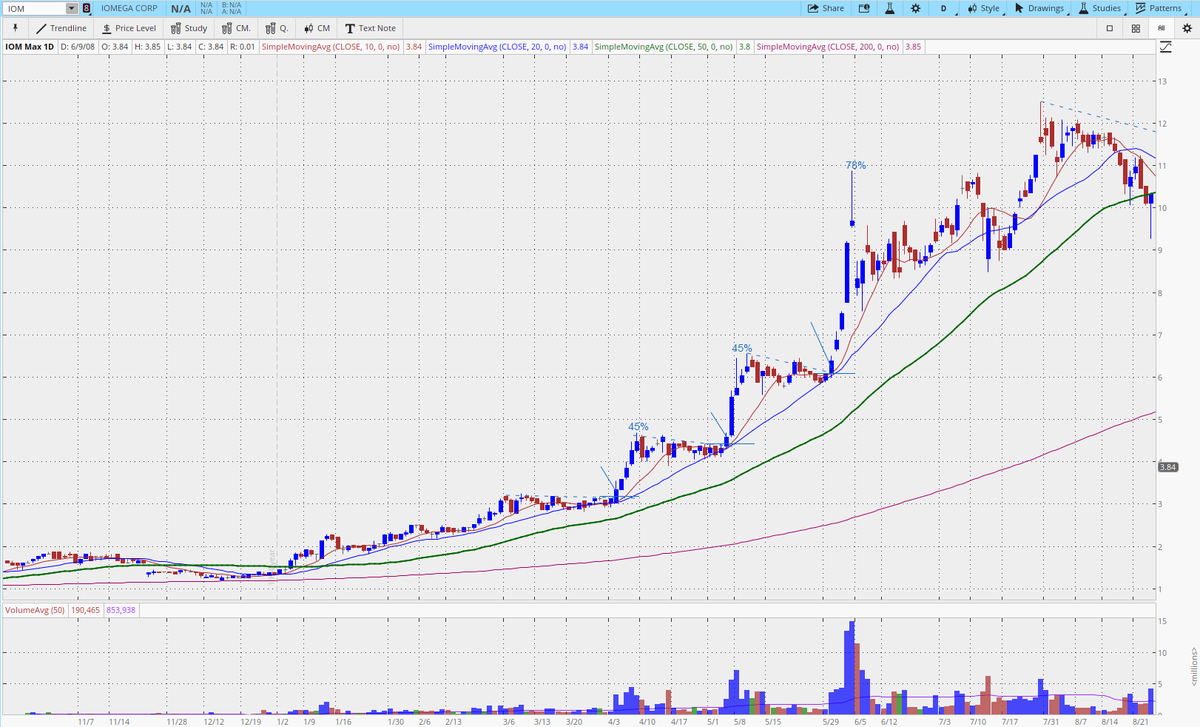
@markminervini After that next leg up, the stock bases again for a few months, and sets a subtle low cheat pocket pivot setup just below the 50 SMA.
There was also another setup a day later on the gap up, but that would have hit your stop if you were buying ORH and using LOD as a stop.
There was also another setup a day later on the gap up, but that would have hit your stop if you were buying ORH and using LOD as a stop.
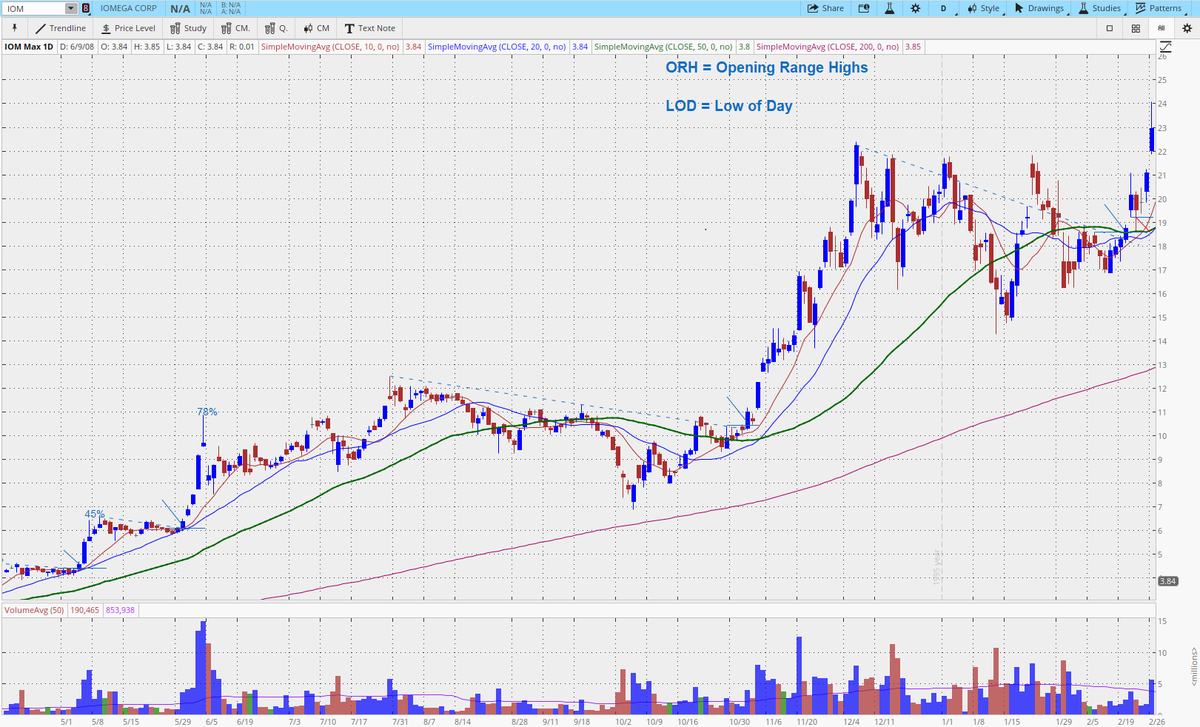
@markminervini The stock got a bit volatile after that breakout, but luckily, it presents one more buy point before going on an absolutely mind-boggling run.
On March 18th, 1996, the stock gaps up on big volume, breaking out of its range, marking the start of its parabolic run.
On March 18th, 1996, the stock gaps up on big volume, breaking out of its range, marking the start of its parabolic run.
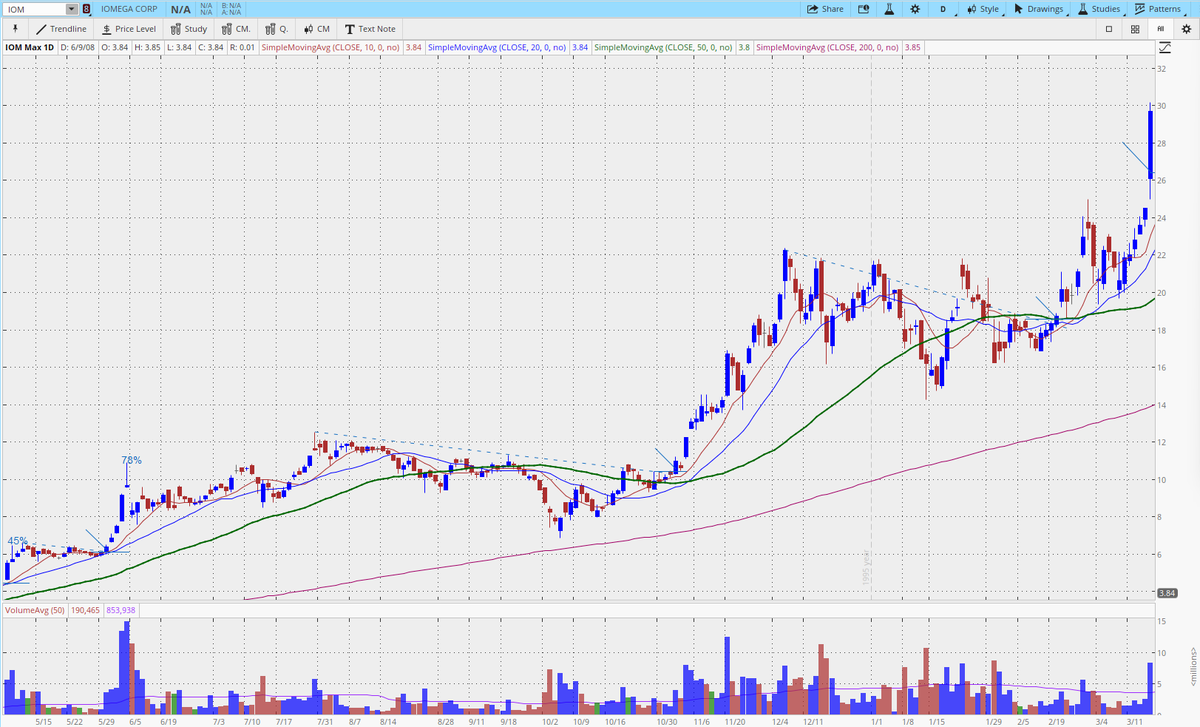
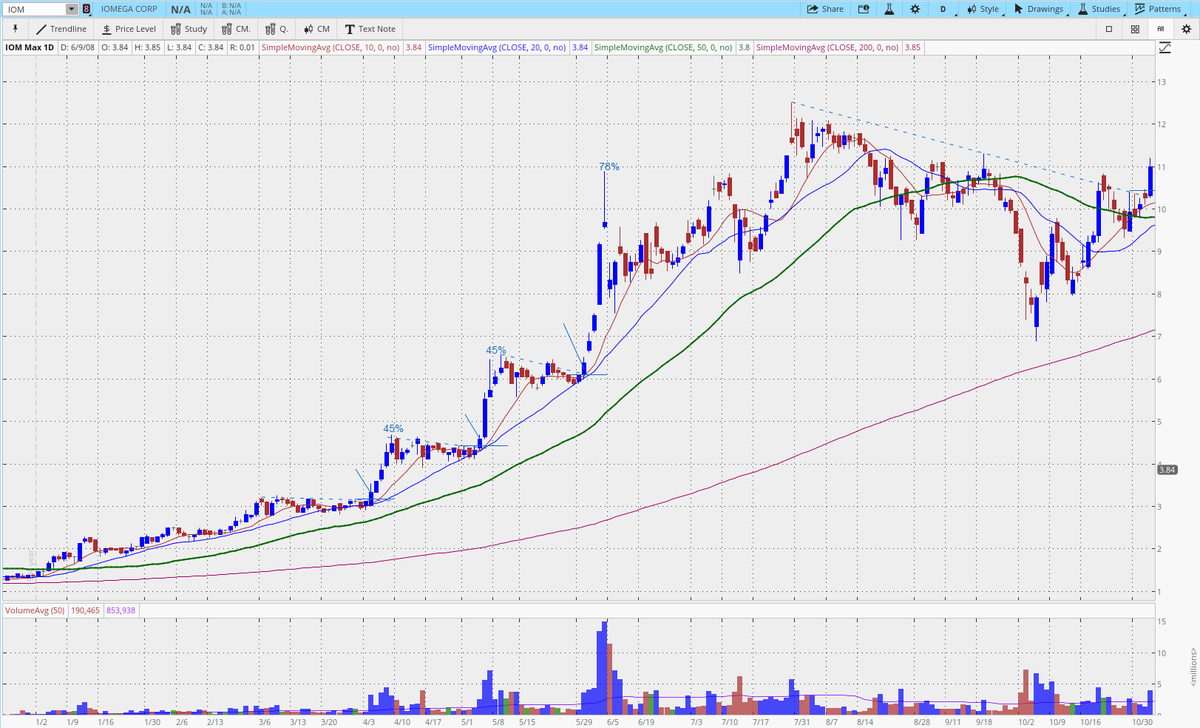
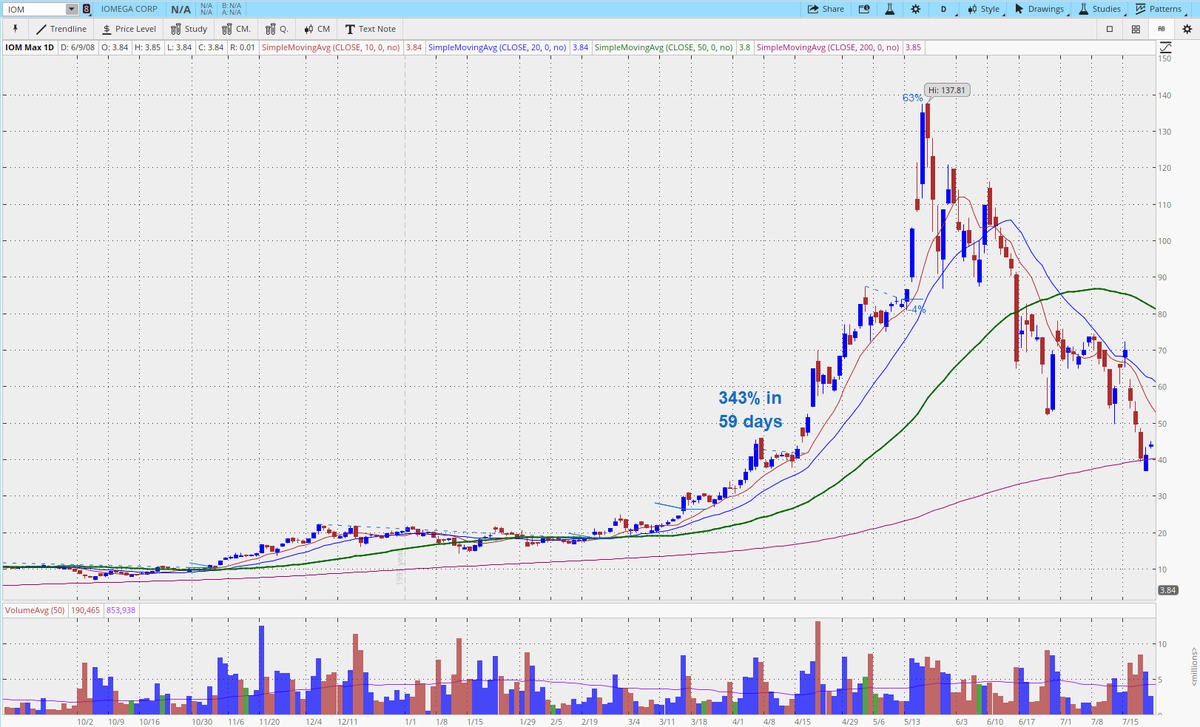
@markminervini This setup was an Episodic Pivot (EP), which you can learn more about on buff.ly or from @PradeepBonde. I couldn't find the specific news for it, so I am assuming that there was a catalyst that sparked the gap up on big volume.
@markminervini @PradeepBonde From that entry, the stock started a massive rally from $25 to its high of $137 lasting just over 2 months, respecting the 10 MA for the whole move.
On 5/17 it presented its last buy point, likely only for advanced traders, making a mini flag on the 10 MA.
On 5/17 it presented its last buy point, likely only for advanced traders, making a mini flag on the 10 MA.
@markminervini @PradeepBonde Thats concludes my walkthrough of IOmega (IOM), one of the greatest stocks of all time!
It's chart moved like the TSLA of the mid 90s.
But there's even more legendary stocks, that you've probably never seen or studied before!
It's chart moved like the TSLA of the mid 90s.
But there's even more legendary stocks, that you've probably never seen or studied before!
Follow me at @traderCharlieM for more on the biggest winning stocks you've probably never seen before!📈
Like/Retweet the first tweet below if you learned something new:
Like/Retweet the first tweet below if you learned something new:
Loading suggestions...