

Inverted Fair Value Gaps (IFVG)
One of the most undervalued tools in a trader's toolbox. I want to share a little bit about what it is and how to use them - it's one of my absolute go-to's along with Liquidity to understand PA and where price will likely react and deliver to.
One of the most undervalued tools in a trader's toolbox. I want to share a little bit about what it is and how to use them - it's one of my absolute go-to's along with Liquidity to understand PA and where price will likely react and deliver to.

What is an IFVG? An IFVG is a Fair Value Gap (FVG) that has essentially become invalidated or that price has moved through. For example, price moving through and closing below a Bullish FVG or price moving through and closing above a Bearish FVG.
When it comes to using FVG's as entries, I've gotten burnt a lot in the past. I noticed in my trading that utilizing FVG's for entries, ended up being a guessing game.
Especially when entering with SL below/above FVG's.
Adding IFVG's to the toolbox, removed the doubt.
Especially when entering with SL below/above FVG's.
Adding IFVG's to the toolbox, removed the doubt.
Validation and Invalidation assumes an extra step in the process. It could be waiting for an FVG to be validated to enter on the following or simply waiting for an FVG to be invalidated; becoming an IFVG.
How are IFVG's useful?
They allow you to understand which PD Arrays (in this case FVG's) are being respected; and in which direction price is moving, in doing so.
They allow you to understand which PD Arrays (in this case FVG's) are being respected; and in which direction price is moving, in doing so.
Validated or respected FVG's allow us to get a better understanding of the direction and whether price will deliver to Sellside or Buyside.
Inversely, IFVG's do the same but to me, in a much more logical way. They are OP AF.
Inversely, IFVG's do the same but to me, in a much more logical way. They are OP AF.
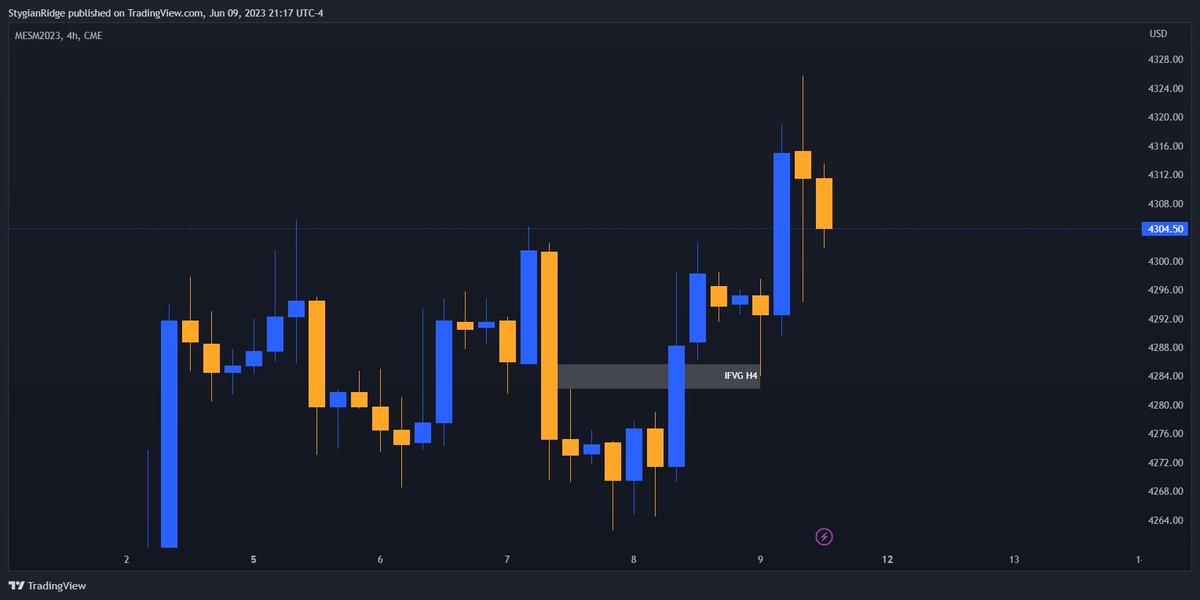
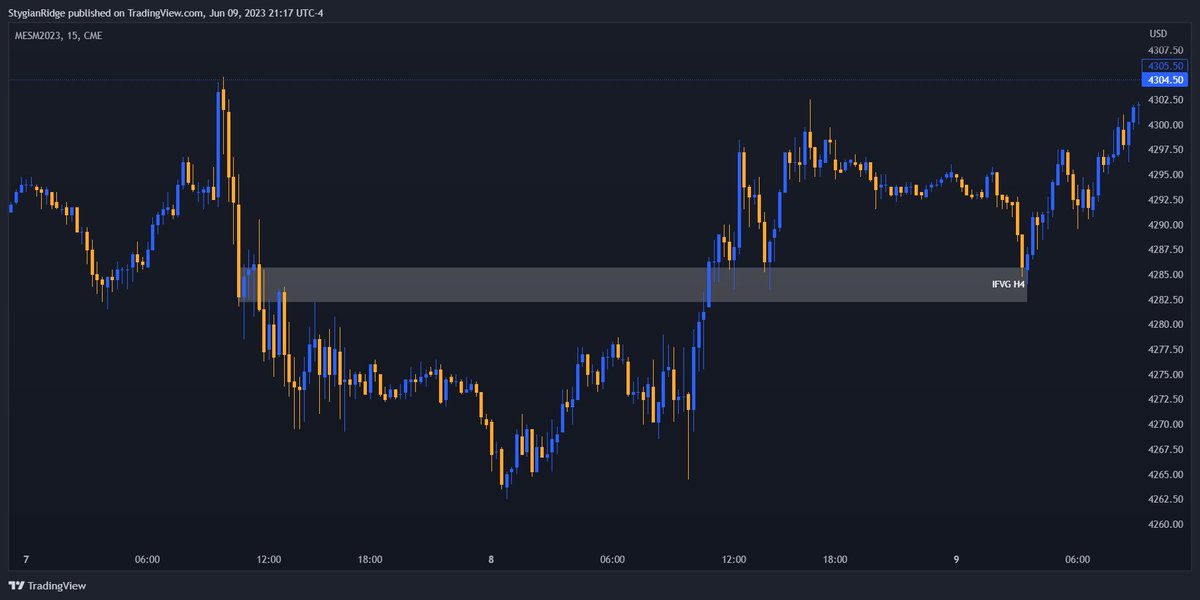
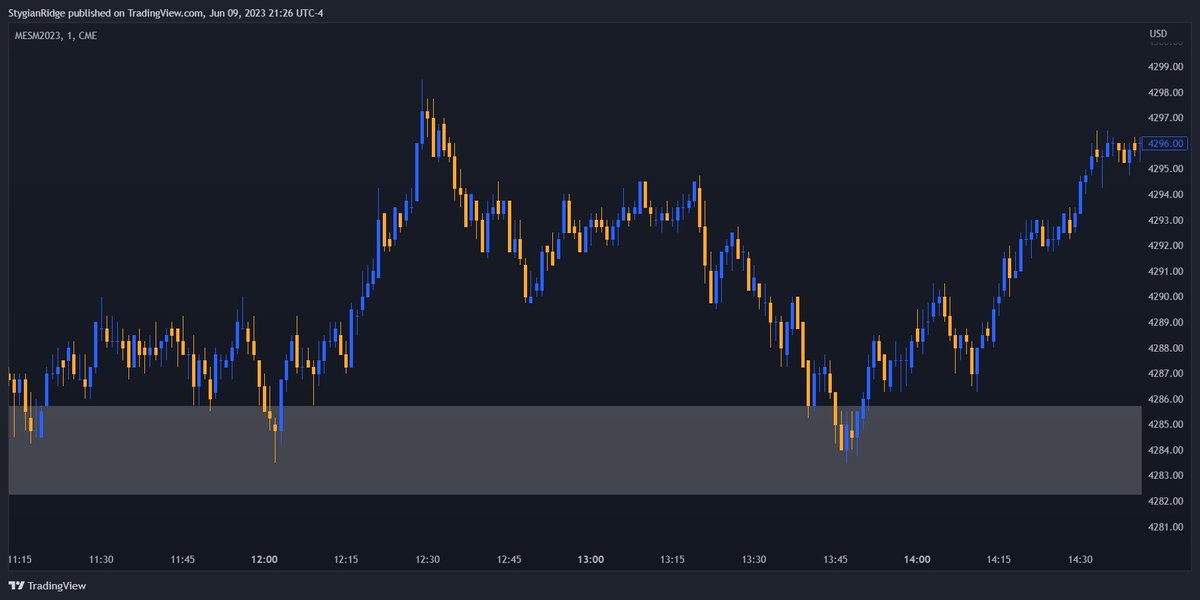
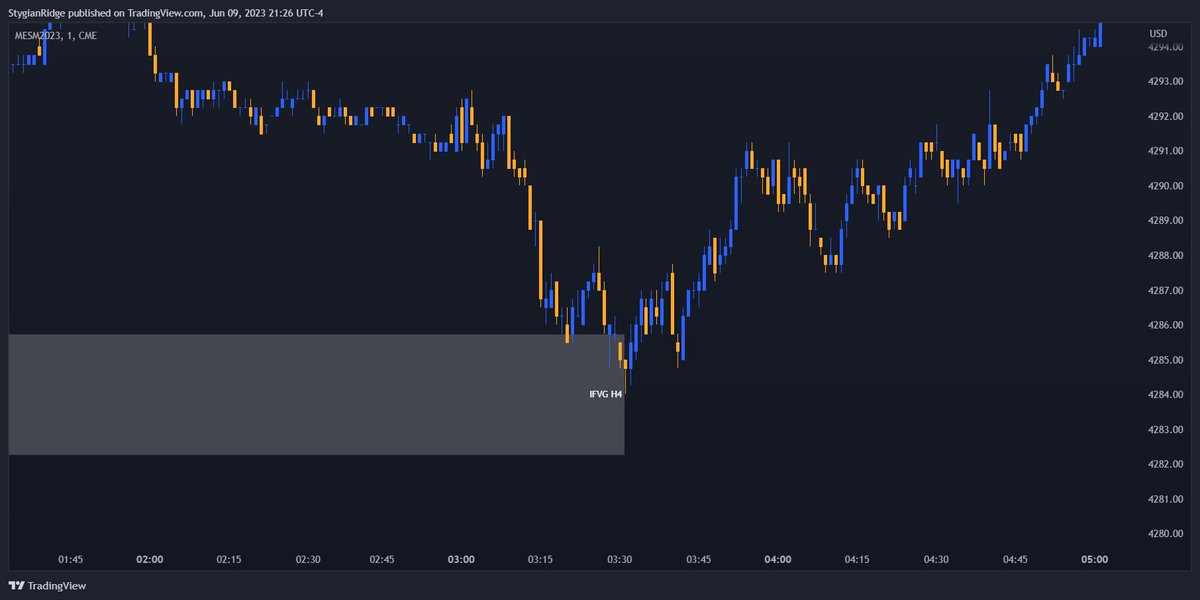
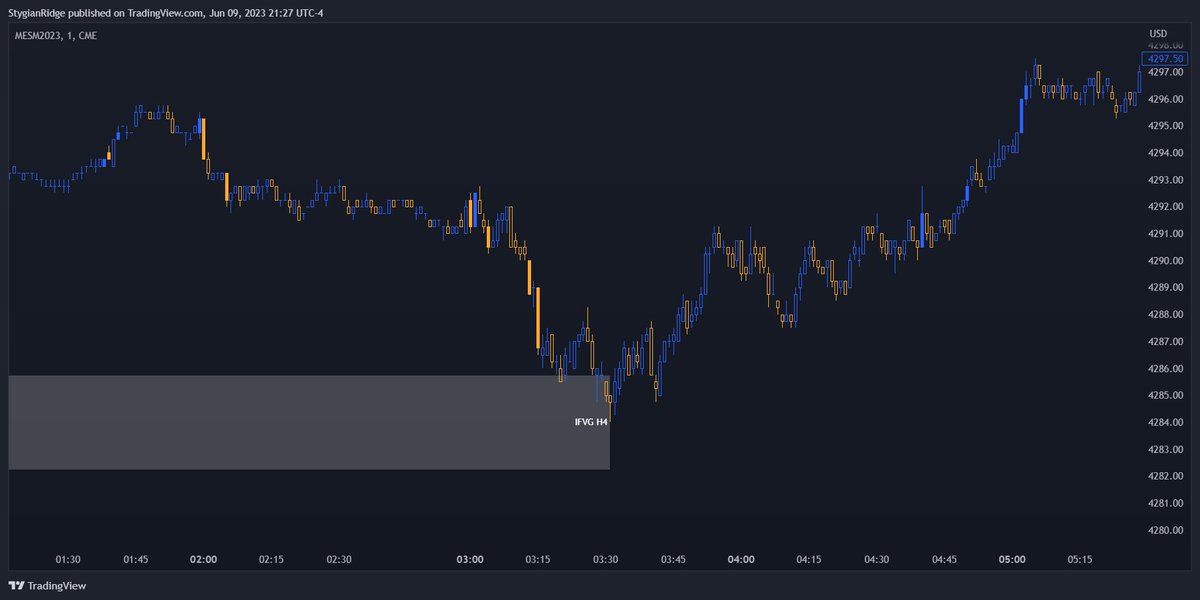
Below is an H4 IFVG, along with how price reacts to it on M15.
Notice how it acts as Support for Price.
The most important part here is observing and reading price once it comes into contact with the IFVG.
How does it react, is the key question to ask yourself.
Notice how it acts as Support for Price.
The most important part here is observing and reading price once it comes into contact with the IFVG.
How does it react, is the key question to ask yourself.
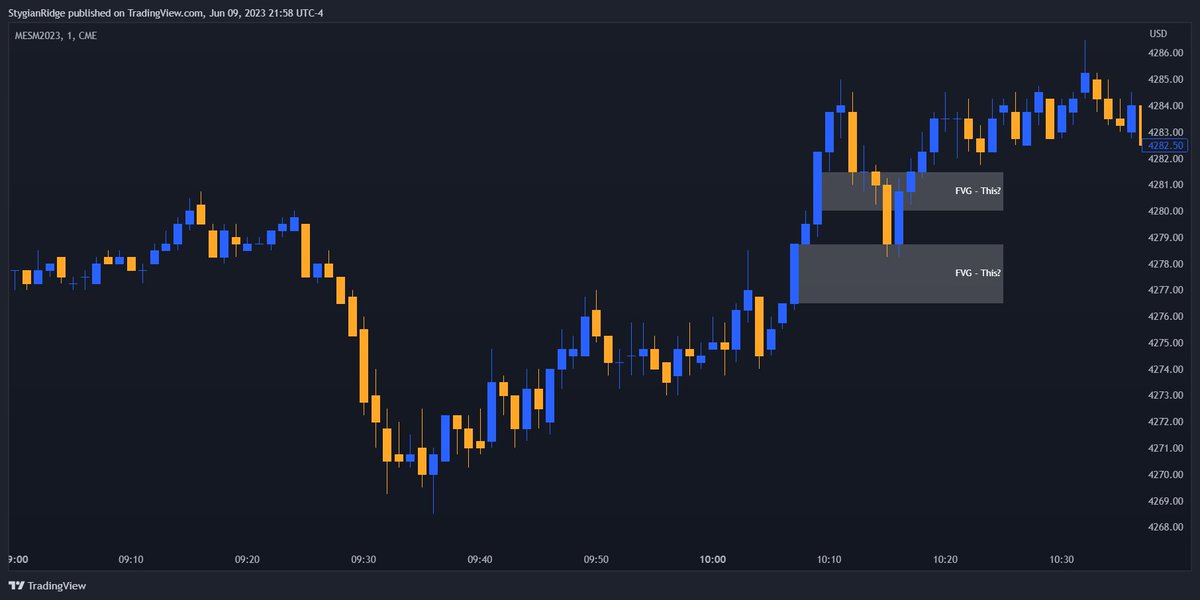
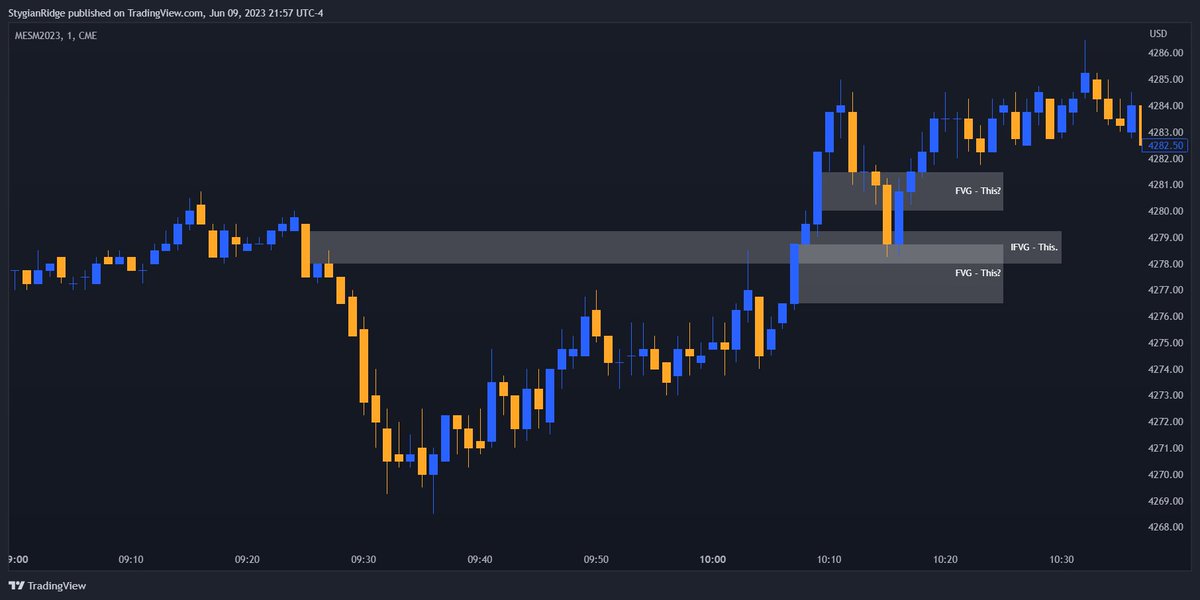
When we observe it on M1, we get an even better understanding of price's willingness to either break through or reject it; will it act as Support or as Resistance?
One way that I like to further observe how price reacts to an IFVG, is by adding the perspective of Volume upon entering the IFVG and leaving the IFVG.
The colored candles below show >2 STD Volume (comp. prev. 21 candles)
This can signify two things; Exhaustion or Acceleration.
The colored candles below show >2 STD Volume (comp. prev. 21 candles)
This can signify two things; Exhaustion or Acceleration.
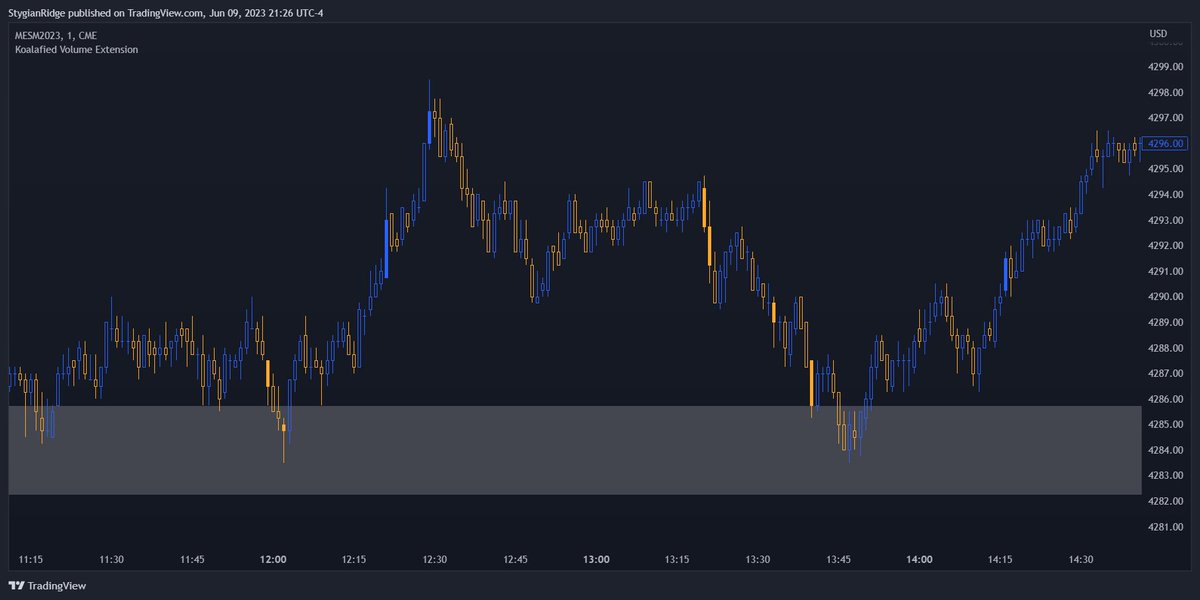
If you observe a higher than average volume (in my case >2 STD comp. to prev. 21 candles) upon entry into the IFVG, this would signify Exhaustion of that price leg.
Note that news, session openings etc. obviously will carry higher than average volume.
Note that news, session openings etc. obviously will carry higher than average volume.
Try and add IFVG's to your toolbox and use it as a confluence with other things such as Liquidity and SMT Divergences and note how your ability to read price transforms.
Thanks for reading this far - I hope it was valuable!
Thanks for reading this far - I hope it was valuable!
Loading suggestions...