

Microsoft Excel is used by over 99% of businesses in the World and over 1 Billion people, so whatever profession you choose, make sure you learn it.
📊Here are 15 Microsoft Excel tips & functions that will make you feel like an expert and save you hundreds of hours of work:
📊Here are 15 Microsoft Excel tips & functions that will make you feel like an expert and save you hundreds of hours of work:
MUST KNOW Microsoft Excel tips & functions:
• XLOOKUP
• Sparklines
• Pivot Tables
• Import website data
• Importing PDF data
• Stock Market data
• Goal Seek
• Transpose
• DatedIf
• Remove Duplicates
• Trim
• Convert
• Upper & Lower
Let's discuss each with examples:
• XLOOKUP
• Sparklines
• Pivot Tables
• Import website data
• Importing PDF data
• Stock Market data
• Goal Seek
• Transpose
• DatedIf
• Remove Duplicates
• Trim
• Convert
• Upper & Lower
Let's discuss each with examples:
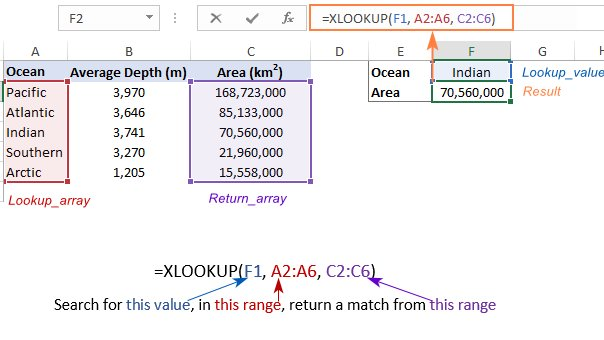
(1) XLOOKUP
XLookup is better than VLOOKUP and Index & Match, because you can use it to perform both VLOOKUPs or HLOOKUPs.
Formula: =XLOOKUP (lookup value, lookup array, return array)
XLookup is better than VLOOKUP and Index & Match, because you can use it to perform both VLOOKUPs or HLOOKUPs.
Formula: =XLOOKUP (lookup value, lookup array, return array)
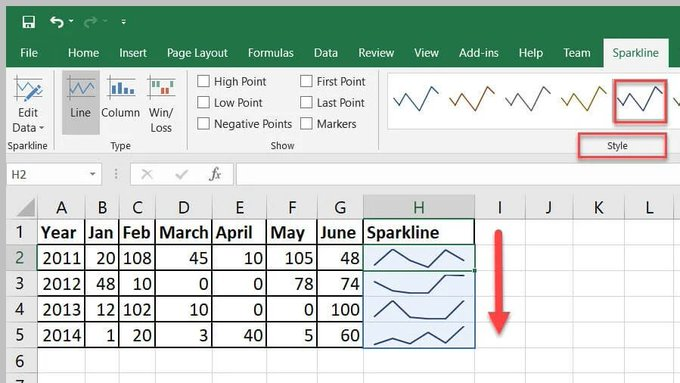
2) Sparklines
This function allows you to insert charts inside any cell and provides a visual representation of data. Sparklines can show trends or patterns in data.
On the 'Insert tab', click 'Sparklines'
This function allows you to insert charts inside any cell and provides a visual representation of data. Sparklines can show trends or patterns in data.
On the 'Insert tab', click 'Sparklines'
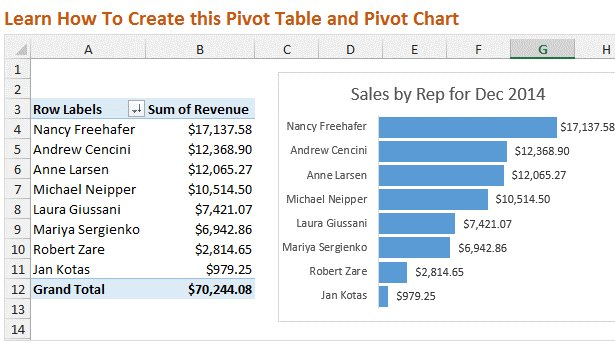
(3) Pivot Tables
A powerful tool to calculate, summarize & analyze data, which allows you to compare or find patterns & trends in data.
To access this function, go to "Insert" in the Menu bar, and then select "Pivot Table".
A powerful tool to calculate, summarize & analyze data, which allows you to compare or find patterns & trends in data.
To access this function, go to "Insert" in the Menu bar, and then select "Pivot Table".
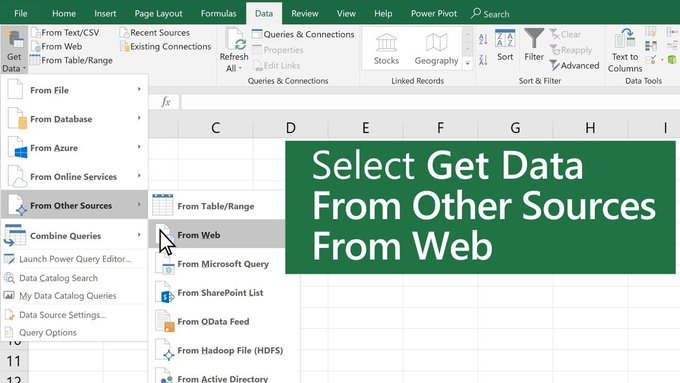
(4) Import website data
With Excel, you can connect to multiple data sources, text files, other Excel files, databases & websites.
• Select 'Data' > Get & Transform > From Web
• Press CTRL+V to paste the URL into the text box, then select OK
With Excel, you can connect to multiple data sources, text files, other Excel files, databases & websites.
• Select 'Data' > Get & Transform > From Web
• Press CTRL+V to paste the URL into the text box, then select OK
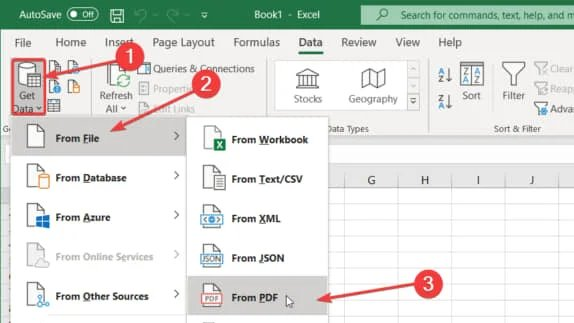
(5) Importing PDF data
This will save you hours from manually typing in data from a PDF.
On the 'Data tab', click 'Get Data', then choose "From File"
This will save you hours from manually typing in data from a PDF.
On the 'Data tab', click 'Get Data', then choose "From File"
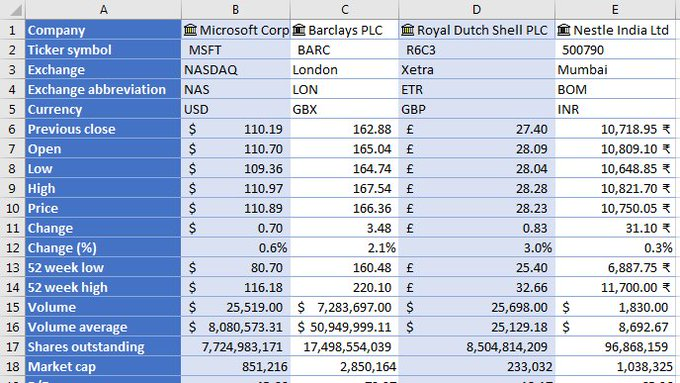
(6) Stock Market data
Enter a list of stock ticker symbols then select the cells and go to the Data tab, then click the Stocks button within the Data Types group.
Excel will match each cell value to a company stock and fill in the data.
Enter a list of stock ticker symbols then select the cells and go to the Data tab, then click the Stocks button within the Data Types group.
Excel will match each cell value to a company stock and fill in the data.
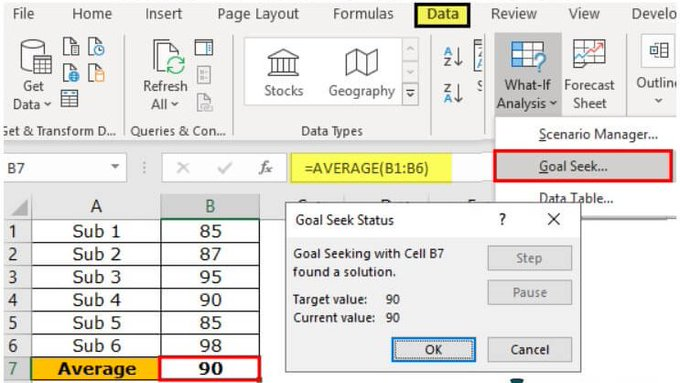
(7) Goal Seek
This function is also known as What-if-Analysis. Goal Seek uses trial & error to back-solve a problem, by plugging in guesses until it arrives at the correct answer.
This function is also known as What-if-Analysis. Goal Seek uses trial & error to back-solve a problem, by plugging in guesses until it arrives at the correct answer.
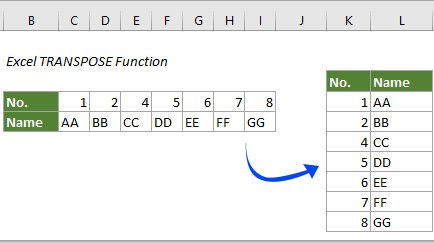
(8) Transpose
Transpose can transform data displayed in rows, to instead be displayed in columns, or vice versa. To transpose data:
1. Select the data
2. Select the cell you want the row to start
3. Right-click, choose paste special, select transpose
Transpose can transform data displayed in rows, to instead be displayed in columns, or vice versa. To transpose data:
1. Select the data
2. Select the cell you want the row to start
3. Right-click, choose paste special, select transpose
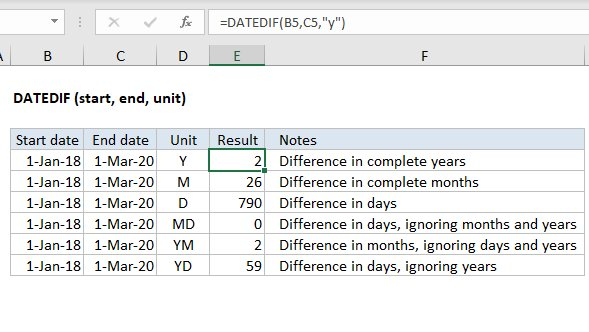
(9) DatedIf
This function calculates the number of (1) days, (2) months, or (3) years between two different dates.
Formula: =DATEDIF(X,Y,"D")
X = Start date cell
Y = End date cell
"D"= Time interval
This function calculates the number of (1) days, (2) months, or (3) years between two different dates.
Formula: =DATEDIF(X,Y,"D")
X = Start date cell
Y = End date cell
"D"= Time interval
(10) Remove Duplicates
Remove duplicates in a set of data in Excel
Shortcut: Alt+A+M
Remove duplicates in a set of data in Excel
Shortcut: Alt+A+M
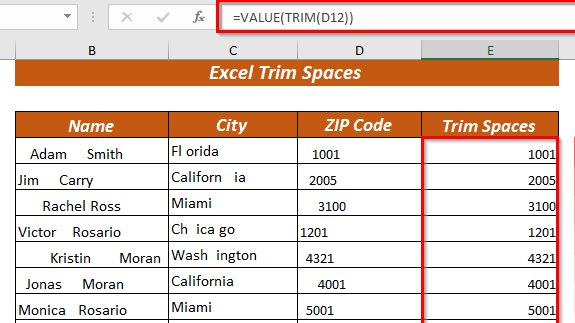
(11) Trim
=TRIM() helps to remove the extra spaces in data. TRIM can be useful in removing irregular spacing from imported data.
=TRIM() helps to remove the extra spaces in data. TRIM can be useful in removing irregular spacing from imported data.
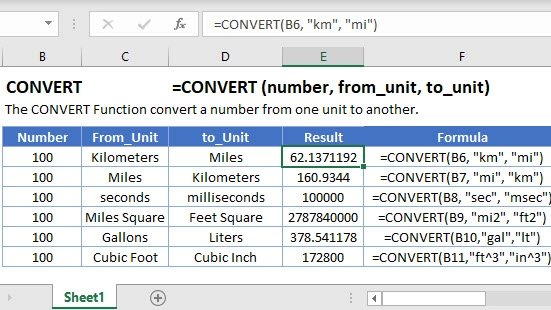
(12) Convert
This function converts one unit of measurement to another. There are multiple conversions that you can do. An example is meters to feet, or Celsius to Fahrenheit.
This function converts one unit of measurement to another. There are multiple conversions that you can do. An example is meters to feet, or Celsius to Fahrenheit.
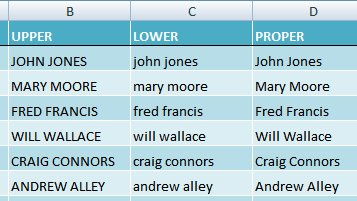
(13) Upper, Lower & Propper
=UPPER, Converts text to all uppercase
=LOWER, Converts text string to lowercase
=PROPER, Converts text to proper case
=UPPER, Converts text to all uppercase
=LOWER, Converts text string to lowercase
=PROPER, Converts text to proper case
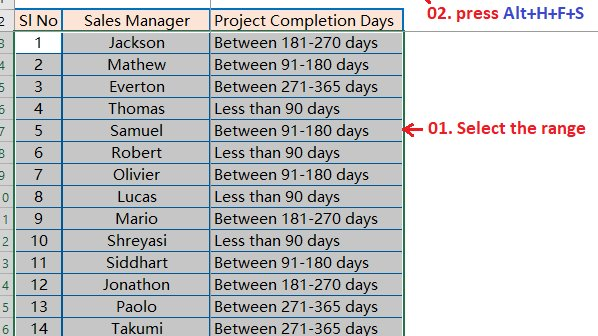
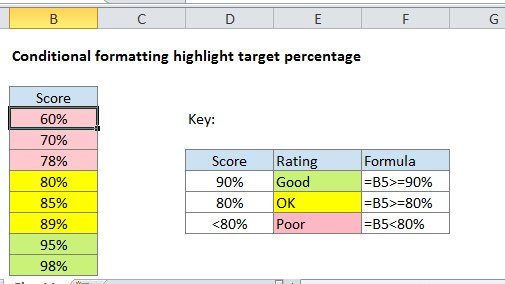
(14) Conditional Formatting
Conditional formatting helps to visualize data and shows patterns & trends in your data
Select 'Home' > Conditional Formatting > Highlighting Cell Rules
Conditional formatting helps to visualize data and shows patterns & trends in your data
Select 'Home' > Conditional Formatting > Highlighting Cell Rules
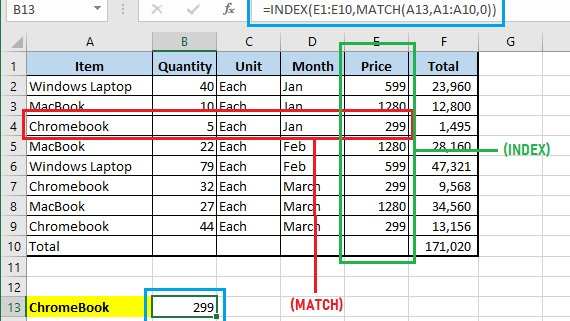
(15) Index Match:
The main difference between VLOOKUP and INDEX MATCH is the column reference.
VLOOKUP uses a static column reference but INDEX MATCH uses a dynamic column reference.
Index Match is much more flexible as you can search by row, by column, or by both.
The main difference between VLOOKUP and INDEX MATCH is the column reference.
VLOOKUP uses a static column reference but INDEX MATCH uses a dynamic column reference.
Index Match is much more flexible as you can search by row, by column, or by both.
Whatever job you choose, make sure you learn Microsoft Excel, a must-have skill! If you found this thread helpful, please:
• RT the FIRST tweet to share🔁
• Follow me @FluentInFinance for more
• Sign-up for my newsletter to learn more valuable skills: TheFinanceNewsletter.com!
• RT the FIRST tweet to share🔁
• Follow me @FluentInFinance for more
• Sign-up for my newsletter to learn more valuable skills: TheFinanceNewsletter.com!

Loading suggestions...