

Most people make Financial Statements hard.
I want to make them easy.
If I only had 5 minutes to review a business’s numbers, here is what I’d do:
I want to make them easy.
If I only had 5 minutes to review a business’s numbers, here is what I’d do:

First, I’d go to the Income Statement.
Revenue - Expenses = Net Income
When looking at this statement, you’re trying to understand: are you profitable?
I focus on 3 numbers:
• Revenue Growth
• Gross Margin
• Profit
Revenue - Expenses = Net Income
When looking at this statement, you’re trying to understand: are you profitable?
I focus on 3 numbers:
• Revenue Growth
• Gross Margin
• Profit
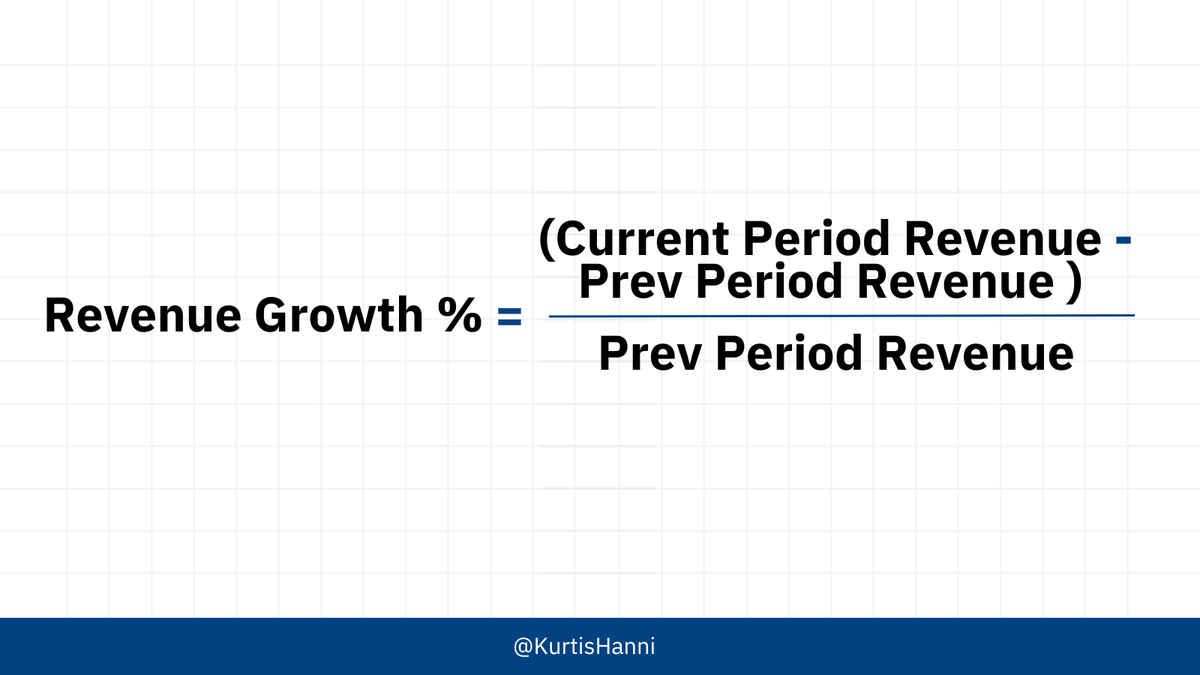
• Revenue Growth
Understand if it’s at or above the industry average or economic growth rate.
If so, it’s a sign the business is healthy.
Also look for breakouts of the product and/or service offered.
Understand if it’s at or above the industry average or economic growth rate.
If so, it’s a sign the business is healthy.
Also look for breakouts of the product and/or service offered.
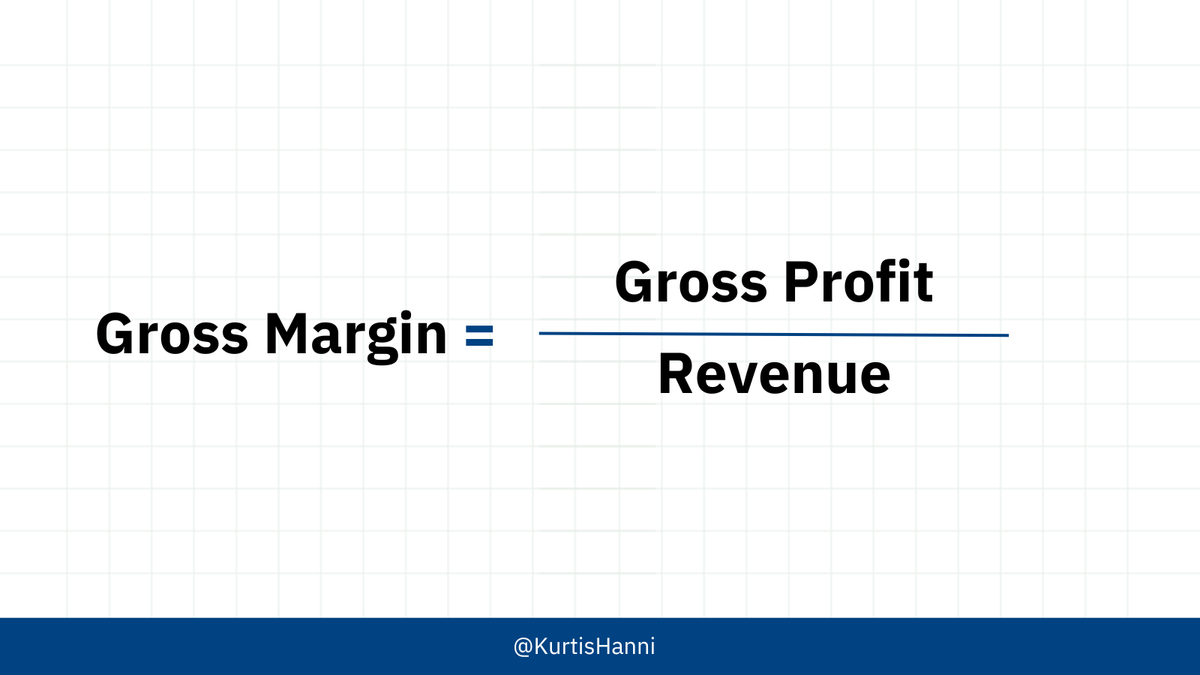
• Gross Margin
This is the percentage of money made after product/service cost on every dollar of revenue.
Compare this to industry averages to see how healthy the business is.
Too tight of margins makes it impossible to make money.
This is the percentage of money made after product/service cost on every dollar of revenue.
Compare this to industry averages to see how healthy the business is.
Too tight of margins makes it impossible to make money.
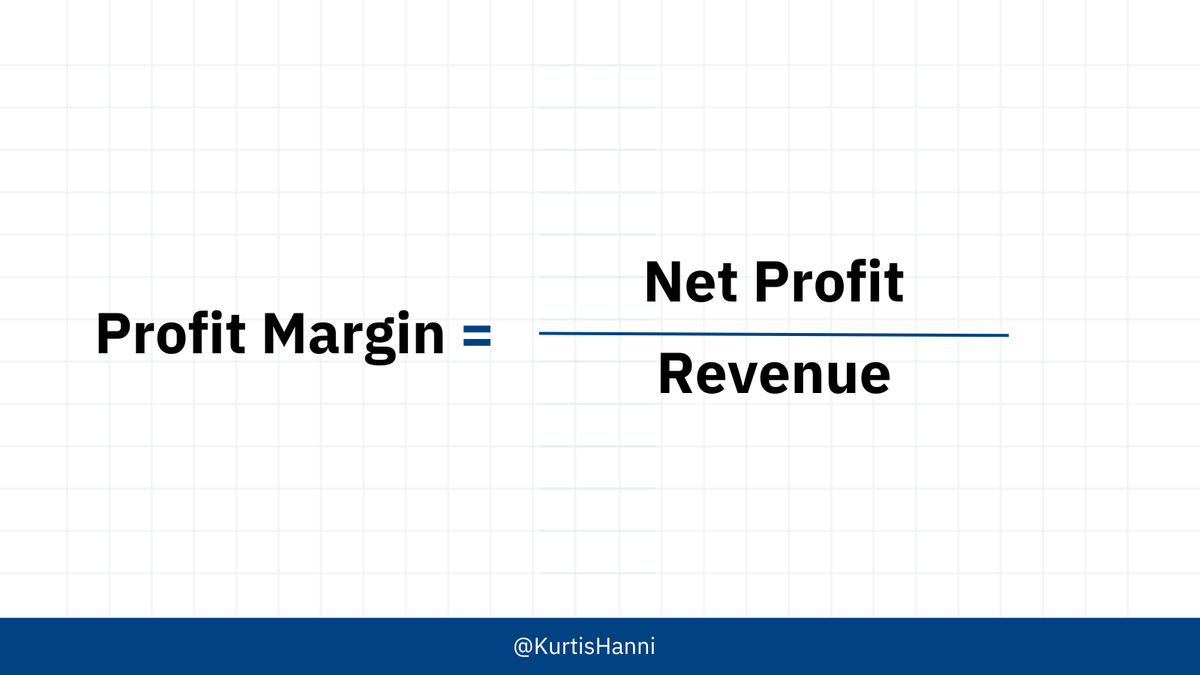
• Profit Margin
Healthy profit margins give you options. You can reinvest to grow the business or take dividends as the owner.
I keep this number in mind as I move to my Balance Sheet.
Healthy profit margins give you options. You can reinvest to grow the business or take dividends as the owner.
I keep this number in mind as I move to my Balance Sheet.
• Cash
Cash allows flexibility in your decisions.
3 things I look at:
- Change in cash balance over Income Statement period
- Operating Cash Flow
- Free Cash Flow
Cash allows flexibility in your decisions.
3 things I look at:
- Change in cash balance over Income Statement period
- Operating Cash Flow
- Free Cash Flow
▸ Cash Balance Today
This can be found on the Balance Sheet or Statement of Cash Flows.
I compare this number to the profit.
Do the profit and change in cash align?
If not, I look to the Statement of Cash Flows for how cash moved.
This can be found on the Balance Sheet or Statement of Cash Flows.
I compare this number to the profit.
Do the profit and change in cash align?
If not, I look to the Statement of Cash Flows for how cash moved.
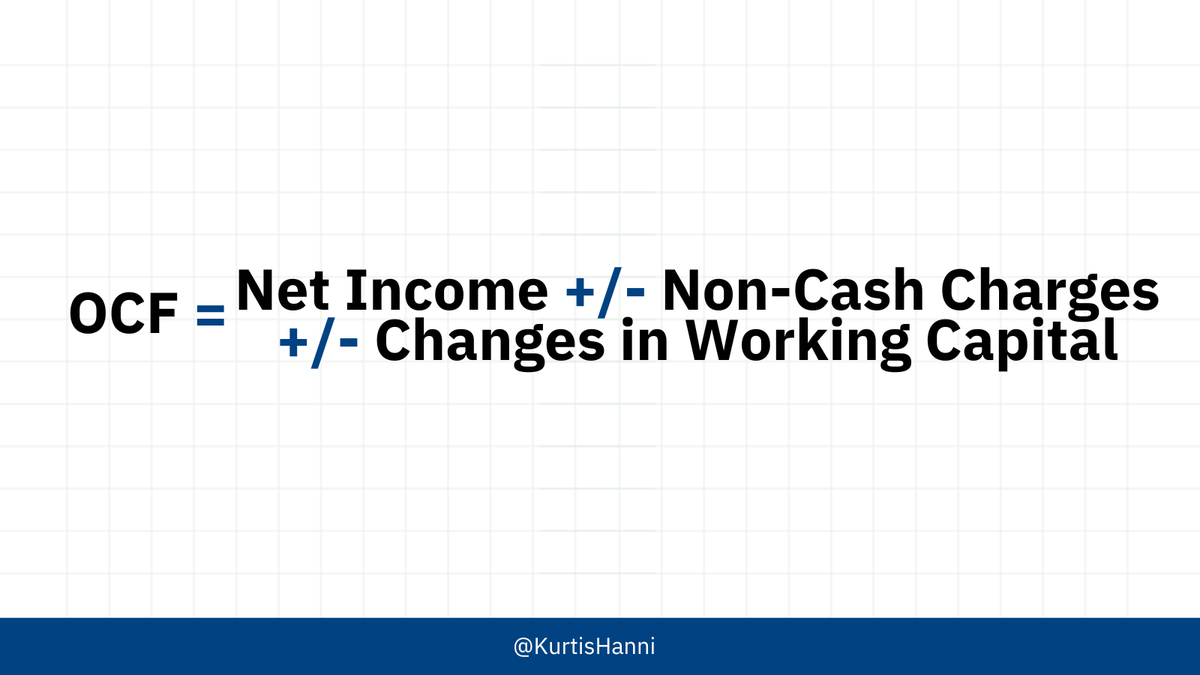
▸ Operating Cash Flow (OCF)
The income statement includes non-cash charges (like depreciation), so this tells you if enough cash is coming in to support the ongoing operations of the business.
Your OCF should consistently be positive.
The income statement includes non-cash charges (like depreciation), so this tells you if enough cash is coming in to support the ongoing operations of the business.
Your OCF should consistently be positive.
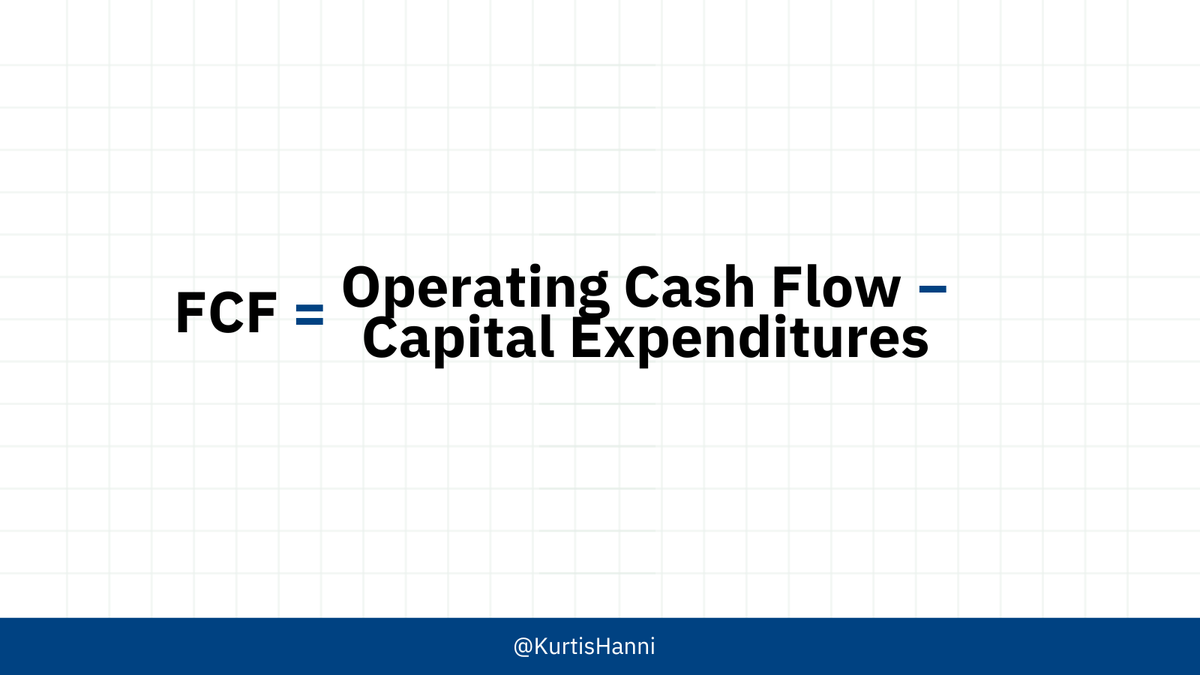
▸ Free Cash Flow (FCF)
If OCF is positive, but FCF is negative, that tells you they’re reinvesting in Capital Expenditures.
Looking at this and their assets, you can see how capital-intensive the business is.
If OCF is positive, but FCF is negative, that tells you they’re reinvesting in Capital Expenditures.
Looking at this and their assets, you can see how capital-intensive the business is.
• Debt Load
This tells you your ability to pay current & future obligations.
Using different ratios, you can understand the health of the company, as related to debt.
▸ Debt-to-equity Ratio
▸ Current/Working Capital Ratio
This tells you your ability to pay current & future obligations.
Using different ratios, you can understand the health of the company, as related to debt.
▸ Debt-to-equity Ratio
▸ Current/Working Capital Ratio
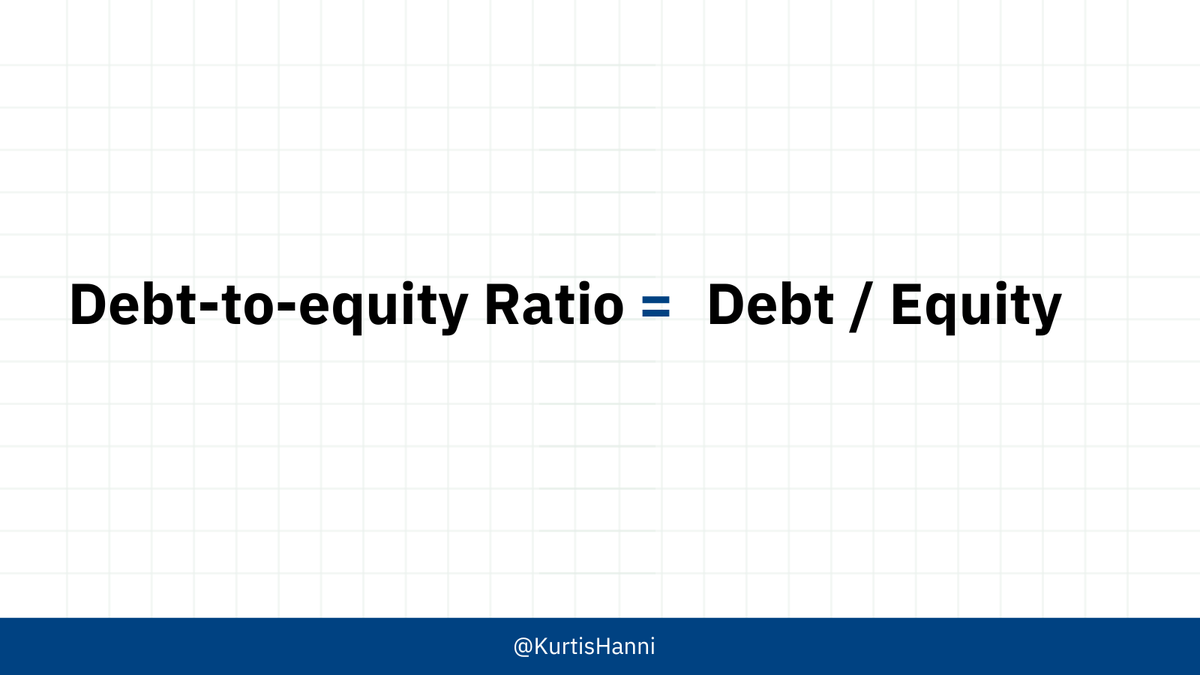
▸ Debt-to-equity Ratio
Too much debt strangles a business.
< 1 = safe & > 2 = risky
Watch your monthly trends and look to industry averages.
Too much debt strangles a business.
< 1 = safe & > 2 = risky
Watch your monthly trends and look to industry averages.
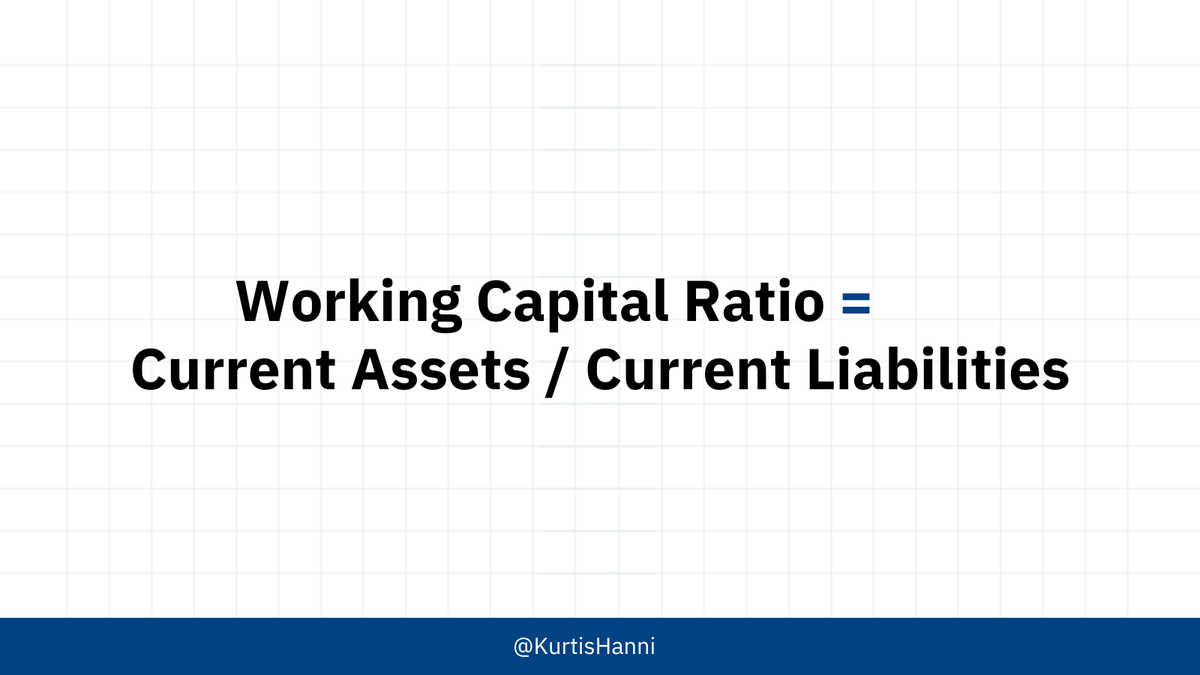
▸ Current/Working Capital Ratio
This measures your ability to pay obligations due within one year.
Remain above 1 to remain healthy, but too high means you’re using capital inefficiently.
This measures your ability to pay obligations due within one year.
Remain above 1 to remain healthy, but too high means you’re using capital inefficiently.
• Return on Capital
I want to know how good the returns of the business are.
Sure, they may be profitable, but if they’re locking up a ton of assets (& cash), it could be a bad return.
Depending on the business, I look at:
▸ Return on Assets (ROA)
▸ Return on Equity (ROE)
I want to know how good the returns of the business are.
Sure, they may be profitable, but if they’re locking up a ton of assets (& cash), it could be a bad return.
Depending on the business, I look at:
▸ Return on Assets (ROA)
▸ Return on Equity (ROE)
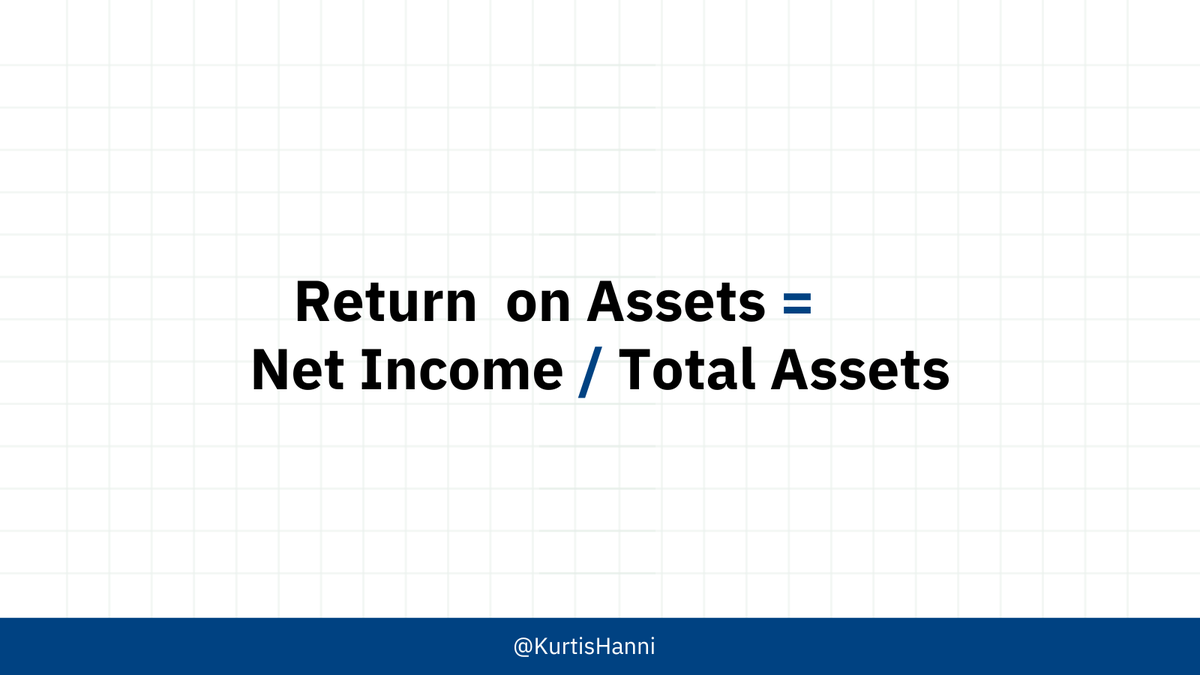
▸ Return on Assets
Return on Assets tells you how well you’re utilizing your business assets (cash, AR, equipment, and inventory).
Ideally, this should be greater than 5% and a great ratio is 20% or higher.
Return on Assets tells you how well you’re utilizing your business assets (cash, AR, equipment, and inventory).
Ideally, this should be greater than 5% and a great ratio is 20% or higher.
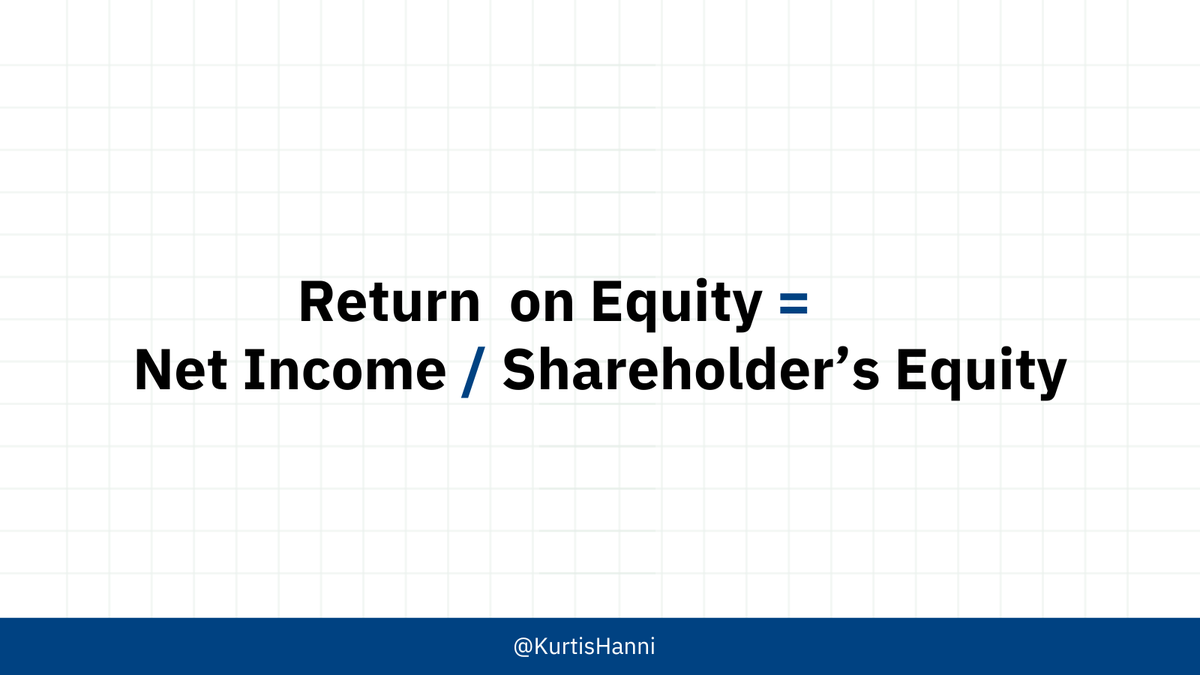
▸ Return on Equity
Return on Equity takes into account the value left in the business. Businesses with high leverage will generally have a good return on equity.
Ideally, you should be generating 15-20% or more return on equity.
Return on Equity takes into account the value left in the business. Businesses with high leverage will generally have a good return on equity.
Ideally, you should be generating 15-20% or more return on equity.
How do you get good at making these judgments?
Practice, baby.
It’s the only way.
Sit down with some financials and get to work.
Have questions? Reply and put them in the comments.
Practice, baby.
It’s the only way.
Sit down with some financials and get to work.
Have questions? Reply and put them in the comments.
If feel your finance knowledge is lacking, I have just the thing for you:
Every week I send 30k+ newsletter subscribers a break down of one financial concept.
Join them here and never doubt your numbers again:
join.kurtishanni.com
Every week I send 30k+ newsletter subscribers a break down of one financial concept.
Join them here and never doubt your numbers again:
join.kurtishanni.com

Loading suggestions...