

CONTINUATION PATTERNS IN FOREX AND CRYPTO📊
Have you ever struggled to determine if a trade is about to reverse or if it's just a correction within the trend?
Discover how Chart Continuation Patterns can help in this 🧵🪡.
❤️ and 🔁 to share!📊🫶🏽
Open Th~read ⤵️
Have you ever struggled to determine if a trade is about to reverse or if it's just a correction within the trend?
Discover how Chart Continuation Patterns can help in this 🧵🪡.
❤️ and 🔁 to share!📊🫶🏽
Open Th~read ⤵️

In The Last thread, we talked about Chart Reversal Patterns and how to spot them.
x.com
Today we will be looking at Continuation Patterns and how it can be useful when addressing the challenge In the first post of this 🧵
x.com
Today we will be looking at Continuation Patterns and how it can be useful when addressing the challenge In the first post of this 🧵
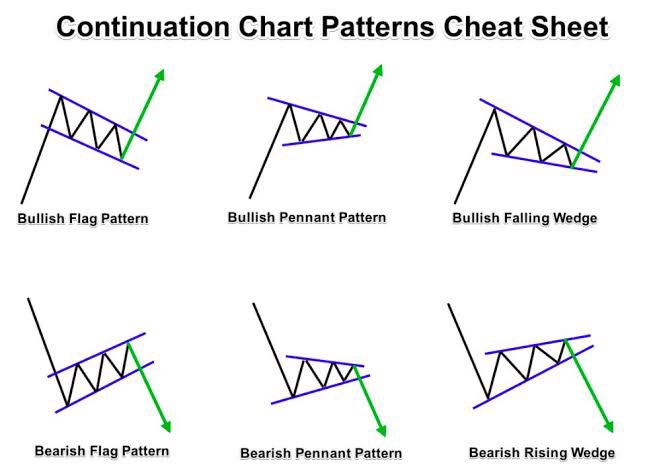
Chart Continuation Patterns are one of the easiest ways in determining if your trade is just correcting within the trend or about to reverse.
• The most common continuation patterns can be seen in the frame below 👇🏾
•We will take them one by one. >>>
•We will take them one by one. >>>
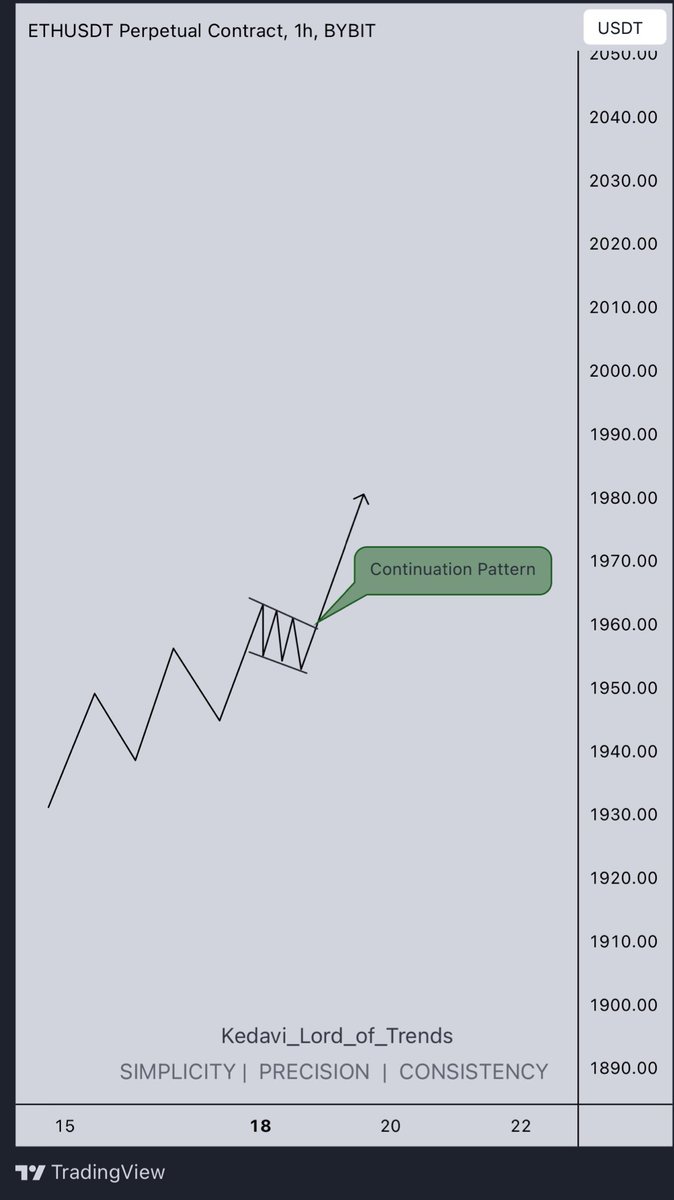
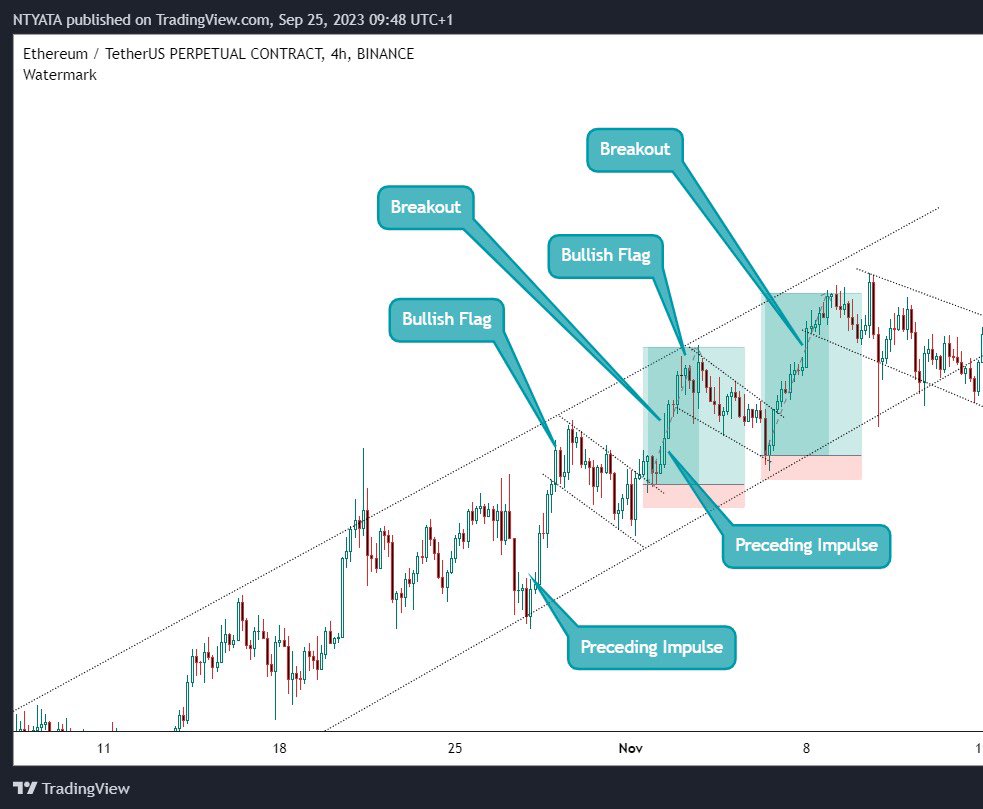
• The Bullish Flag pattern
This starts with a preceding bullish impulse move, then we see price consolidate in a flag followed by a breakout above leading to another impulse.
This starts with a preceding bullish impulse move, then we see price consolidate in a flag followed by a breakout above leading to another impulse.
The Bullish Flag can sometimes be called (The Three Drive Pattern) for its famous potential of reversing just after a third Tap on the bottom trend line of the channel in which price is trading.
Examples on Chart:
# Case scenario on $ETHUSDT
Examples on Chart:
# Case scenario on $ETHUSDT
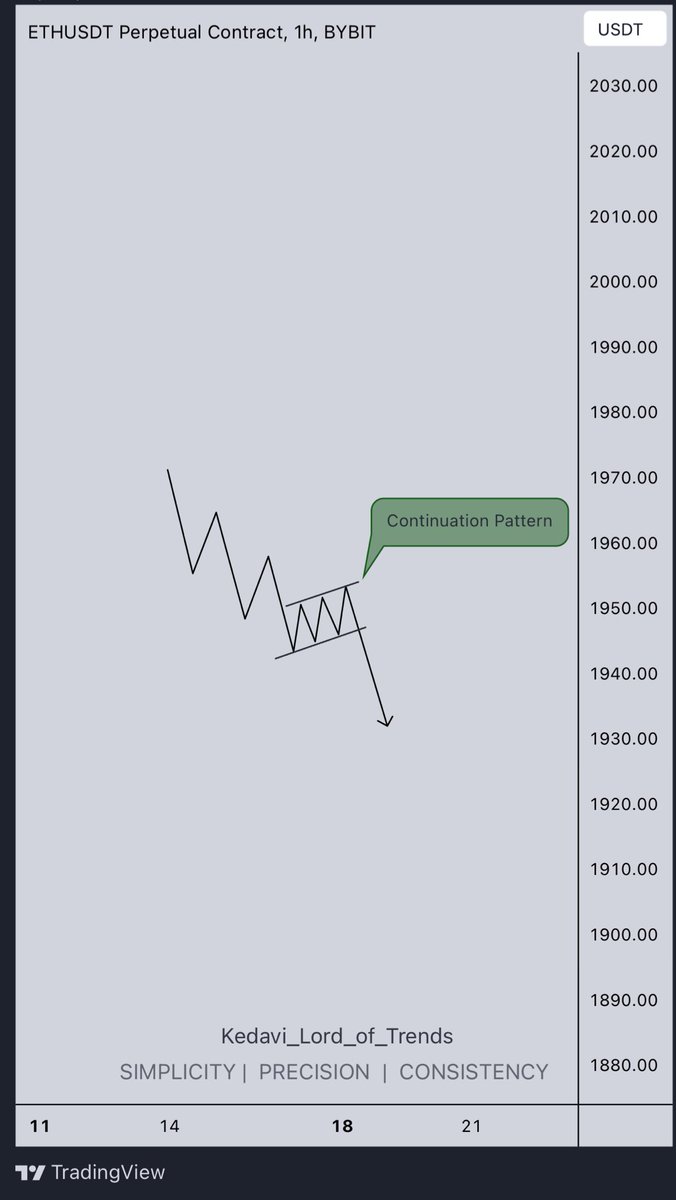
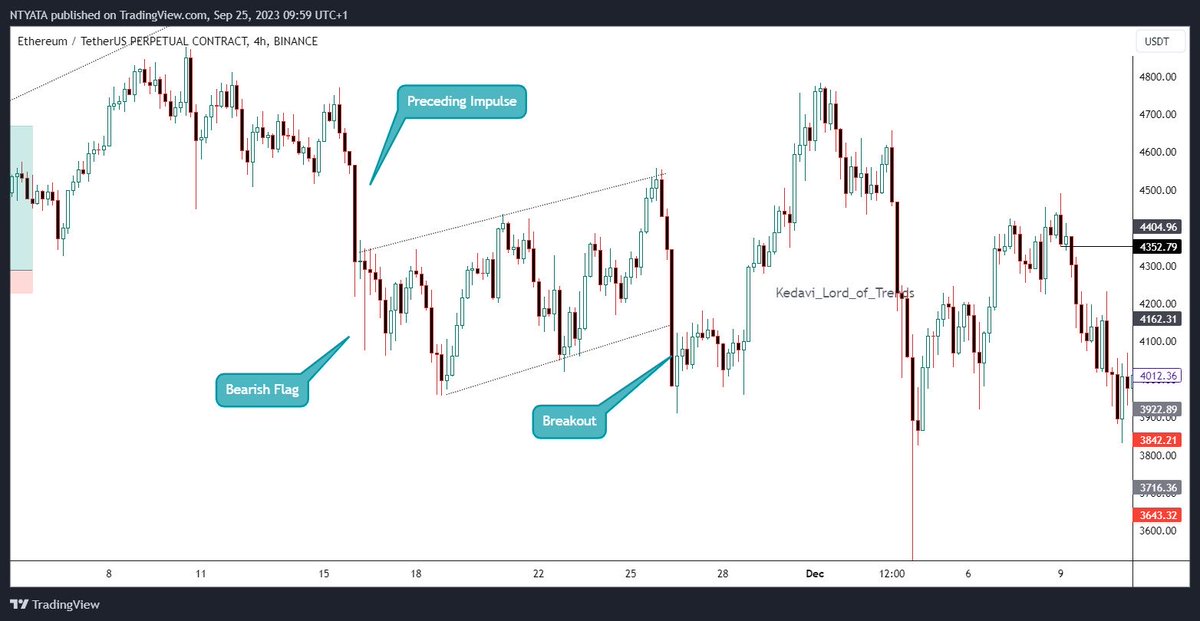
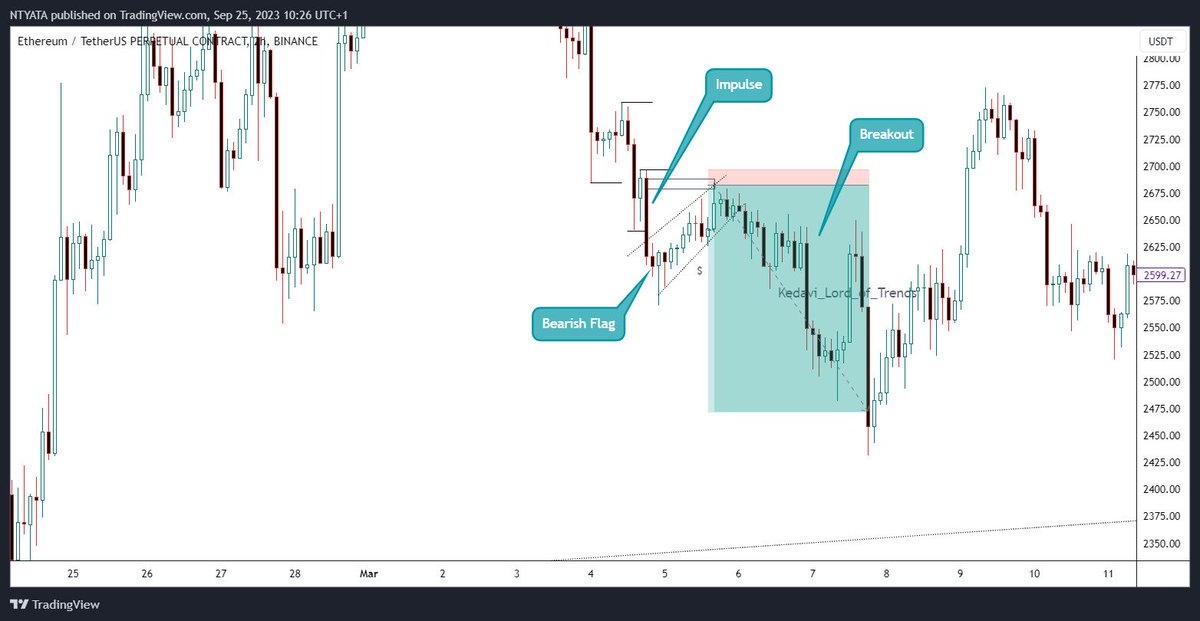
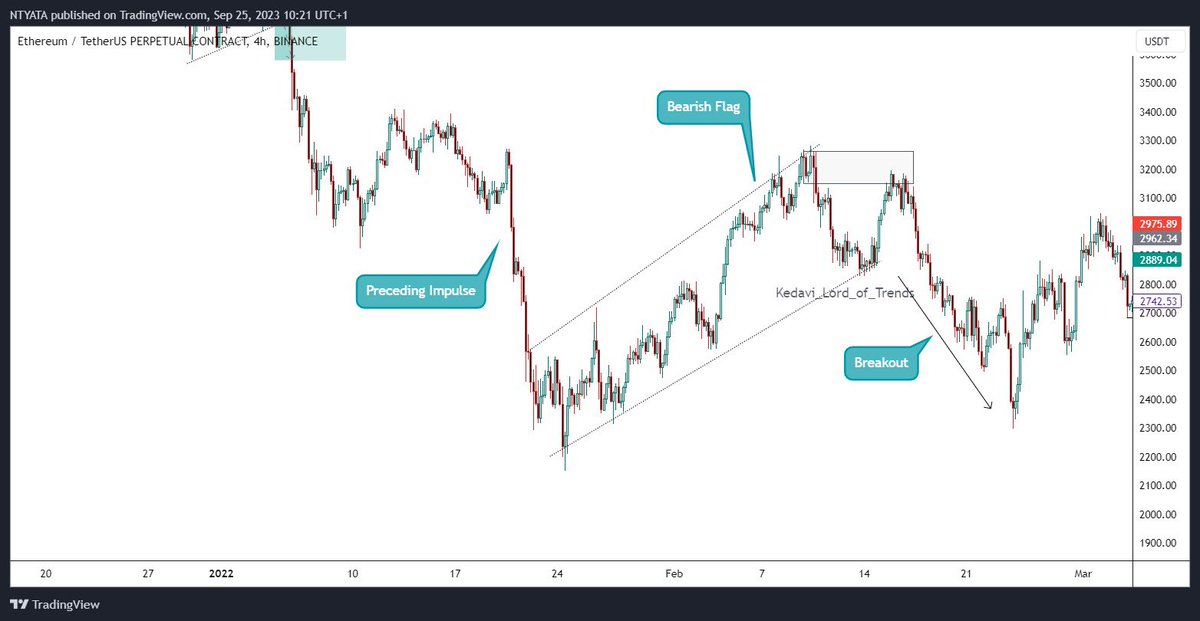
• Next we have The Bearish Flag Pattern
This is quite the opposite of the bullish flag. The preceding move is usually a bearish impulse, followed by a consolidation in a flag and then a downward breakout leading to another impulse.
This is quite the opposite of the bullish flag. The preceding move is usually a bearish impulse, followed by a consolidation in a flag and then a downward breakout leading to another impulse.
The Bearish flag pattern is very effective in a bear market
Examples on chart:
# Case scenario 1 on $ETHUSDT
Examples on chart:
# Case scenario 1 on $ETHUSDT
# Case scenario 2 on $ETHUSDT
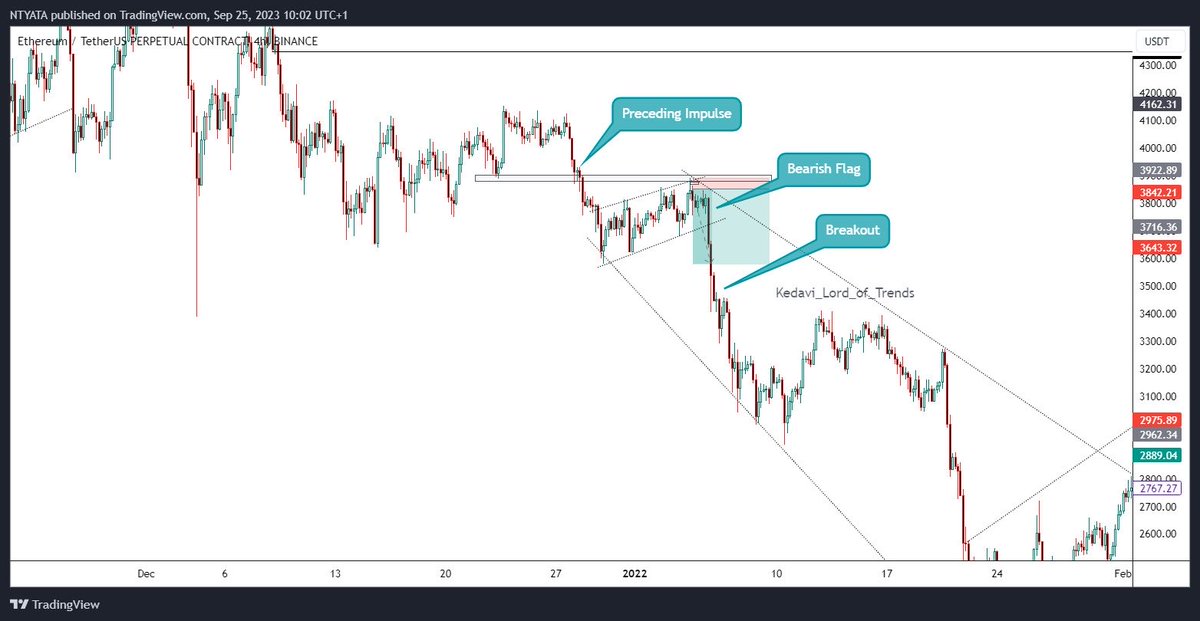
Another Case Scenario on $ETHUSDT.
•You can also combine this patterns with other confluences
•Look closely the bearish flag traded in to a FVG
•You can also combine this patterns with other confluences
•Look closely the bearish flag traded in to a FVG
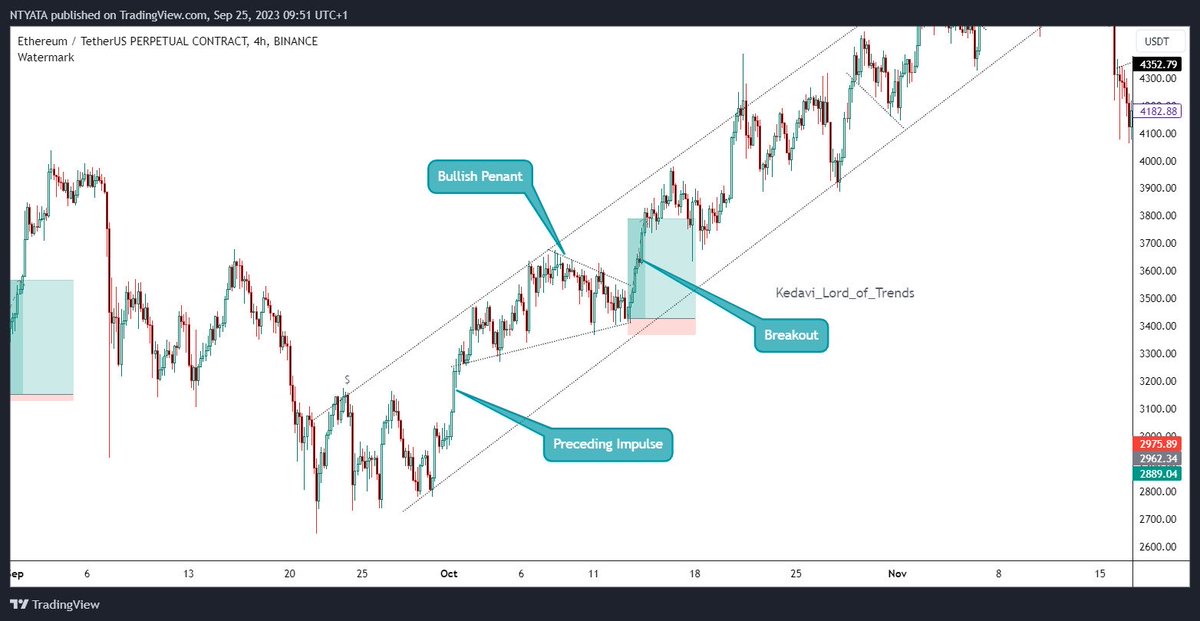
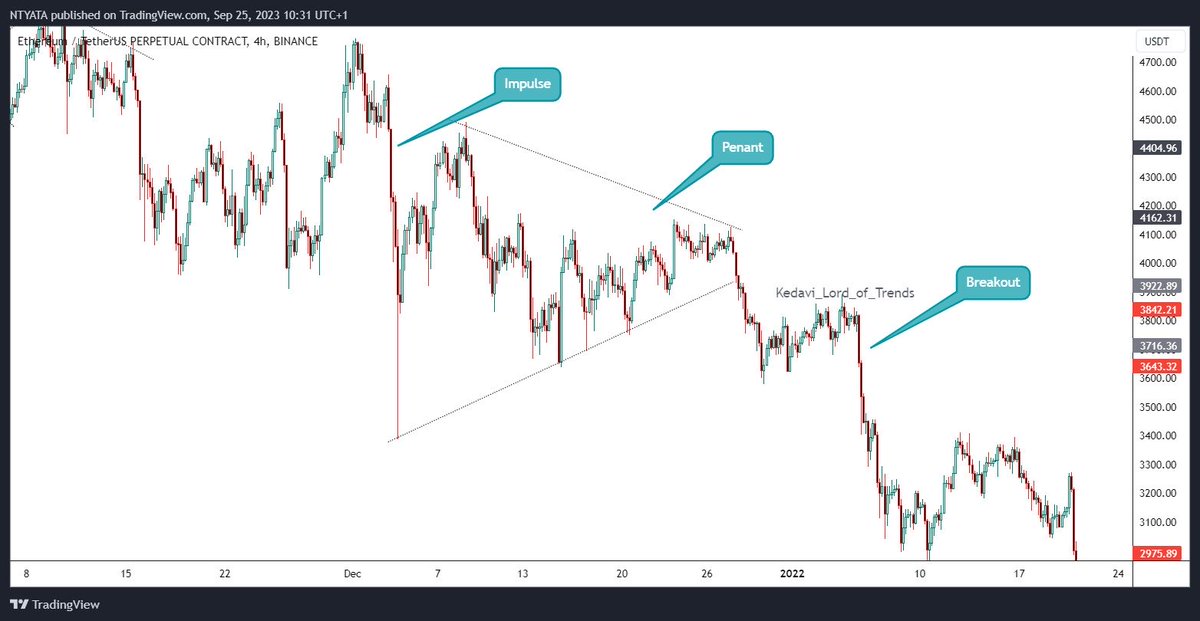
•The Bullish Penant
Starts with a preceding bullish impulse move then we see price trading in a penant shaped structure. A break out occurs to the upside as a continuation of the major trend.
Starts with a preceding bullish impulse move then we see price trading in a penant shaped structure. A break out occurs to the upside as a continuation of the major trend.
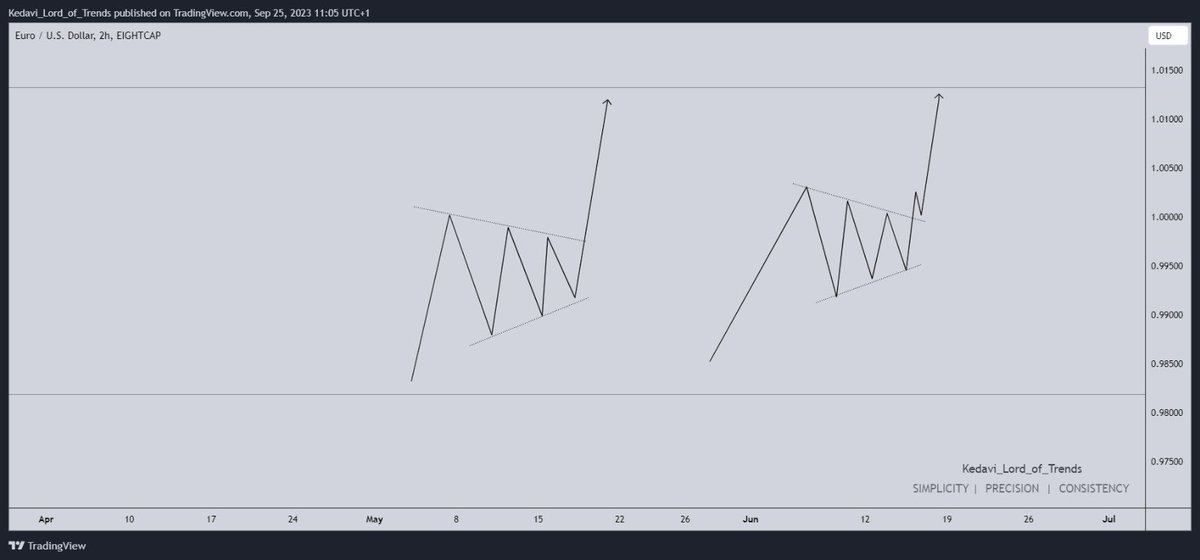
# Case scenario on $ETHUSDT
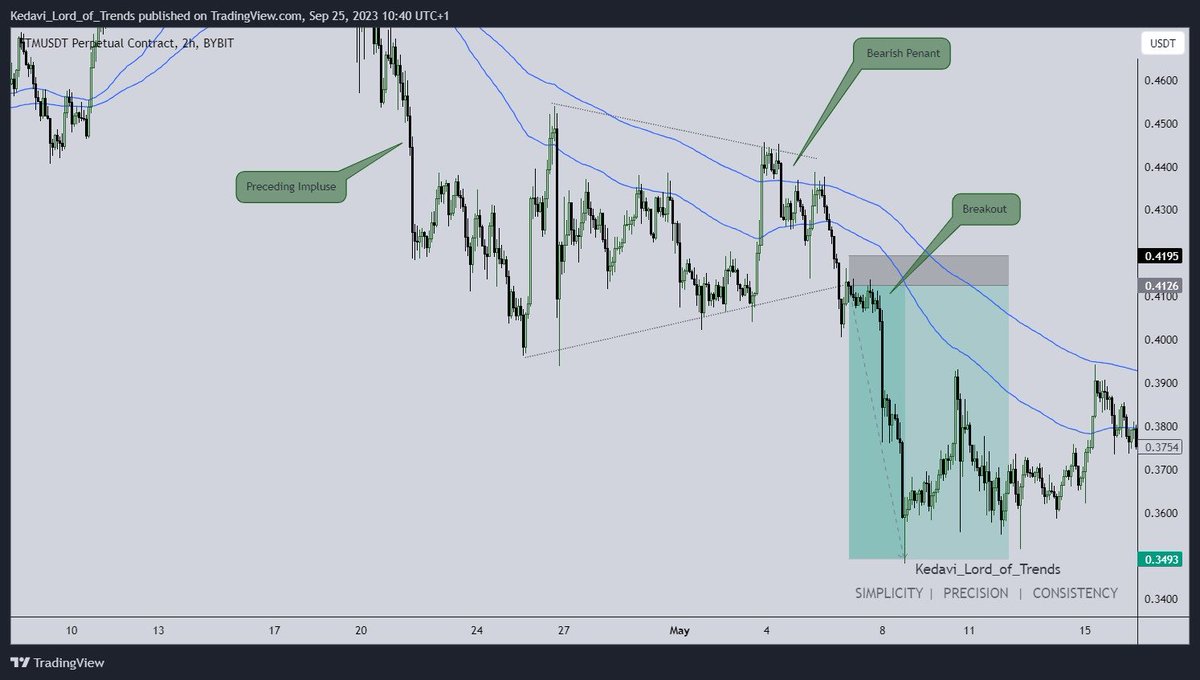
•The Bearish Penant
This is the opposite of the bullish penant.
The preceding move is usually a bearish impulse, followed by a consolidation in a penant and then a downward breakout leading to another bearish impulse.
This is the opposite of the bullish penant.
The preceding move is usually a bearish impulse, followed by a consolidation in a penant and then a downward breakout leading to another bearish impulse.
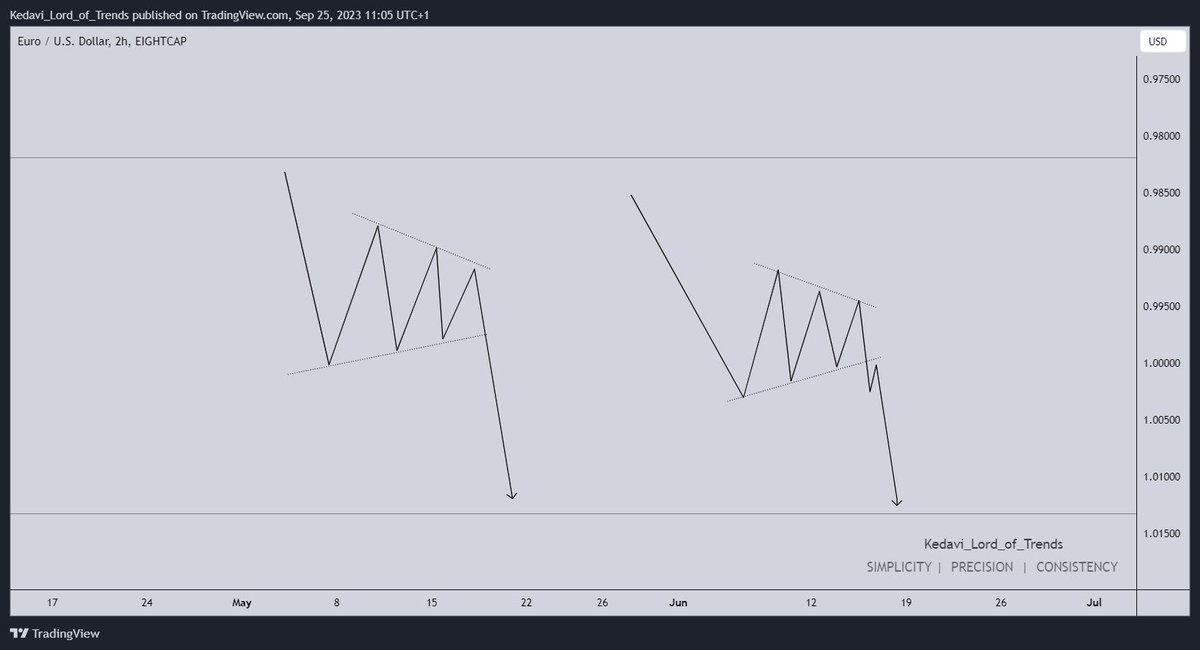
# Case scenario 1 on $ETHUSDT
Another Case Scenario on $FTMUSDT
Do you know you can combine confluences for high probability trades?
Here we can see a retest occur after the breakout and entry was taken from that point.
Look closely you’ll also see that price broke through a previous demand and that entry was supported by a breaker block.👏🏾
Do you know you can combine confluences for high probability trades?
Here we can see a retest occur after the breakout and entry was taken from that point.
Look closely you’ll also see that price broke through a previous demand and that entry was supported by a breaker block.👏🏾
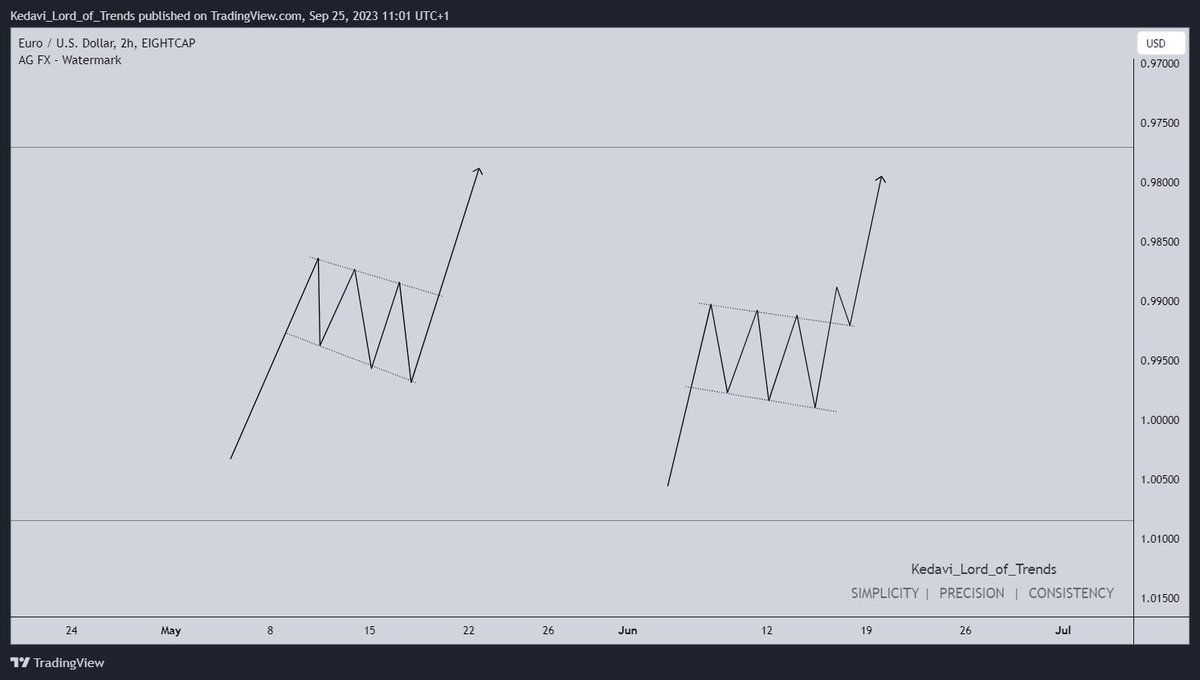
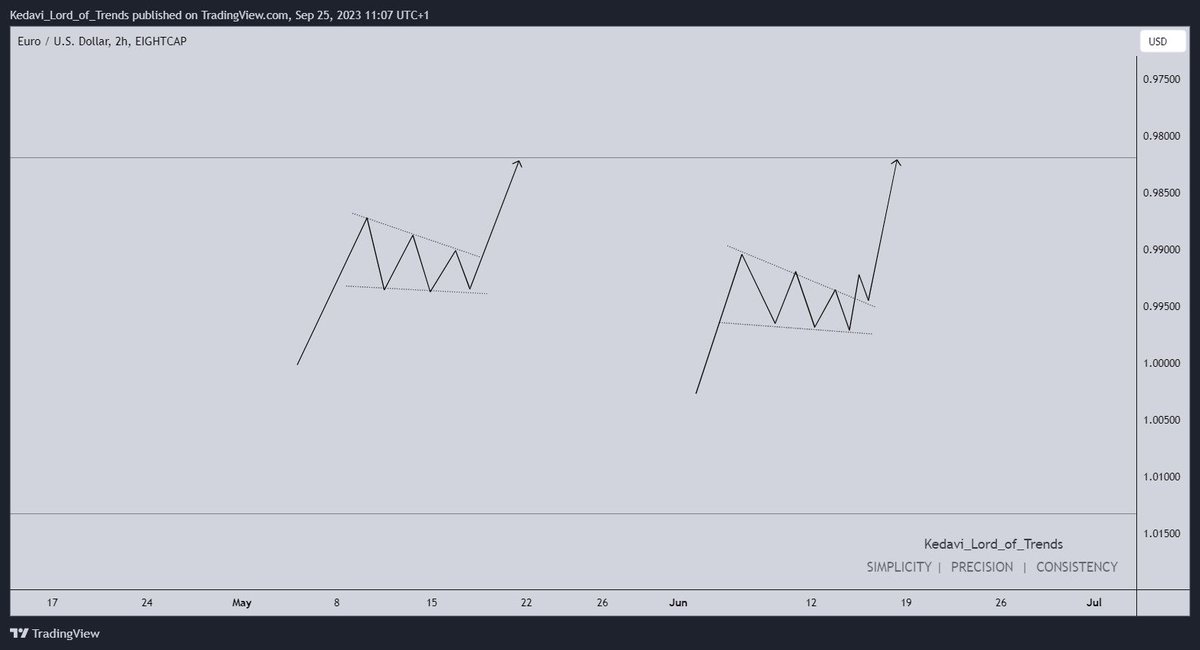
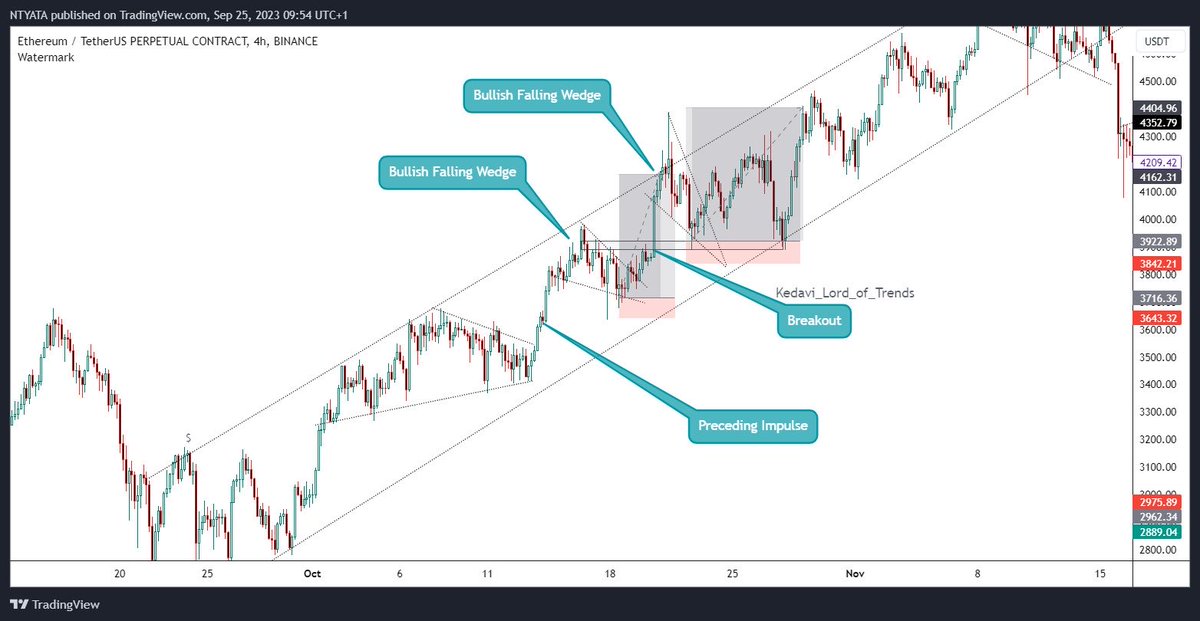
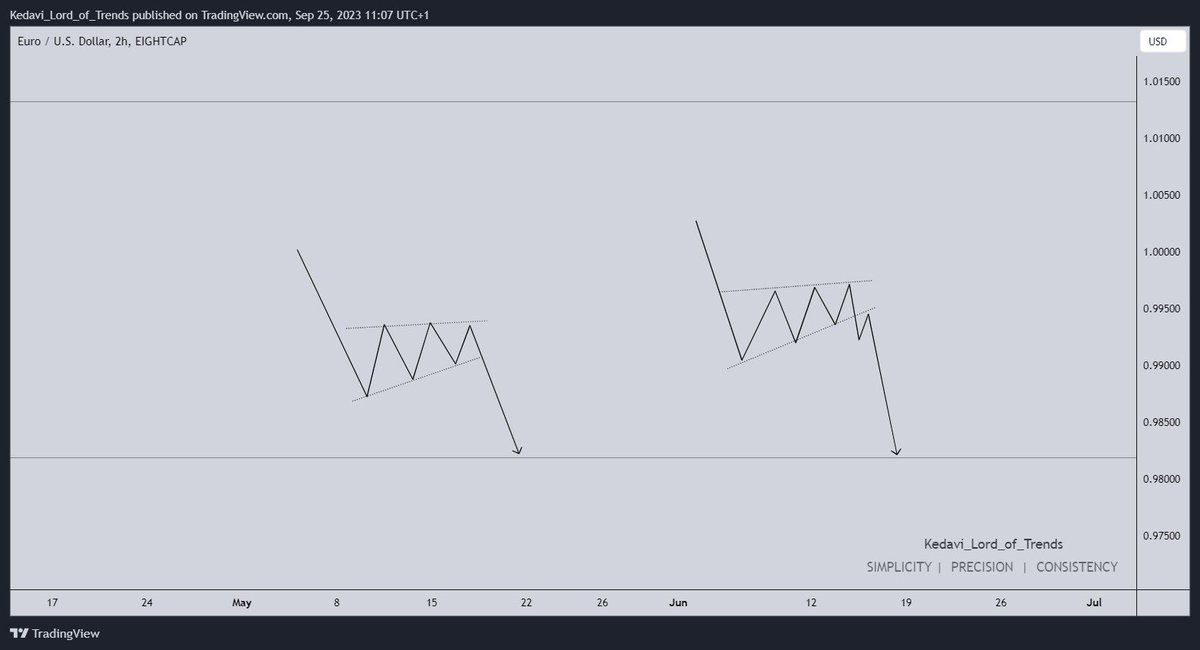
• The bullish Falling Wedge
This is a common continuation pattern that surfaces in aggressive bull markets. It is sometimes mistaken for the bullish flag pattern.
The difference is price trades in a wedge like structure and not a perfect flag as shown below.
This is a common continuation pattern that surfaces in aggressive bull markets. It is sometimes mistaken for the bullish flag pattern.
The difference is price trades in a wedge like structure and not a perfect flag as shown below.
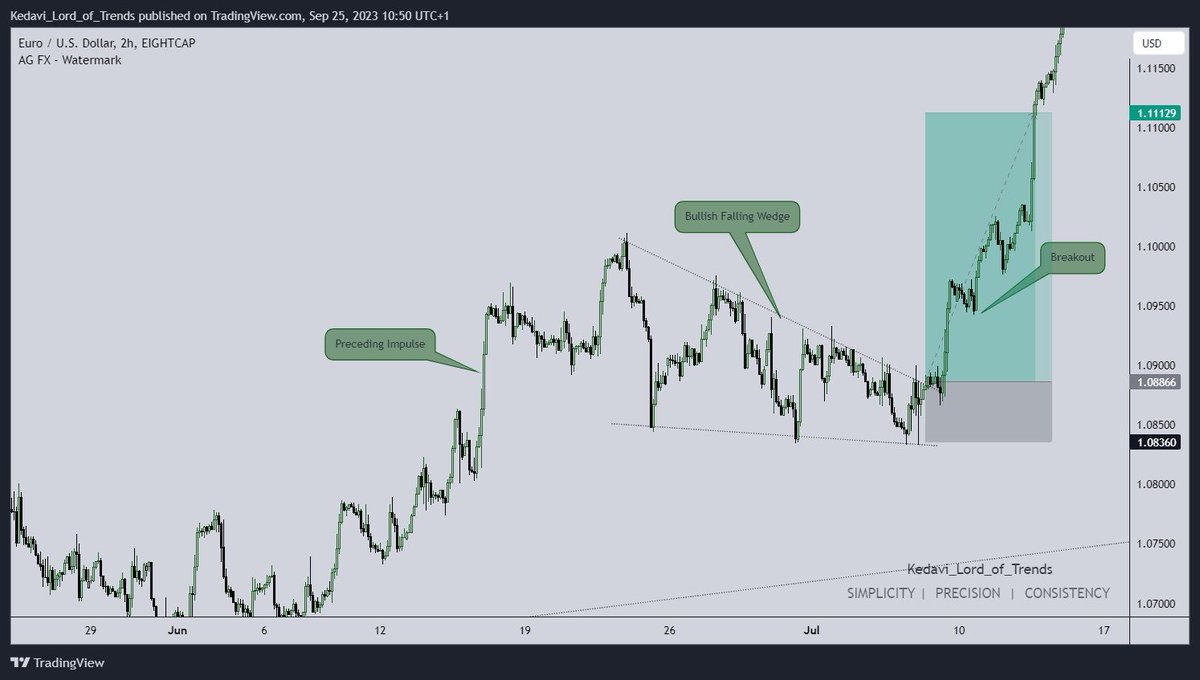
# Case scenario 1 on $EURUSD
More Case Scenarios on $ETHUSDT
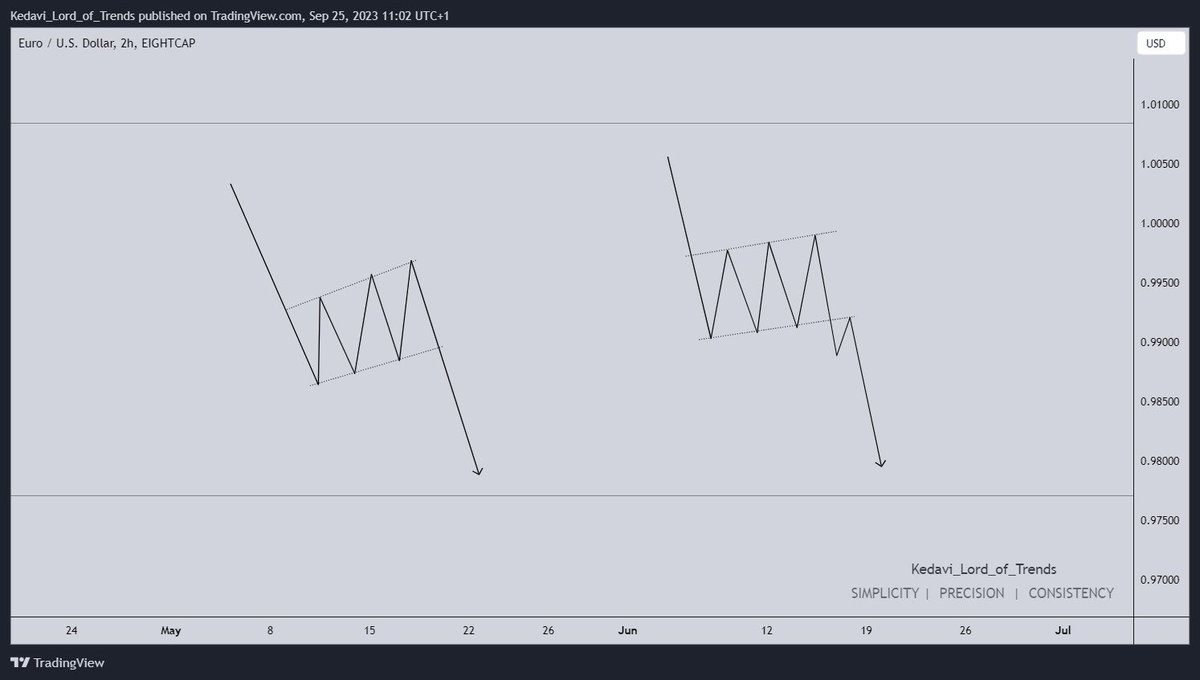
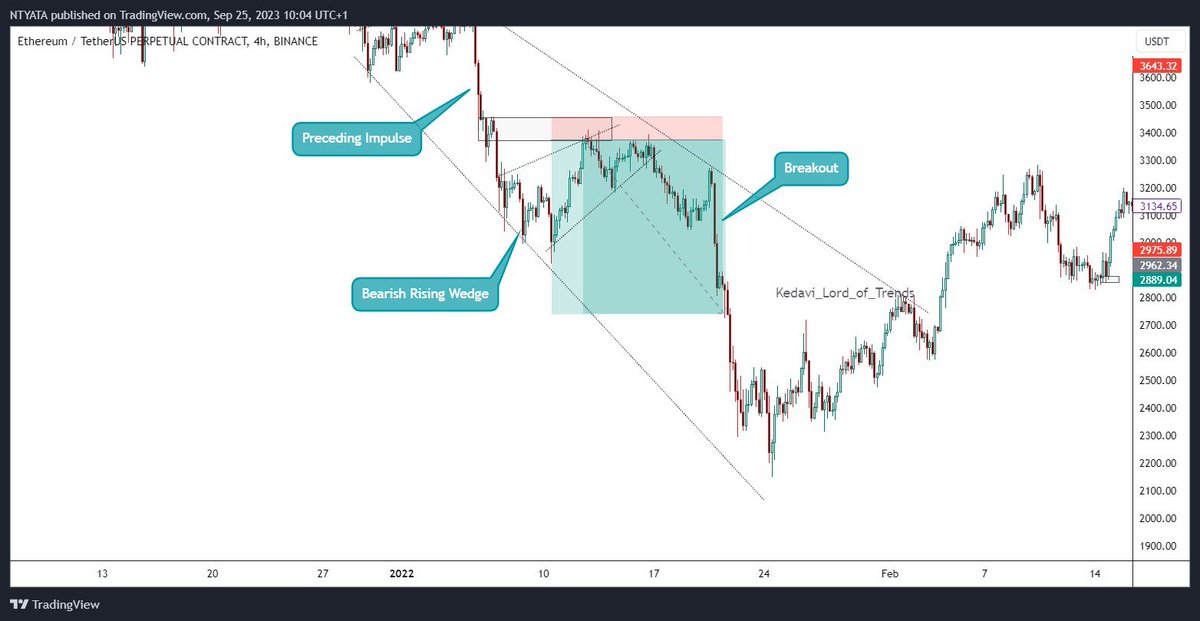
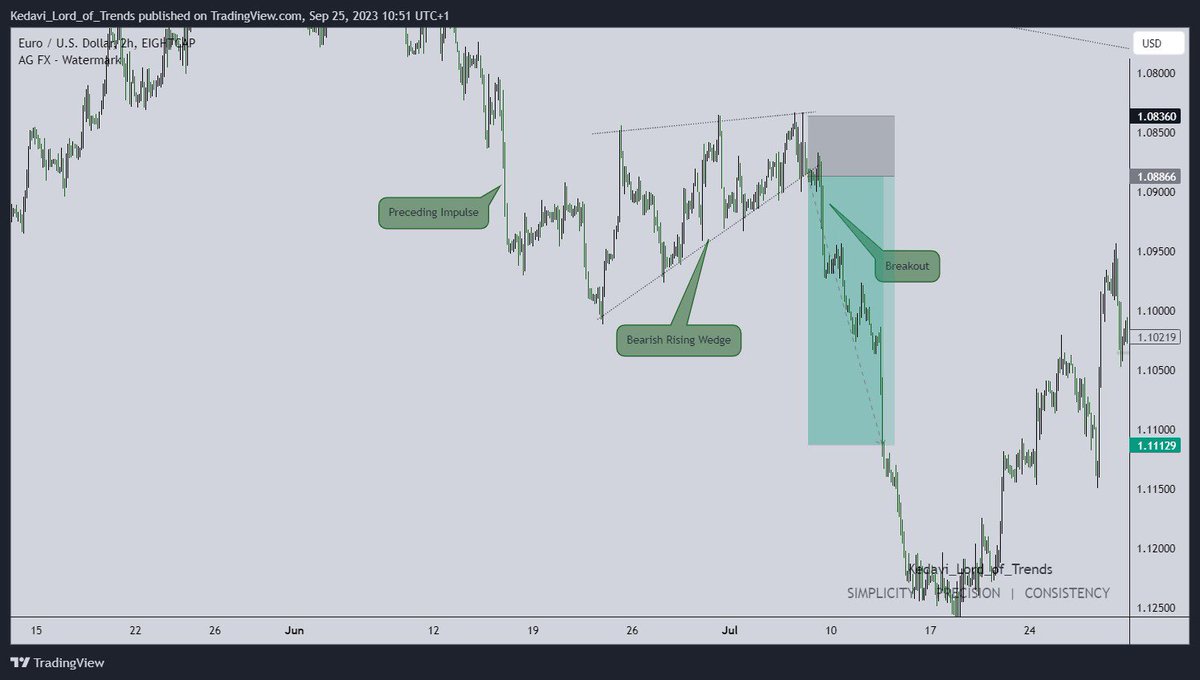
• The bearish Rising Wedge
This is a common continuation pattern that surfaces in aggressive bear markets. It is sometimes mistaken for the bearish flag pattern.
The difference is price trades in a wedge like structure and not a flag.
This is a common continuation pattern that surfaces in aggressive bear markets. It is sometimes mistaken for the bearish flag pattern.
The difference is price trades in a wedge like structure and not a flag.
# Case scenario 1 on $ETHUSDT
# Case Scenario 2 on $EURUSD
More Case Scenarios on $ETHUSDT
Now, Pattern can fail Yes!
But These patterns are highly probable to deliver when you apply them in the right market conditions obviously while following the trend.
Meanwhile If you gained anything from this 🧵, do well to drop a like❤️ and also repost🔁 to share to others. 🫶🏽
But These patterns are highly probable to deliver when you apply them in the right market conditions obviously while following the trend.
Meanwhile If you gained anything from this 🧵, do well to drop a like❤️ and also repost🔁 to share to others. 🫶🏽
Tagging some Top experts for valuable contents on here, follow and turn on 🔔for more educational contents like this also
@Alagpro @AceDeGreat @Frank_The_Wiz @Techriztm @Alh_Myke1 @Call_me_Cypher @Kelvintalent_ @Kelvin_Graph @Starr_gael @_InvestorBen @Marresecira @Akiindamola @trayyon_dmn @SDX_Trades @SamuelXeus @_Quivira @cyrusologun_
@Alagpro @AceDeGreat @Frank_The_Wiz @Techriztm @Alh_Myke1 @Call_me_Cypher @Kelvintalent_ @Kelvin_Graph @Starr_gael @_InvestorBen @Marresecira @Akiindamola @trayyon_dmn @SDX_Trades @SamuelXeus @_Quivira @cyrusologun_
Join KN Telegram Community also for more Educational contents
t.me
t.me
Loading suggestions...