

TRENDLINE IS NOT YOUR ENEMY
Let me take you through the use of trendline as a confluence. I understand the need to make our chart as clean as possible. However we should not ignore making use of some basic approach in trading as an SMC trader.
Let me take you through the use of trendline as a confluence. I understand the need to make our chart as clean as possible. However we should not ignore making use of some basic approach in trading as an SMC trader.
Trendline is an approach in retail trading that helps to understand highs and lows of a trend as it name implies. Though most Smc trader as seen trading as a competition between institution and retail. If you are a new trader,
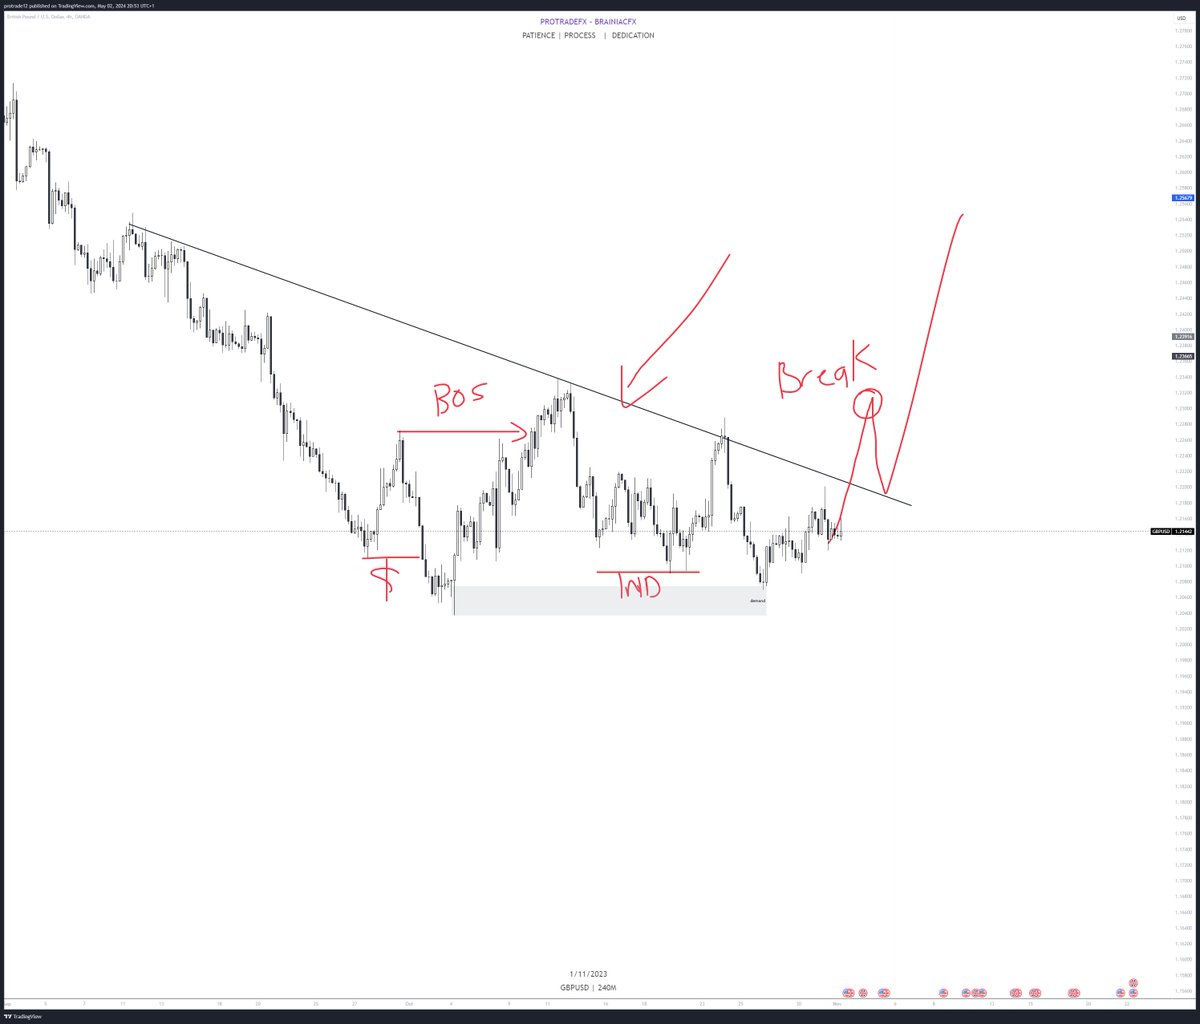
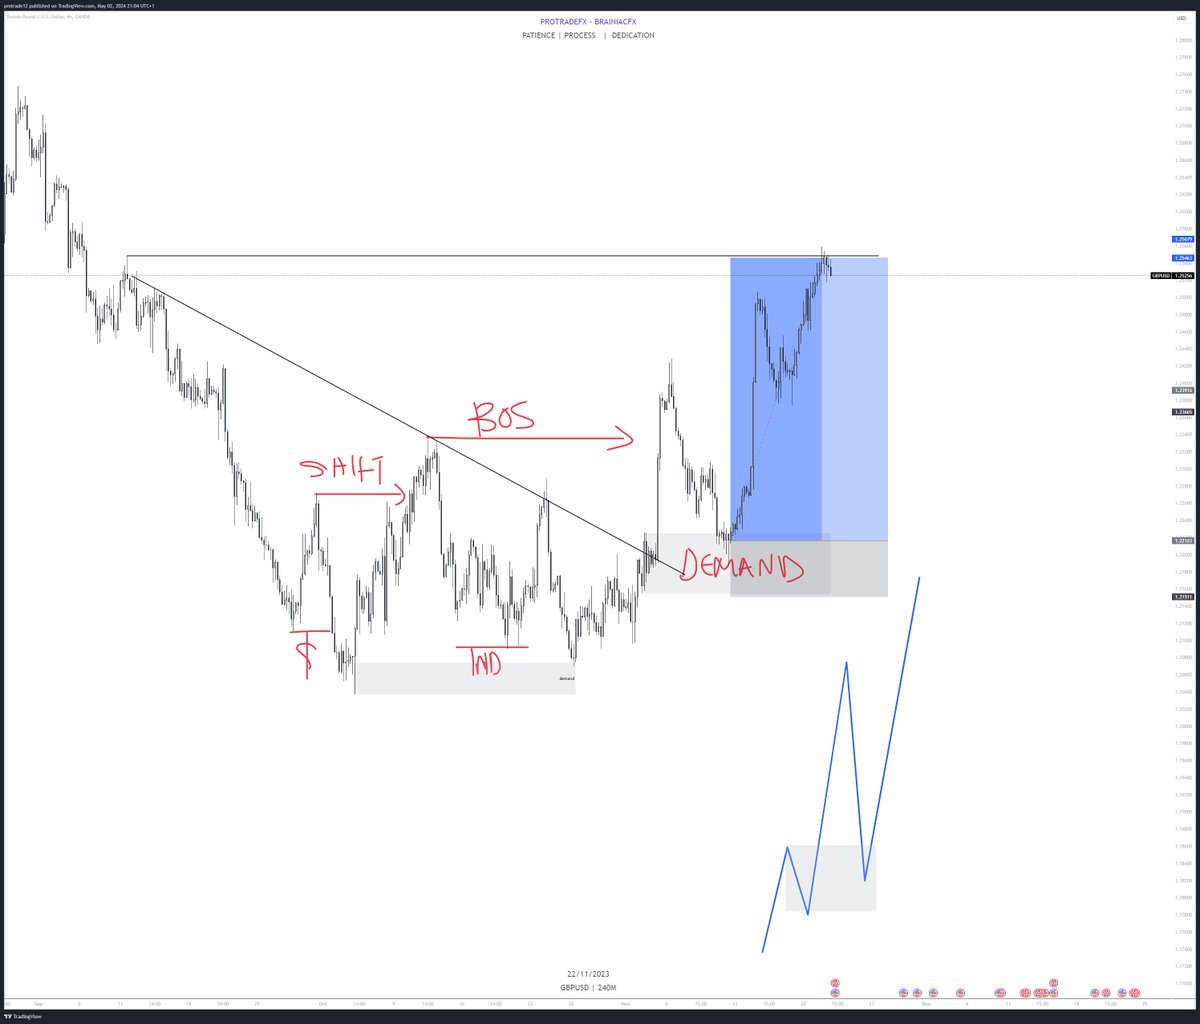
this approach might help you understand a true break of Highs or low. First is to be able to know what the trend is saying, either bearish or bullish as in the image below
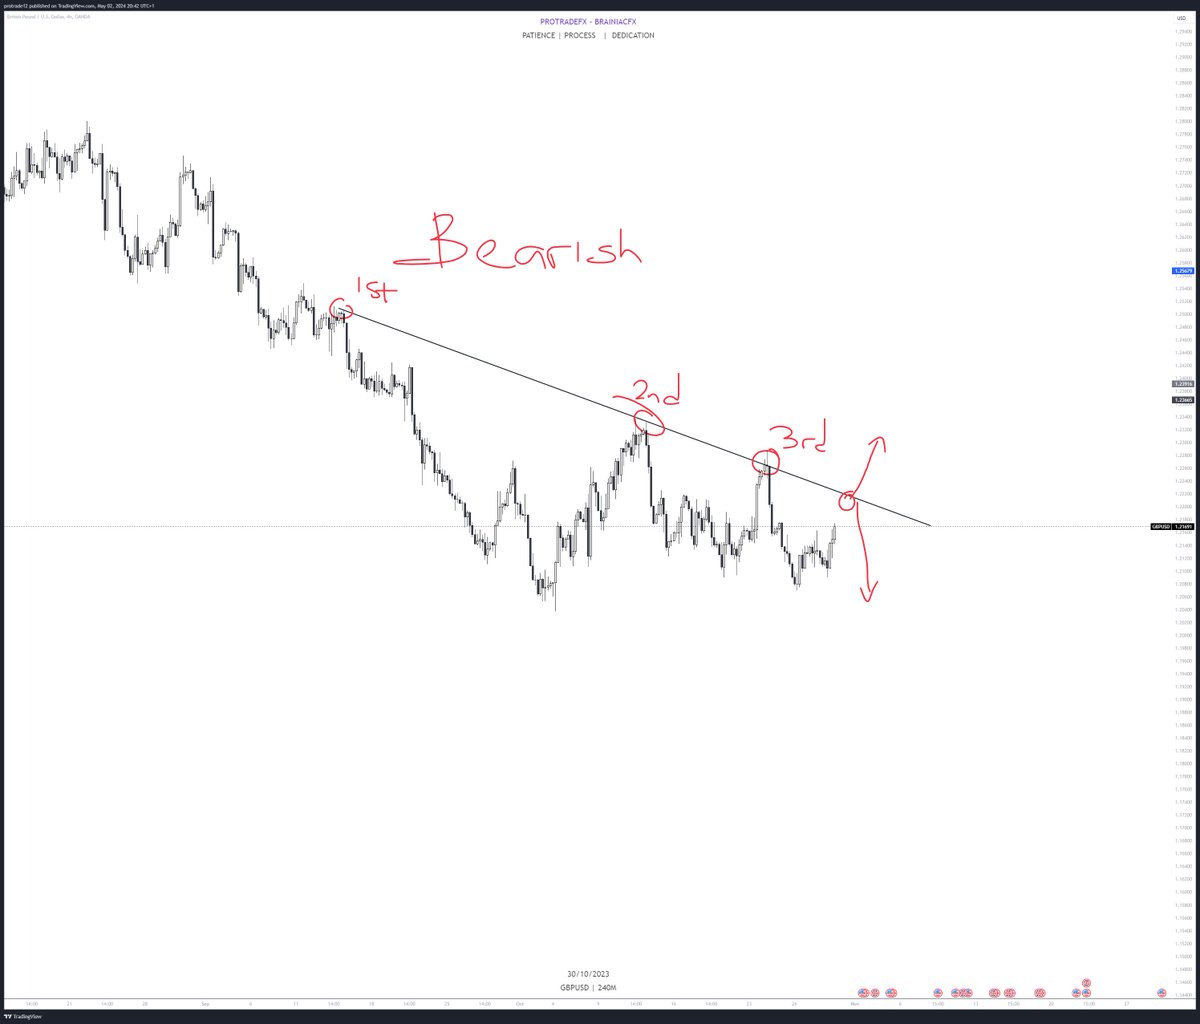
Notice how the trend is bearish and price bouncing off the trendline on multiple touches then sell off. The idea is to wait for intent of buy to be shown not necessary catching the bottom of the buy trades, but waiting for a clear break of structure.
So let us mark this particular chart as an SMC trader would to have a clear understanding, first there is always two sides to market. Either a buy or a sell, now these two images below might confuse your choice if you see both
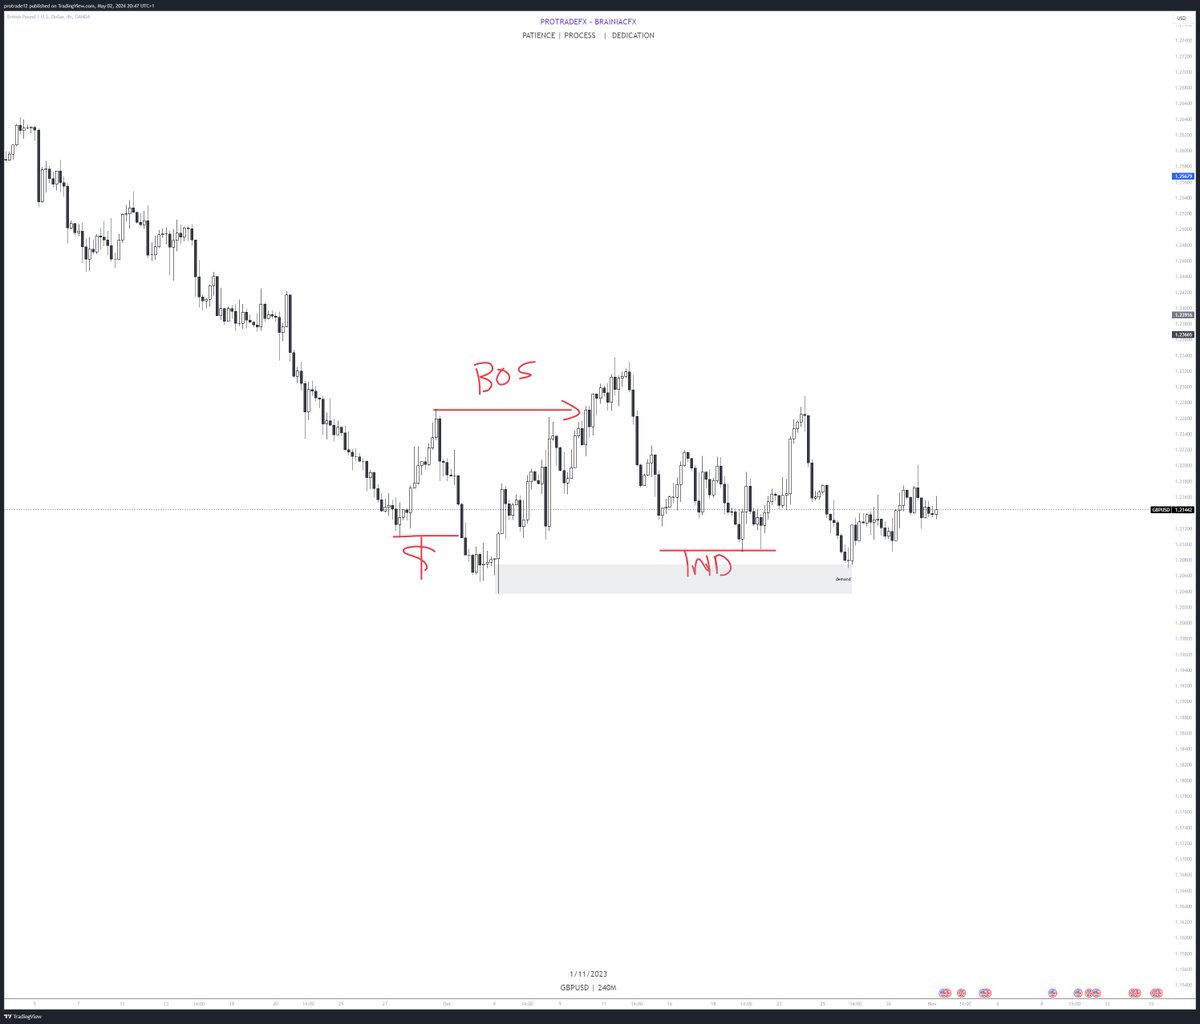
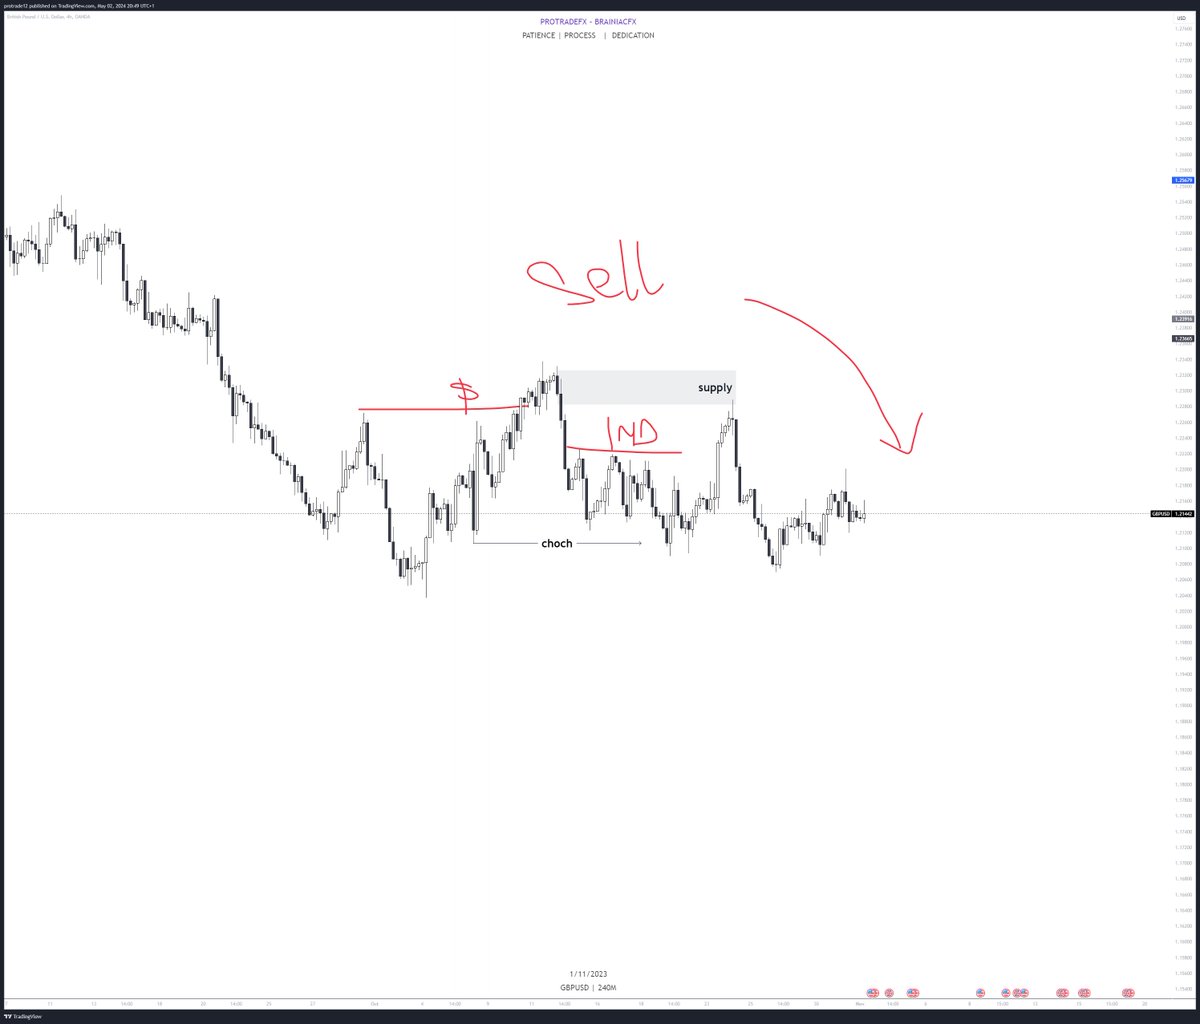
Now you can see how clearly one chart may have different bias depending on which trader is analyzing. You can easily eliminate this by using a trendline and focusing only on the break of the trend and an impulsive expansion. Now let me show you again
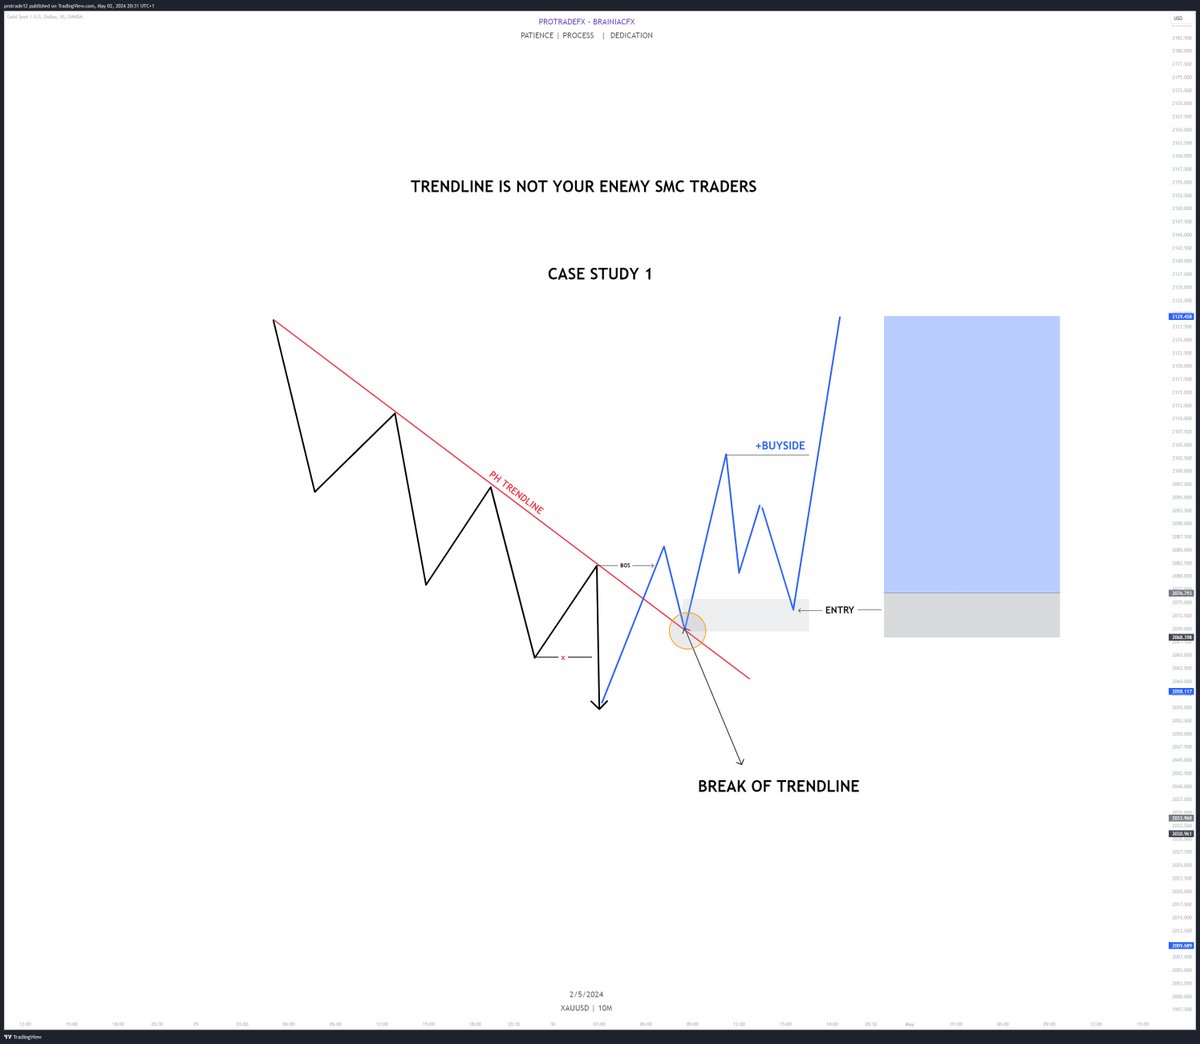
Back to what we want to see from the first image I shared starting this thread, we definitely want to see a break away from the trendline (INTENT). The RETEST of the trend and an EXPANSION for buys. Look at the two images below
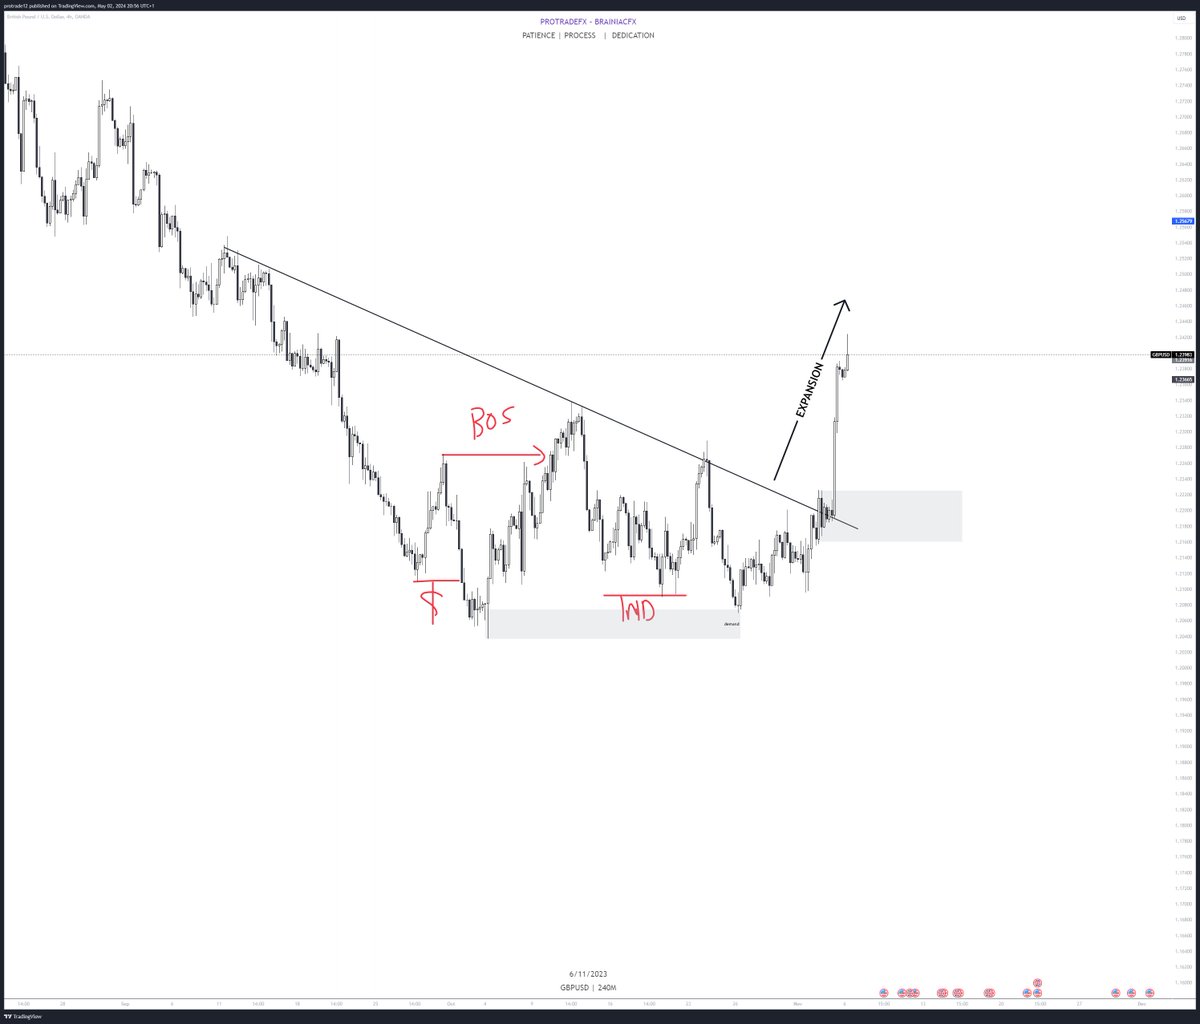
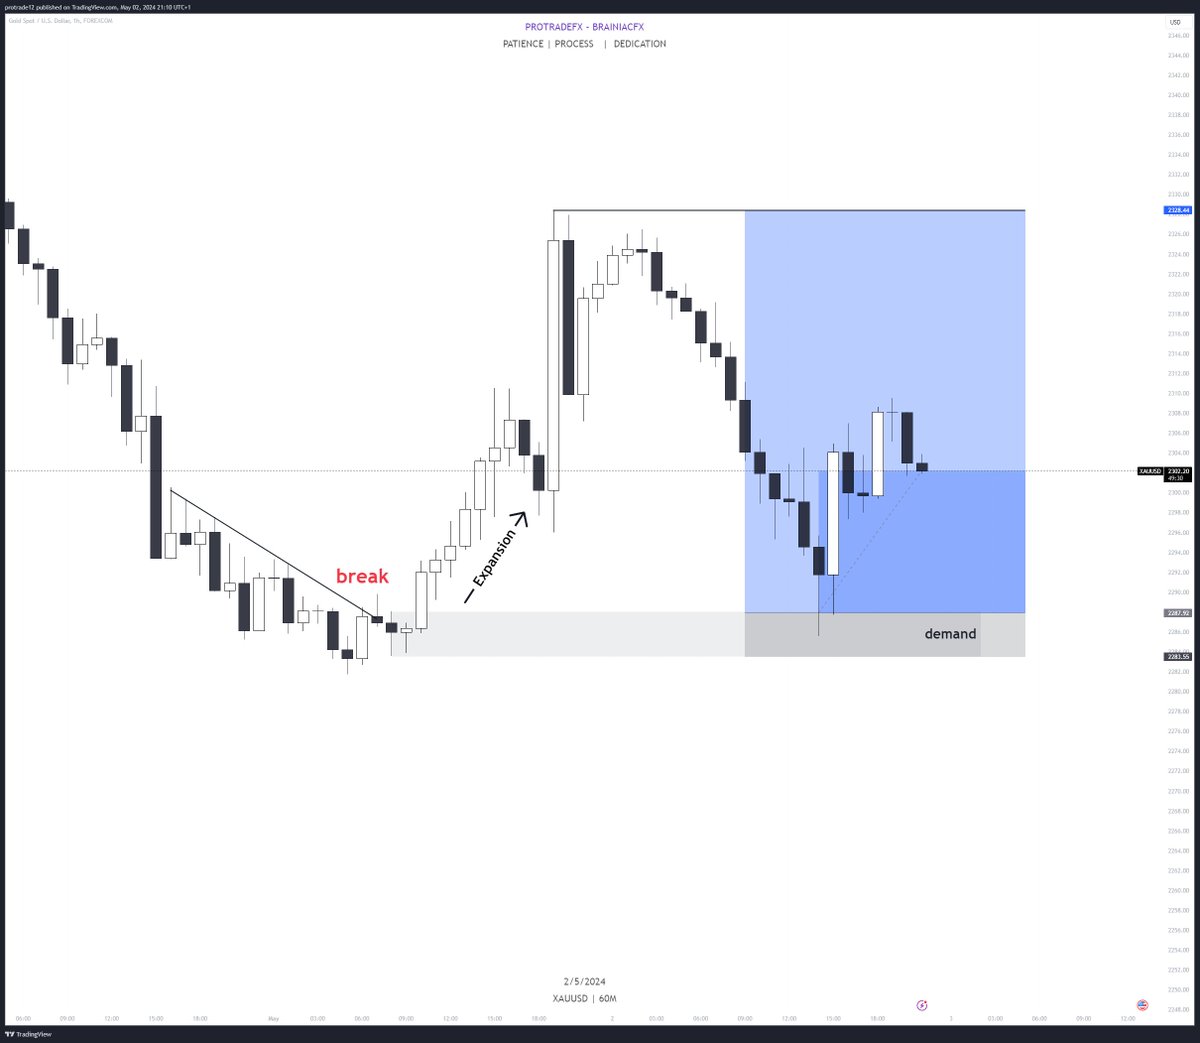
From these thread, you notice we could also share the same bias with retail traders not necessarily get into trades like them. The major difference between both is execution. Notice how retail might execute the buy directly from the retest of the trendline?
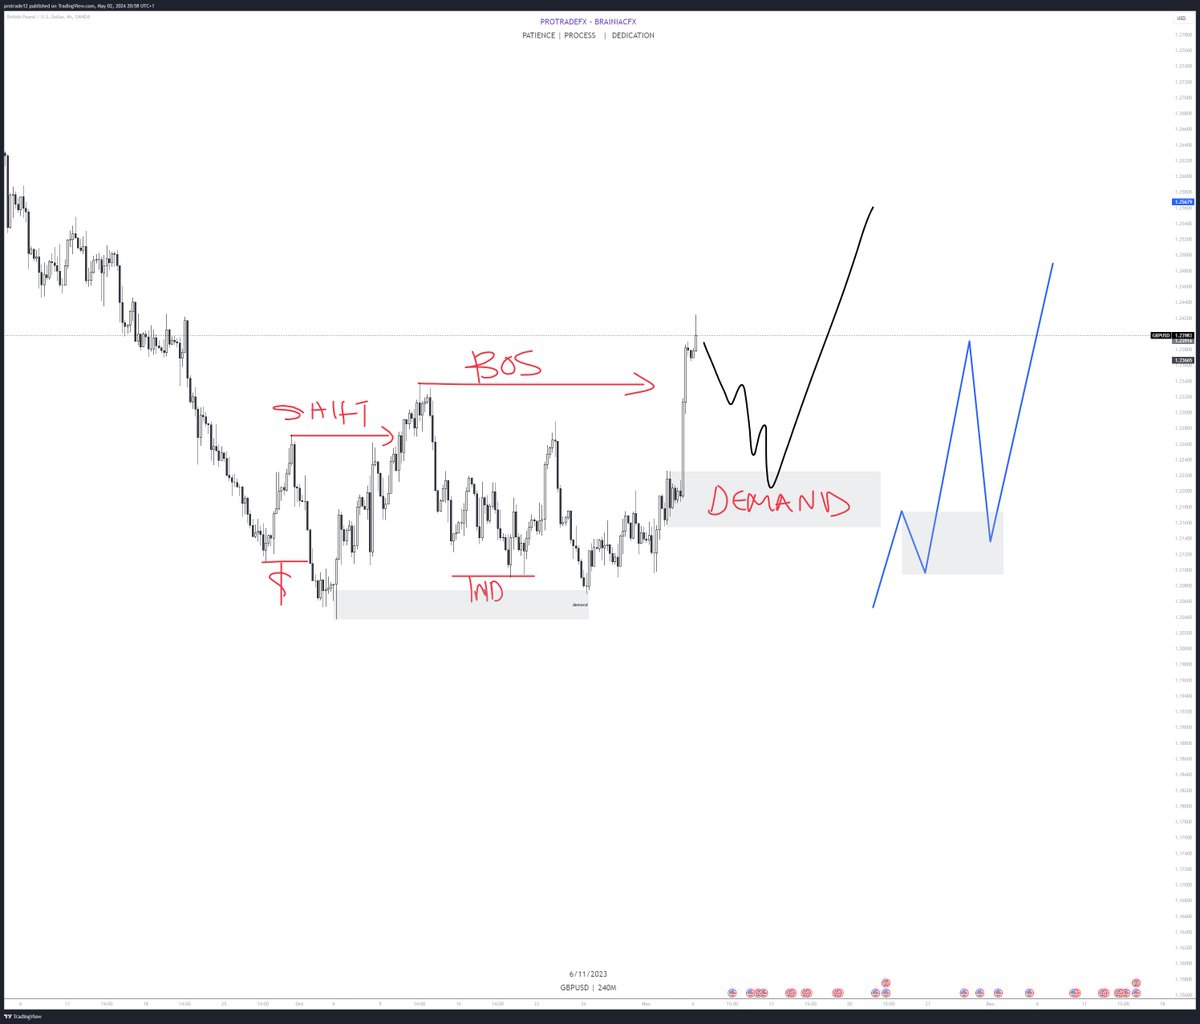
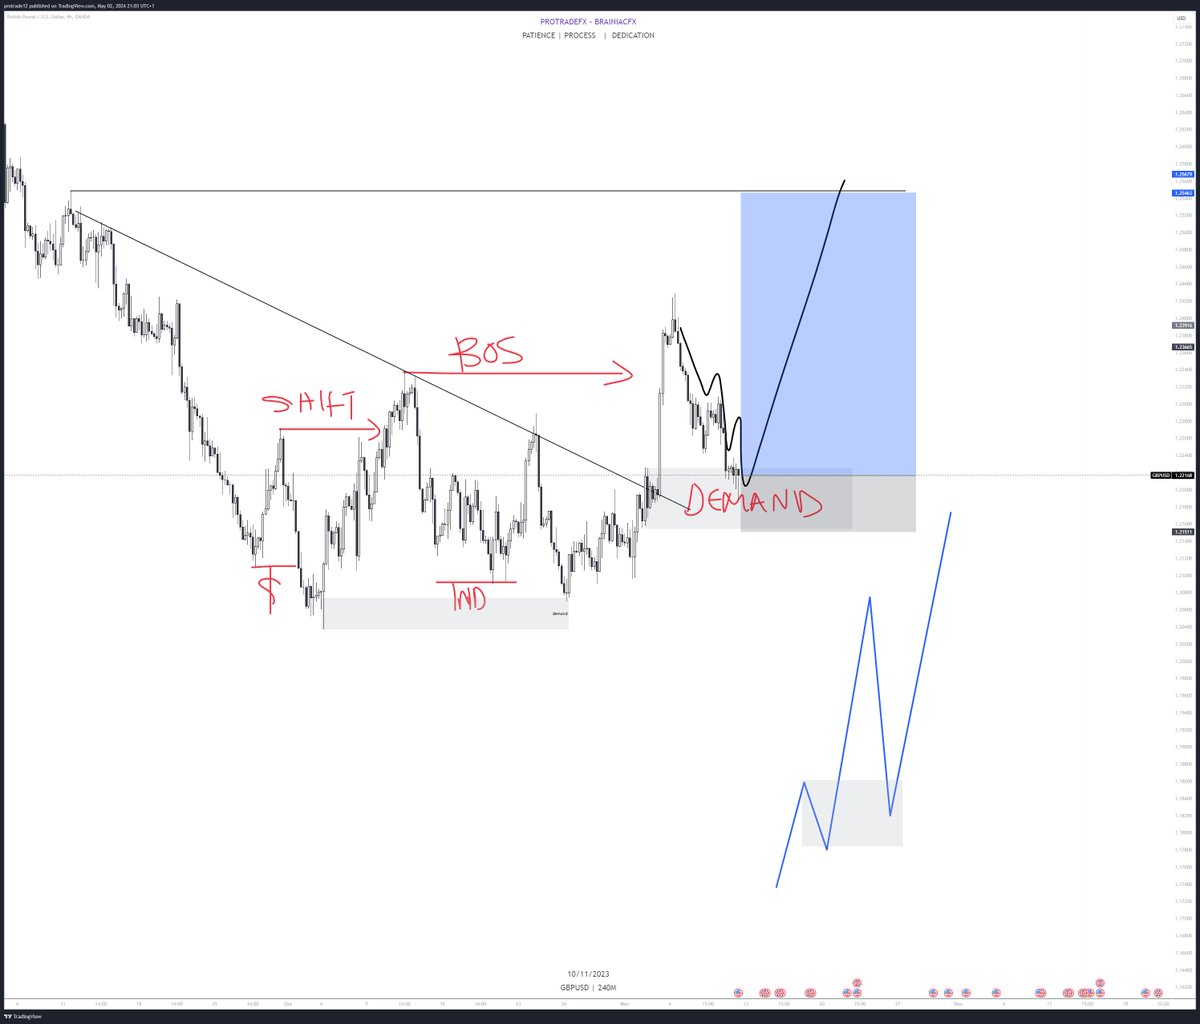
What we do is wait for EXPANSION to happen and a structure break to be clearly seen. Then we execute from the last Range that caused the break and also retest the trendline as shown in the chart below
Now let us use the same model on Gold chart that I took today
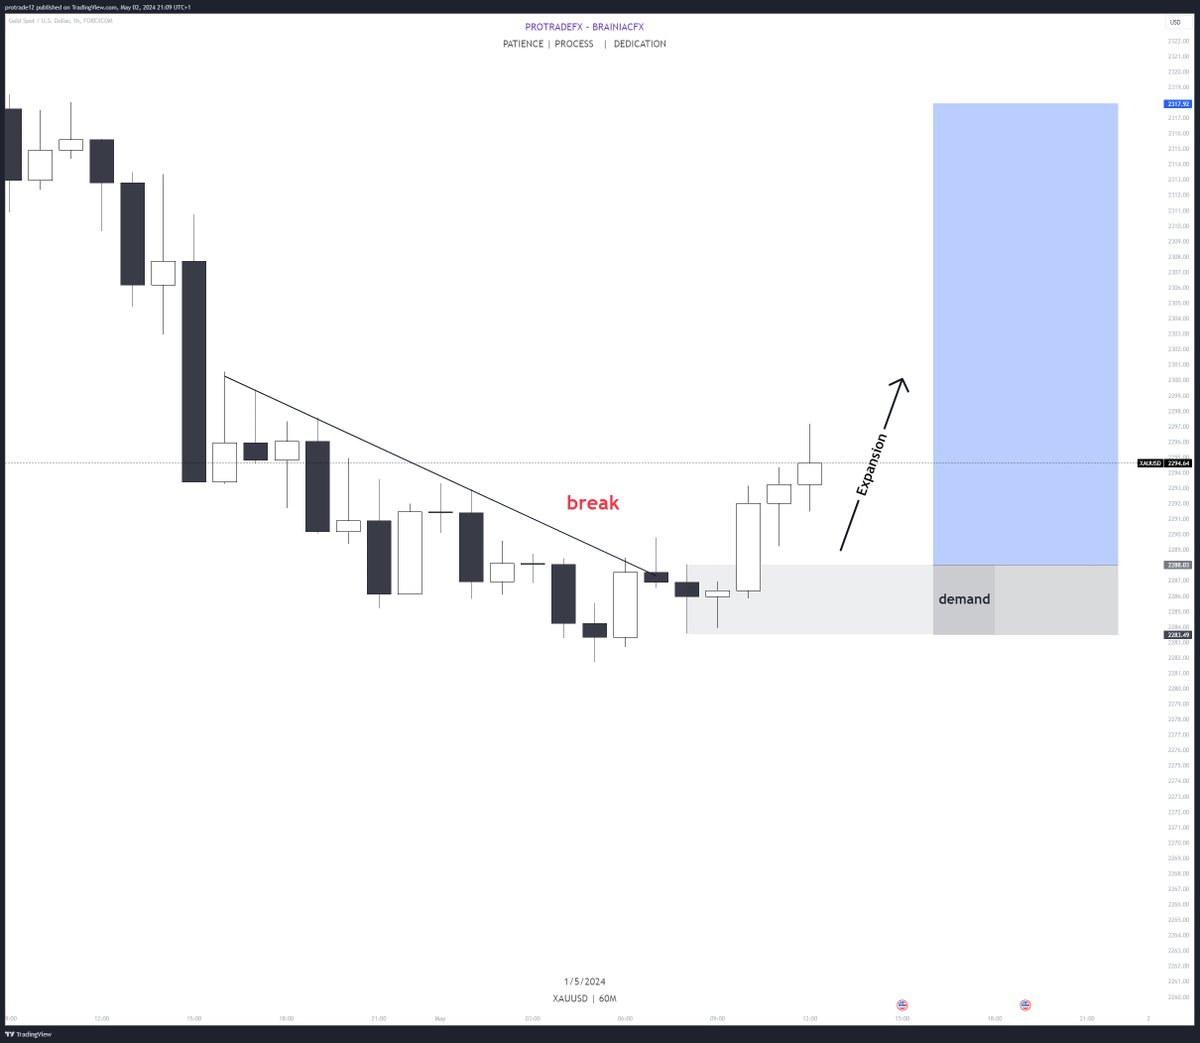
Seen how easy, simple and clean this model is? You are not confused either it is a buy or sell but just patiently waiting for the expansion. And also not confuse of whether to use body of the candle or wick of the candle as break.
This is case one approach and it is simplified to help traders who are coming from retail trading to SMC. Practice this and see if it might make a difference in your trading. If this thread is resourceful kindly comment CASE 2. Like, Follow and repost.
Loading suggestions...