

🍿The CLIMAX of the Blockbuster - How to Spot the Probable End of a Massive Rally🍿
Sometimes we enter a Trade and the stock bursts into a Dream rally of 40-50-60-70 or even 80% moves in just a few days.
The biggest dilemma though is, when to exit most of our positions. I have already talked about Exits time and again, but in my opinion, Exits still is the most underrated and under-discussed topic in Trading.
Today, we will discuss about a major sign that the dream run of a particular stock might be coming to an end ((at least for few weeks to few months)
Your Like❤️& Repost🔁 will really boost my confidence and motivate me to Write more
Let's get started then...
The Unusual Suspect:
While a stock goes into a frenzy of buying, we often forget to be cautious and put our guard down.
Then comes a harmless looking candle which might seem like a normal reaction of the stock (pullback) but remember, protecting our profit is as important as protecting our capital.
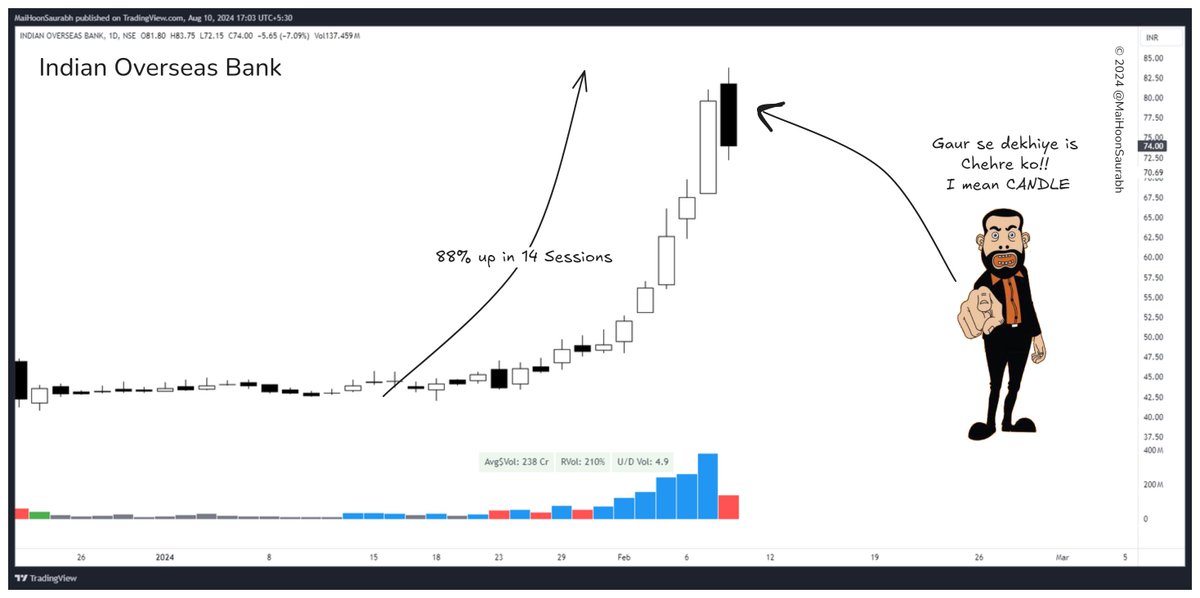
Pay attention to this chart now 👇
#IOB rallied a massive 88% in just 14 sessions. 😲
Then comes another Gap up but the gap didn't sustain and closed even below Previous Day's high.
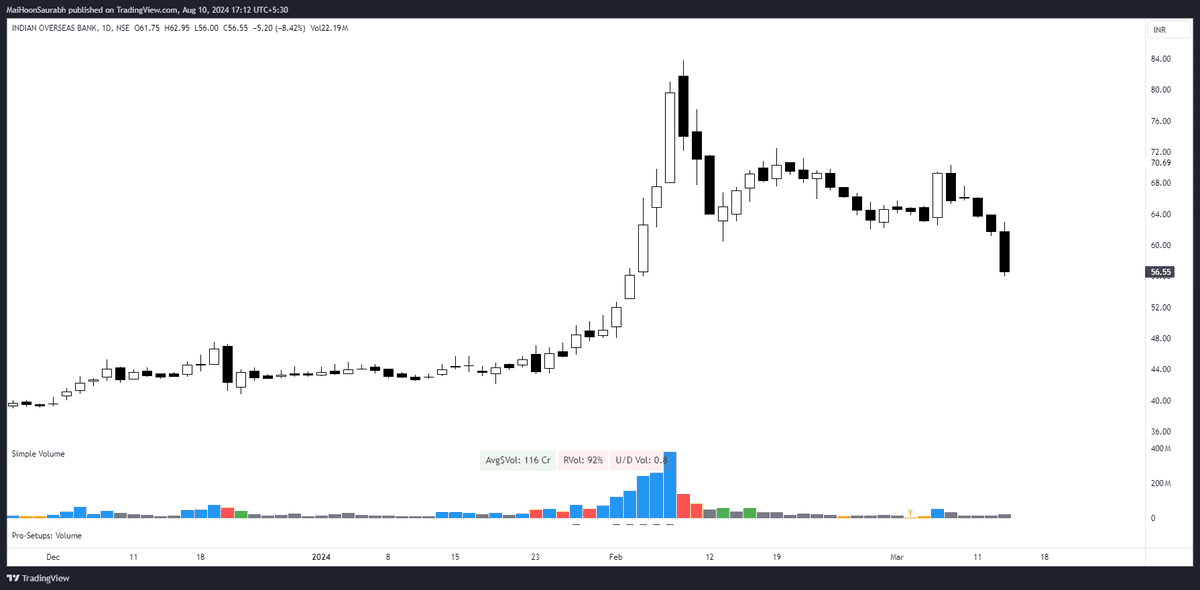
Let's see what happened after this candle:
Let me show you just 1 more example before I list down the points to observe.
While a stock goes into a frenzy of buying, we often forget to be cautious and put our guard down.
Then comes a harmless looking candle which might seem like a normal reaction of the stock (pullback) but remember, protecting our profit is as important as protecting our capital.
Pay attention to this chart now 👇
#IOB rallied a massive 88% in just 14 sessions. 😲
Then comes another Gap up but the gap didn't sustain and closed even below Previous Day's high.
Let's see what happened after this candle:
Let me show you just 1 more example before I list down the points to observe.
The Unusual Suspect #2:
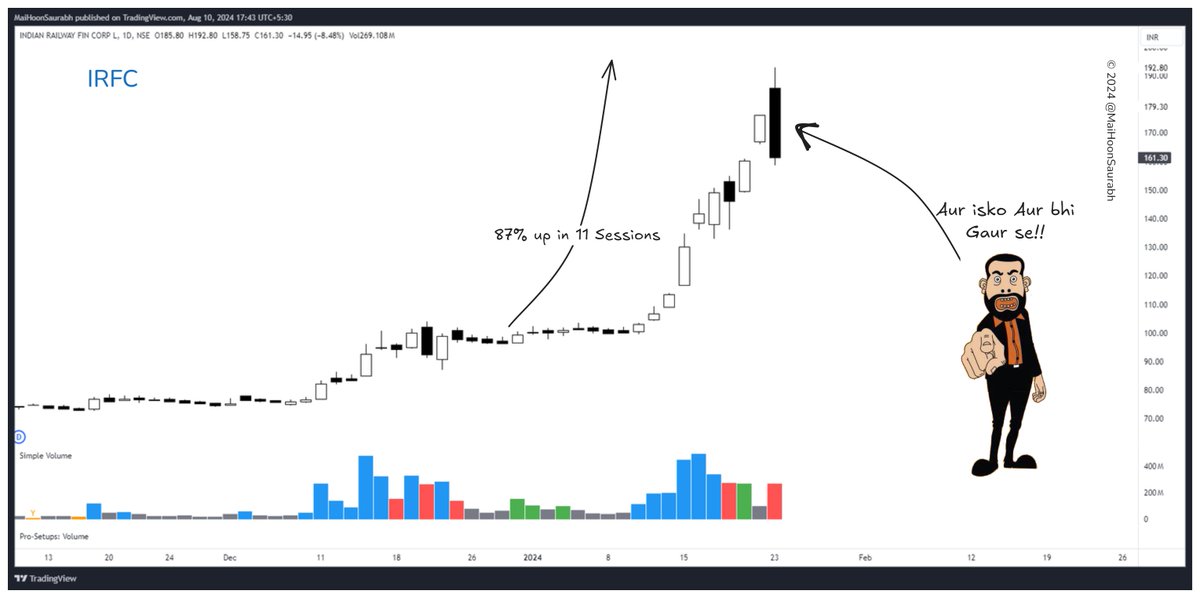
#IRFC moved a massive 87% in just 11 sessions, Wow!! We already discussed how we could have caught this move (in yesterday's thread).
Let's now focus on how we could have attempted to sell most of our position at the Top. 🗻
Look at this Chart closely now:
Do we see any similarities between this Black candle and the Black candle from the previous one?
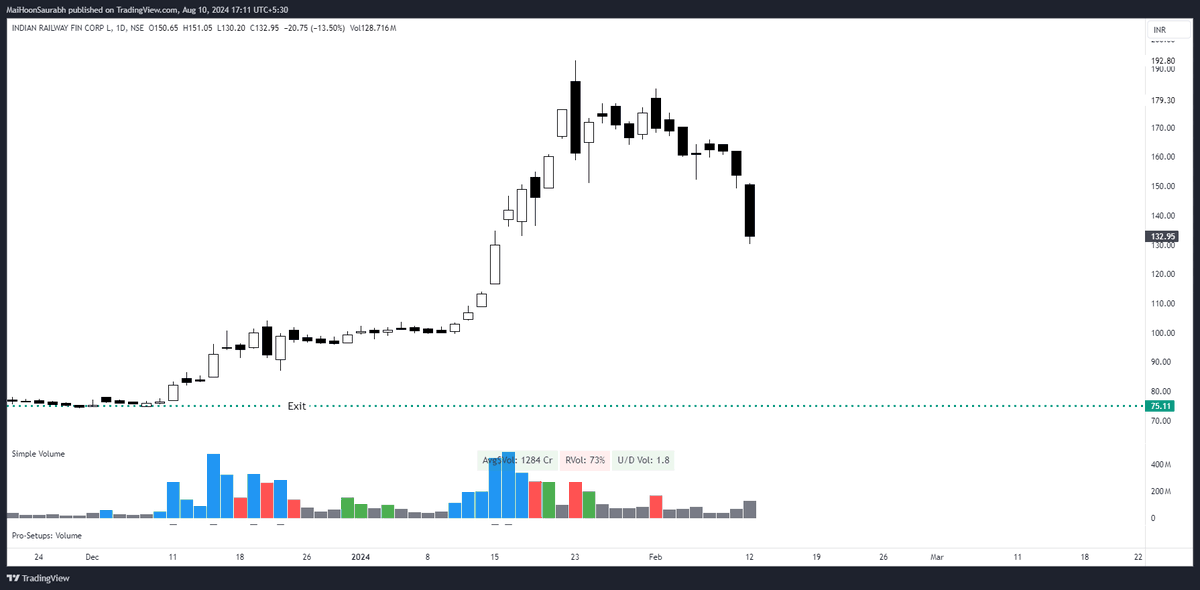
Look at what happened after this candle:
Awaken the Detective Inside of you:
Here are the commonalities you will see in most of the Climax Candles.
💎The Climax Candle usually gap up at the top of a massive rally but could sustain the gap.
💎The Climax Candle usually makes a Big Bodied negative Candle (Black Candle in my chart)
💎The previous candle might have the Highest Volumes in this upmove.
💎It will be trustworthy only when it occurs after a vertical move
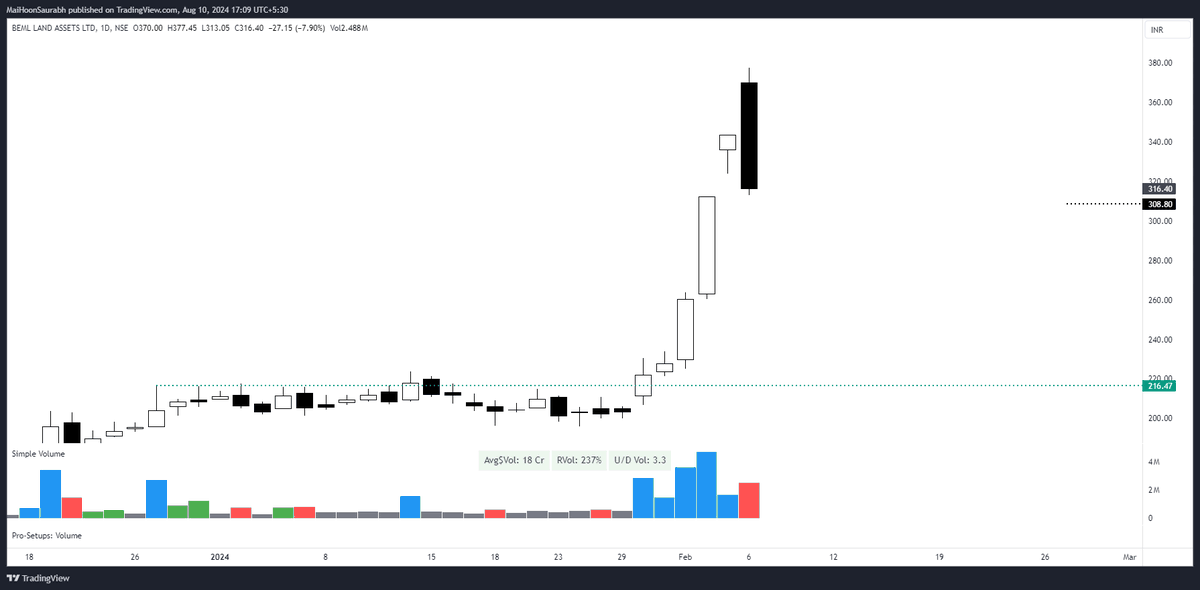
The Detective's First Case:
Now, you know the rules, let's have one more Example, so you can actually observe this chart with the learning you just acquired and test the knowledge.
Was it:
A Gap up? ✅
Big Bodies Negative Candle? ✅
Previous candle with Highest Volume? ❌ But...
The 2nd last Candle had the Highest Volume
Was it after a Vertical Move? ✅
Dekhein kya hua??
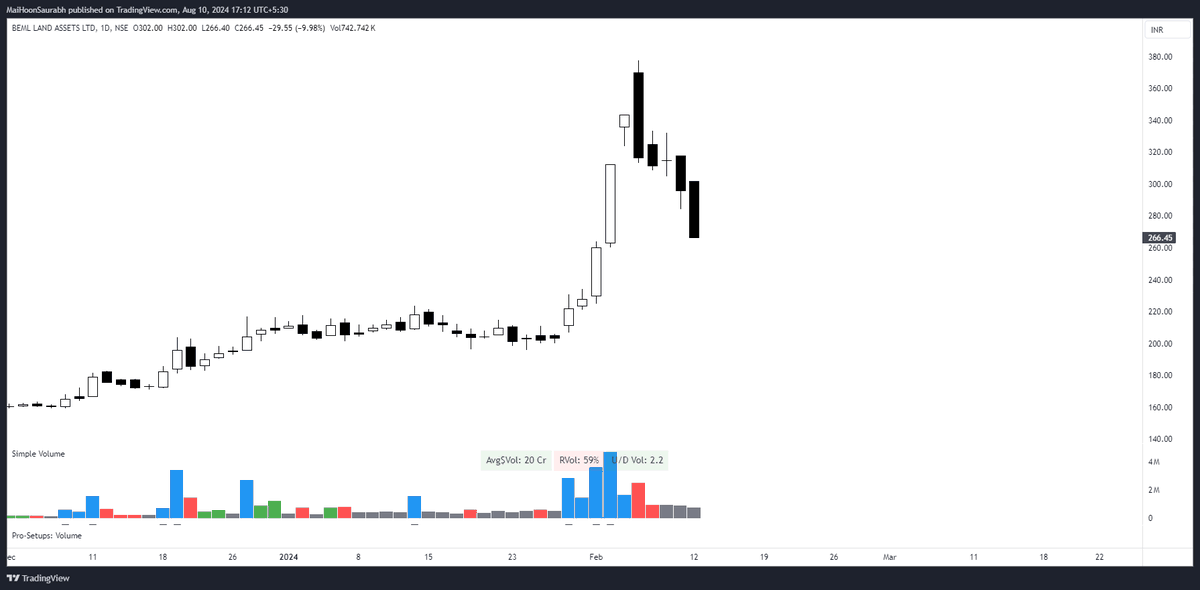
Homework:
Go back in time and find me a chart where you see a Climax candle.
Do list the things you observe as well.
All the Best!! 👍
Go back in time and find me a chart where you see a Climax candle.
Do list the things you observe as well.
All the Best!! 👍
If you have any doubts, ask them in the comments below, I'll try to answer each query.
If you genuinely got to learn something and want me to continue writing such posts, Repost🔁 the post below to help me reach More Learners like you.
x.com
If you genuinely got to learn something and want me to continue writing such posts, Repost🔁 the post below to help me reach More Learners like you.
x.com
Loading suggestions...