

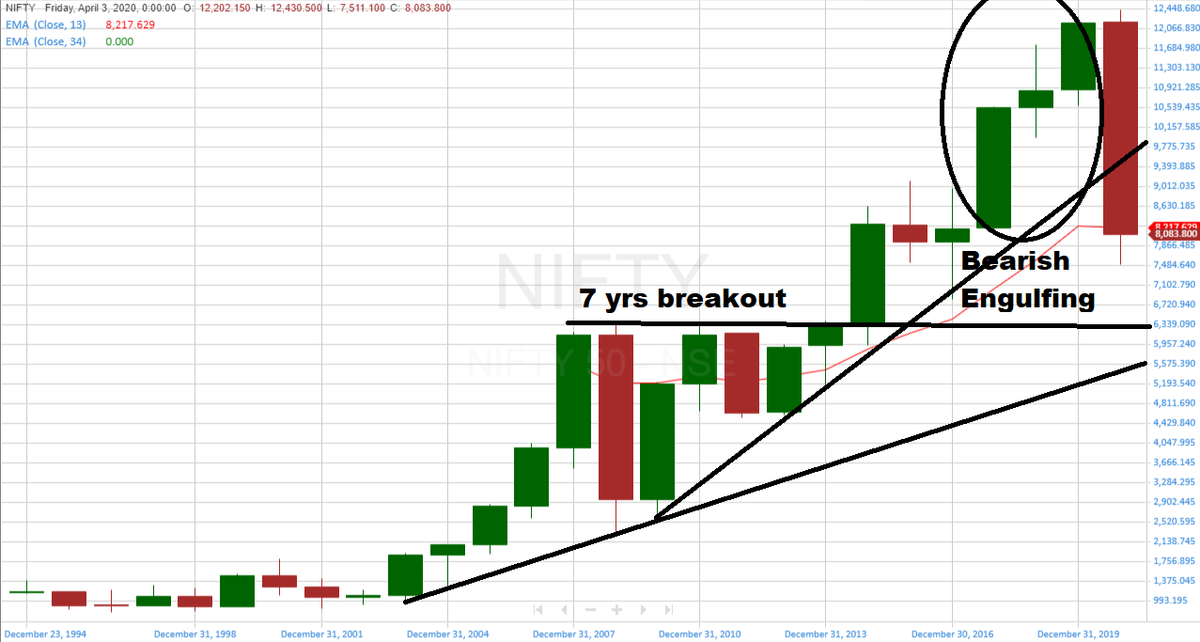
3. now start bifurcating it in smaller parts to get clear picture and historical evidences !!
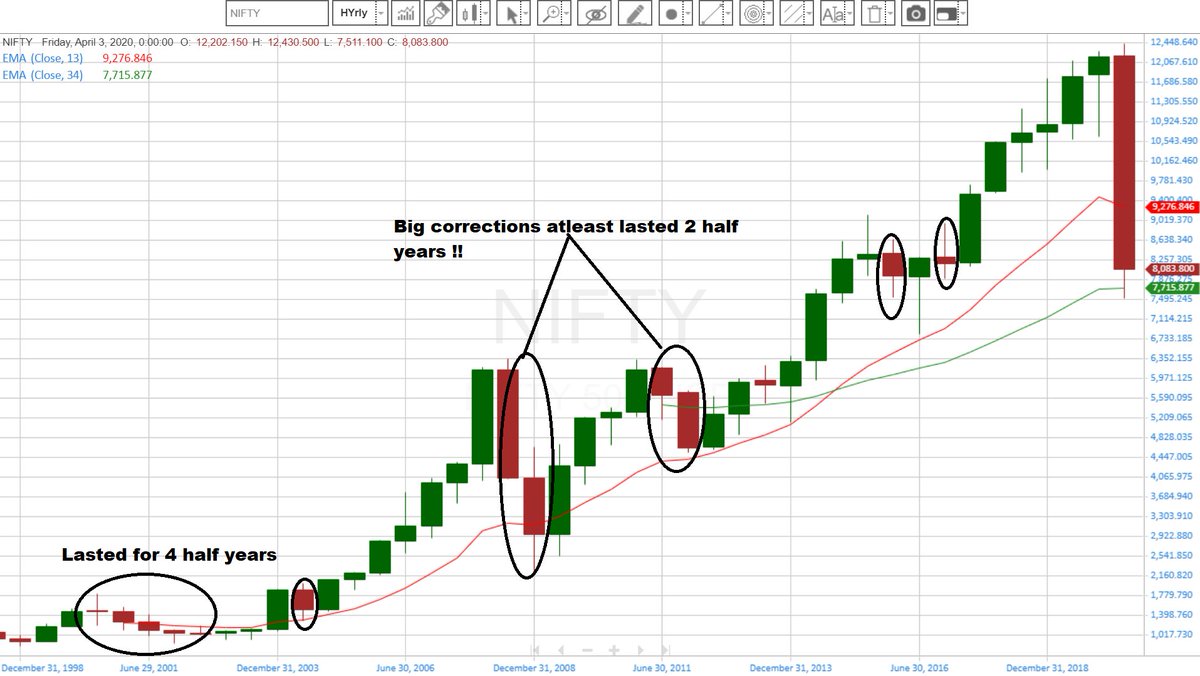
4. Chart taken for half year i.e year divided in 2 parts
everything mentioned on chart self explanatory
2/n
4. Chart taken for half year i.e year divided in 2 parts
everything mentioned on chart self explanatory
2/n
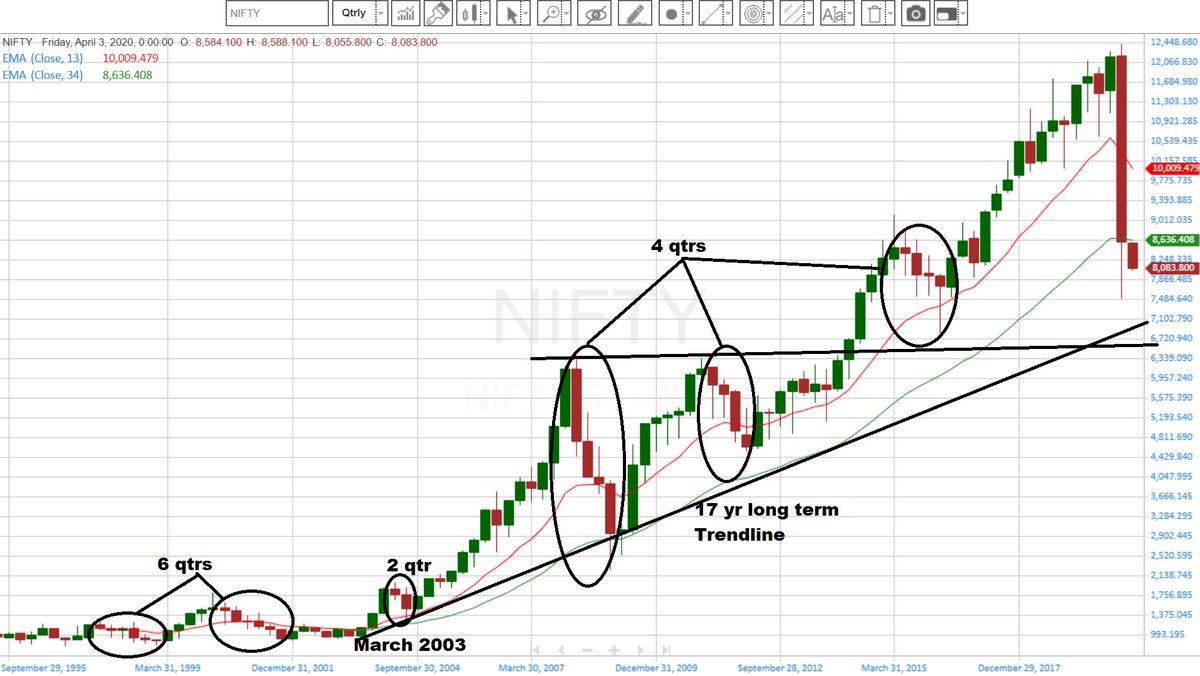
5. shifting to a quarterly chart
3/n
3/n
then shift to normal monthly weekly daily
Entry on weekly / daily chart
if all TF confirms each other that's best set up
let all TF whichever b in confirmtion with next higher TF
for ME EOD / weekly / Monthly is my TF
entry /exit based on 5 / 15 / 60 confirmation
4/4
Entry on weekly / daily chart
if all TF confirms each other that's best set up
let all TF whichever b in confirmtion with next higher TF
for ME EOD / weekly / Monthly is my TF
entry /exit based on 5 / 15 / 60 confirmation
4/4
Loading suggestions...