

A THREAD.
Mastering HORIZONTAL SUPPORT and RESISTANCE for Trading Bitcoin.
This is the most comprehensive real-world guide to Support and Resistance.
This is everything that you need to master it.
It’s an exhaustive guide, don’t read, STUDY IT.
Mastering HORIZONTAL SUPPORT and RESISTANCE for Trading Bitcoin.
This is the most comprehensive real-world guide to Support and Resistance.
This is everything that you need to master it.
It’s an exhaustive guide, don’t read, STUDY IT.
1. Introduction.
S/R must be the most under-rated tool in trading which isn't given enough time or attention by most beginners.
Many successful traders personally known to me rely solely on S/R. This should speak enough for its importance.
We will study the following
S/R must be the most under-rated tool in trading which isn't given enough time or attention by most beginners.
Many successful traders personally known to me rely solely on S/R. This should speak enough for its importance.
We will study the following
2. Focus of Study.
1 Understanding S/R
2 Identifying and drawing a valid S/R
3 Nature of S/R when it Breaks
4 Fake Breakout/Breakdown
5 Identifying entry/exit at S/R lines
6 How institutional traders stop out retail traders.
(Stop loss hunting)
7 High probability entry/exit
1 Understanding S/R
2 Identifying and drawing a valid S/R
3 Nature of S/R when it Breaks
4 Fake Breakout/Breakdown
5 Identifying entry/exit at S/R lines
6 How institutional traders stop out retail traders.
(Stop loss hunting)
7 High probability entry/exit
3. S/R can be categorized as
1 An area of supply/demand which acts as a probable
zone for entry/ exit
2 Trending support and resistance(Trend-lines)
3 Horizontal lines denoting a price of either support of resistance. We will be studying these horizontal lines in this thread
1 An area of supply/demand which acts as a probable
zone for entry/ exit
2 Trending support and resistance(Trend-lines)
3 Horizontal lines denoting a price of either support of resistance. We will be studying these horizontal lines in this thread
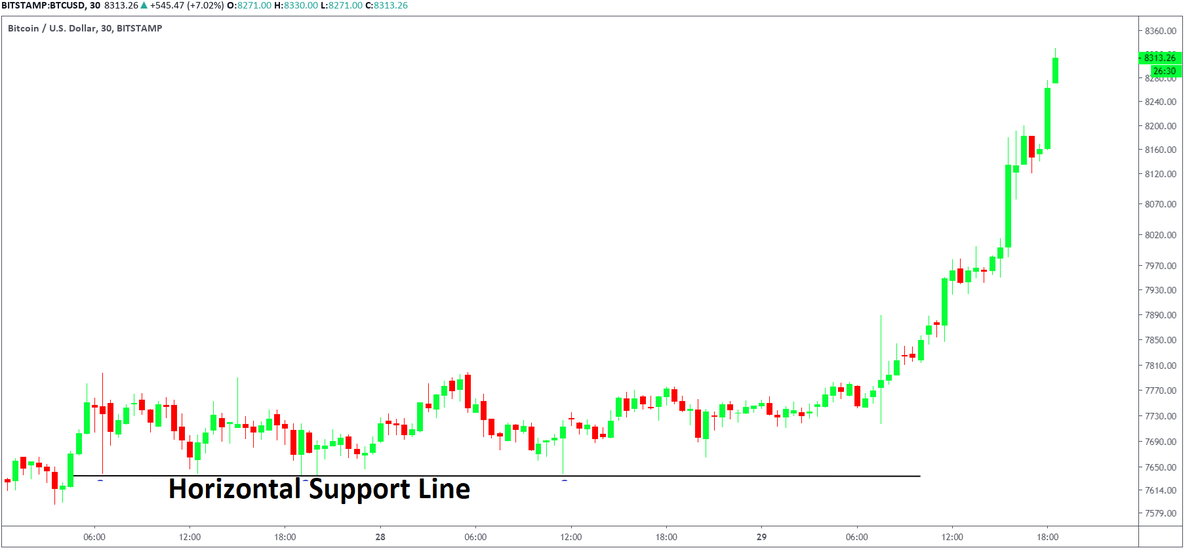
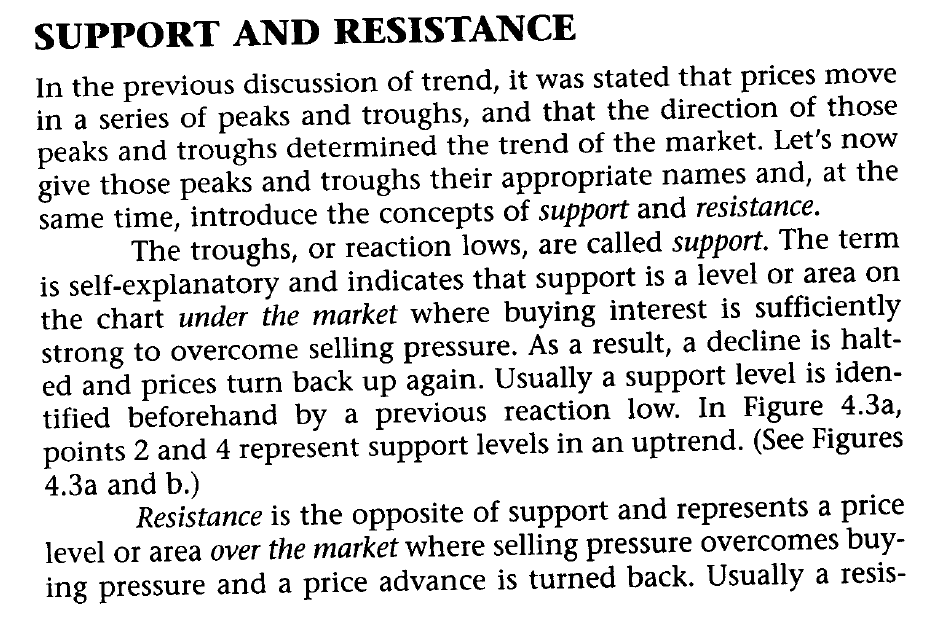
4. Definition.
A support line indicates a price where the buying pressure is more than the selling pressure, acting as a base for an upward bounce of price.
To elaborate, the demand is greater than the supply at these levels hence an upward move in price is generally probable.
A support line indicates a price where the buying pressure is more than the selling pressure, acting as a base for an upward bounce of price.
To elaborate, the demand is greater than the supply at these levels hence an upward move in price is generally probable.
5. Drawing a support line.
A good starting point is to zoom out on the time frame that you're trading and try to touch as many lower points as logically possible.
The support should be easily visible upon minor observation and you shouldn't have to hunt or look hard for them.
A good starting point is to zoom out on the time frame that you're trading and try to touch as many lower points as logically possible.
The support should be easily visible upon minor observation and you shouldn't have to hunt or look hard for them.
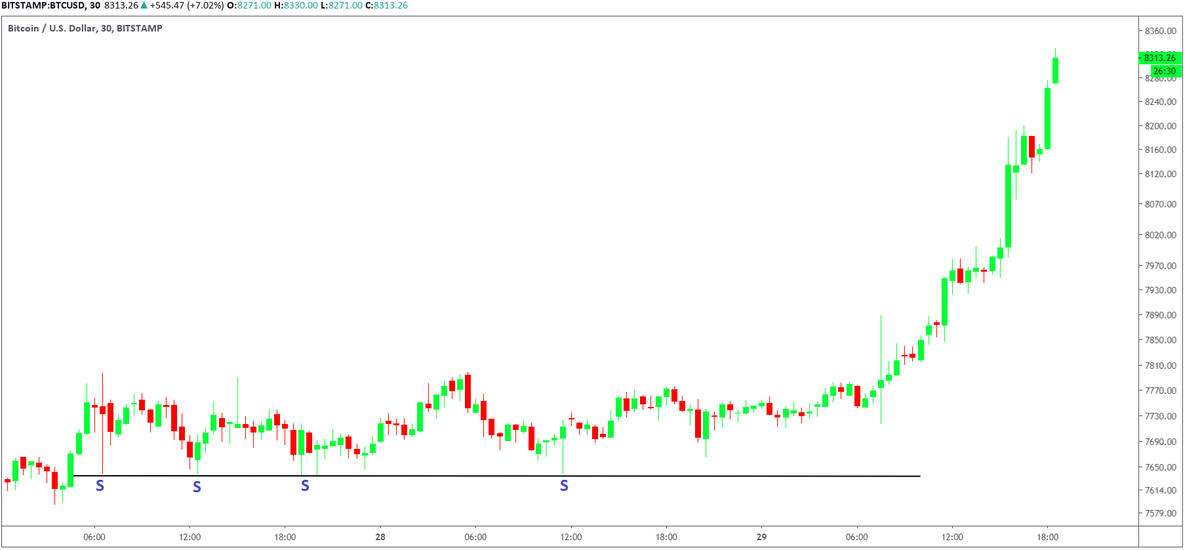
6.Comment -
It’s practically acceptable if the support line crosses a candle/wick or doesn't touch the wick or only touches the wick.
The support line doesn’t have to be perfectly aligned.
We are mostly looking for zones rather than a perfect straight price line.
It’s practically acceptable if the support line crosses a candle/wick or doesn't touch the wick or only touches the wick.
The support line doesn’t have to be perfectly aligned.
We are mostly looking for zones rather than a perfect straight price line.
7. The examples below illustrate the support line overlapping with candles and wicks or not perfectly touching the candles. In both these examples, the support line is valid.
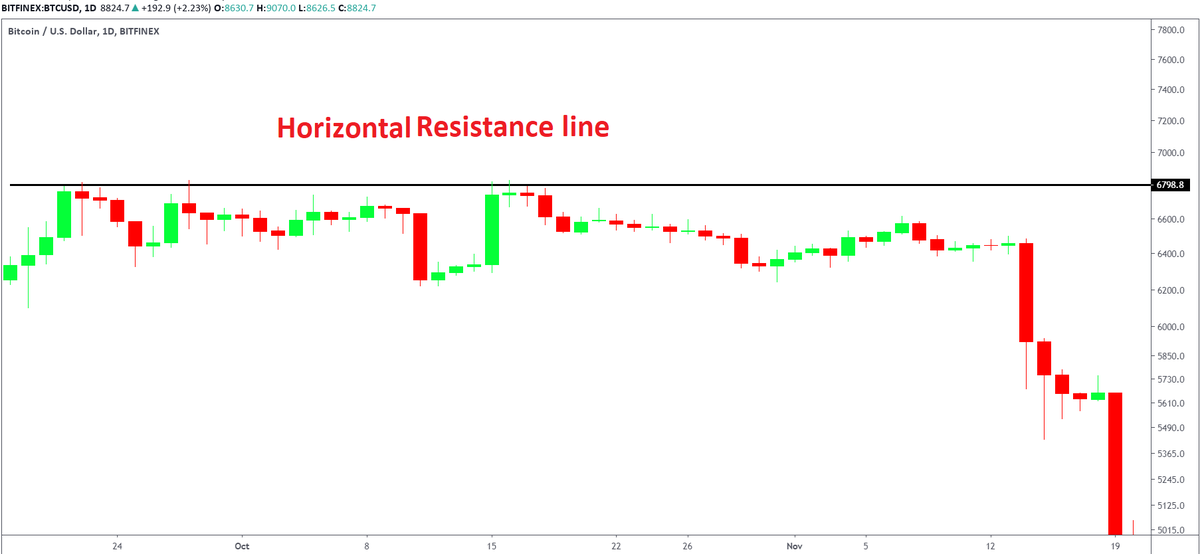
8. Resistance
Resistance line indicates the price where the selling pressure is higher than the buying pressure.
To elaborate, the supply is greater than the demand which pulls the price lower.
There’s a good probability of price retracing from this price line.
Resistance line indicates the price where the selling pressure is higher than the buying pressure.
To elaborate, the supply is greater than the demand which pulls the price lower.
There’s a good probability of price retracing from this price line.
9. Just like support line, zooming out on the time frame that you're trading and try to touch as many high points.
The resistance should be easily visible upon observation and you shouldn't have to hunt or look hard for them.
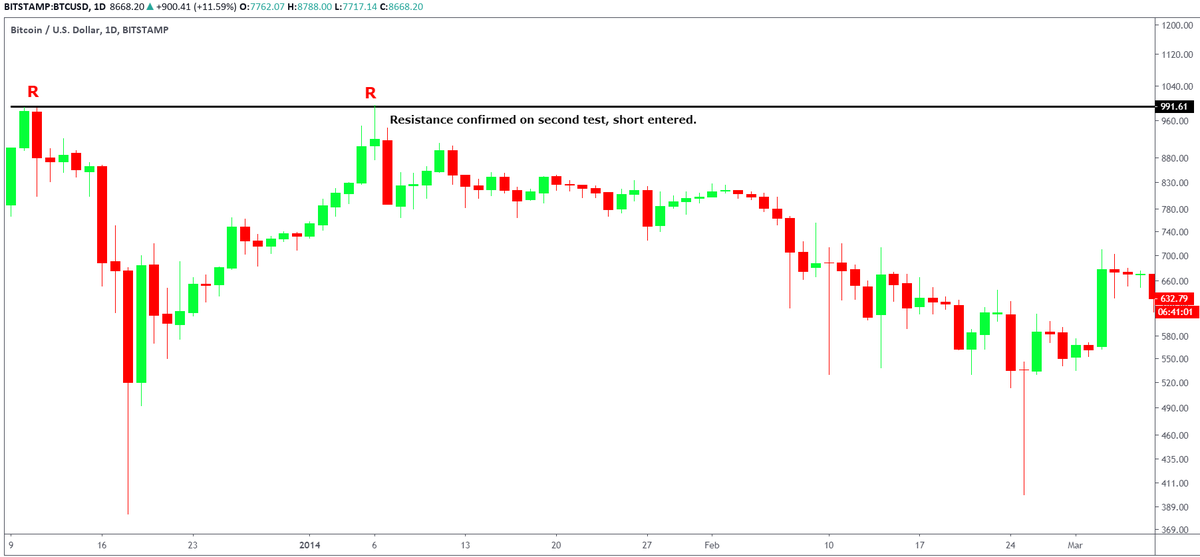
Examples of Resistance lines below.
The resistance should be easily visible upon observation and you shouldn't have to hunt or look hard for them.
Examples of Resistance lines below.
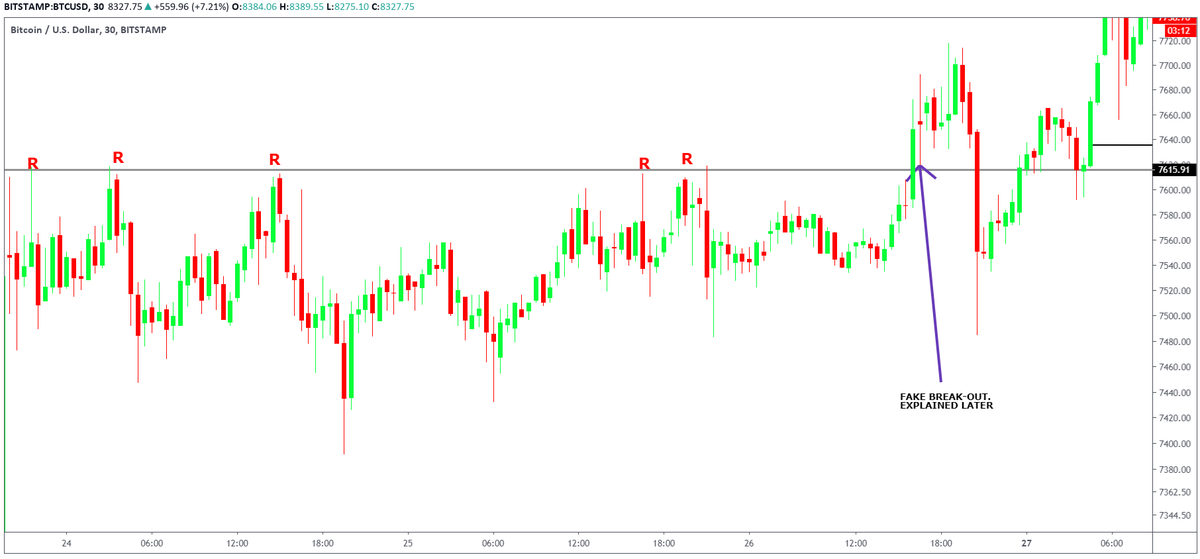
10. Observation-
The chart above also shows a vital concept of fake-breakout, breakout, retrace and confirmation. It will be explained later in detail.
The chart above also shows a vital concept of fake-breakout, breakout, retrace and confirmation. It will be explained later in detail.
11. Understanding Breakdown and Breakouts
A Breakout occurs when the resistance line is tested several times, leading to an increased demand in that price zone.
This increase of demand leads to a breakout.
Opinion- The more times a resistance is tested, the weaker it becomes.
A Breakout occurs when the resistance line is tested several times, leading to an increased demand in that price zone.
This increase of demand leads to a breakout.
Opinion- The more times a resistance is tested, the weaker it becomes.
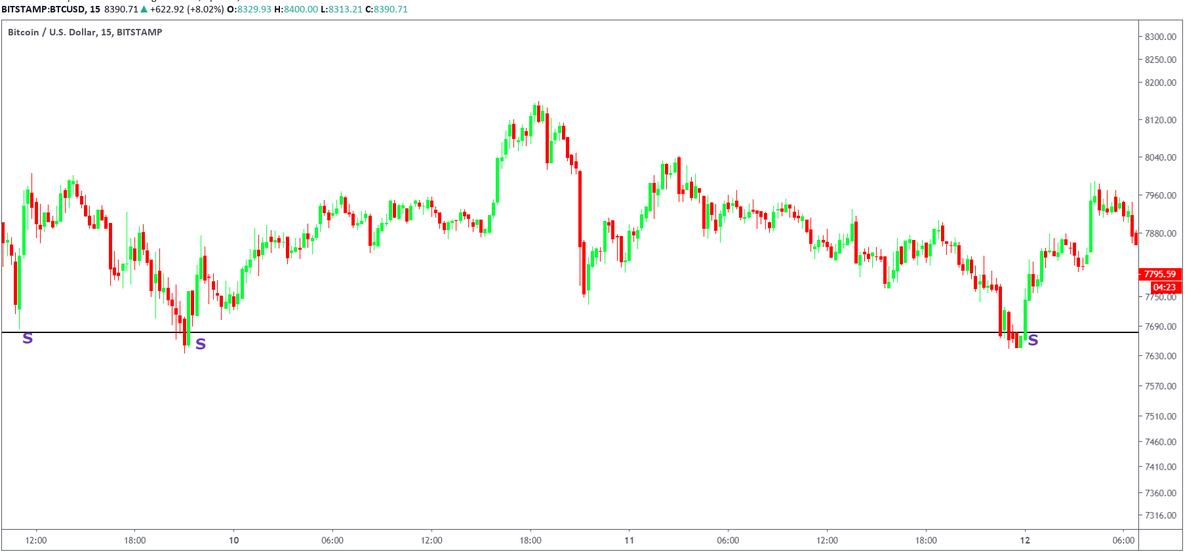
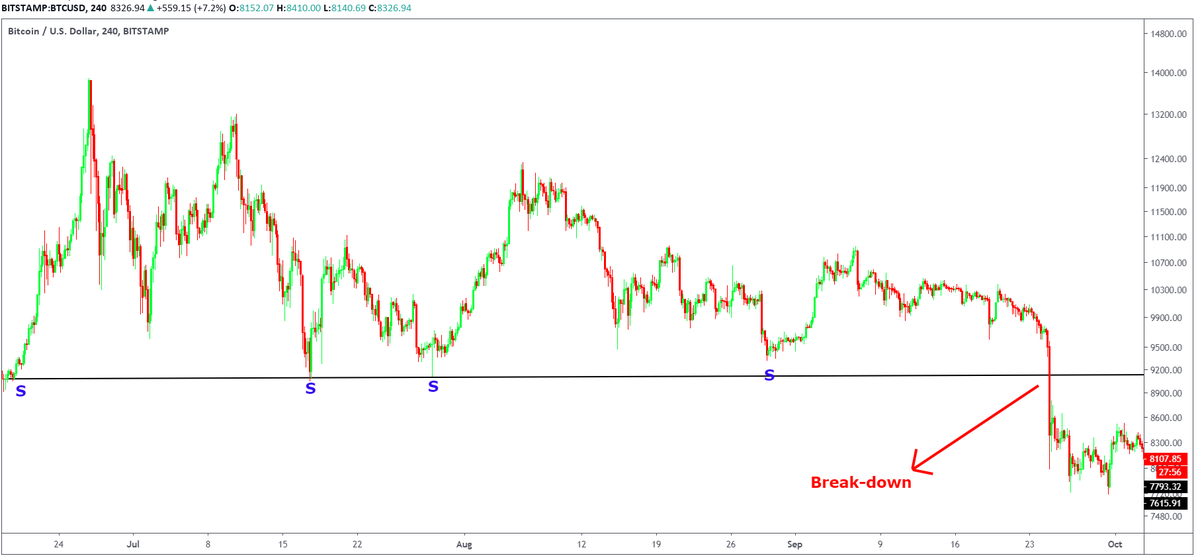
12 .Breakdown- It is when the support zone is tested too many times, leading to an increase is supply at that price point, which leads to lowering of price i.e. Breakdown. PIC
Opinion.
The more times we test a support, the weaker it becomes.
See pic Below
Opinion.
The more times we test a support, the weaker it becomes.
See pic Below
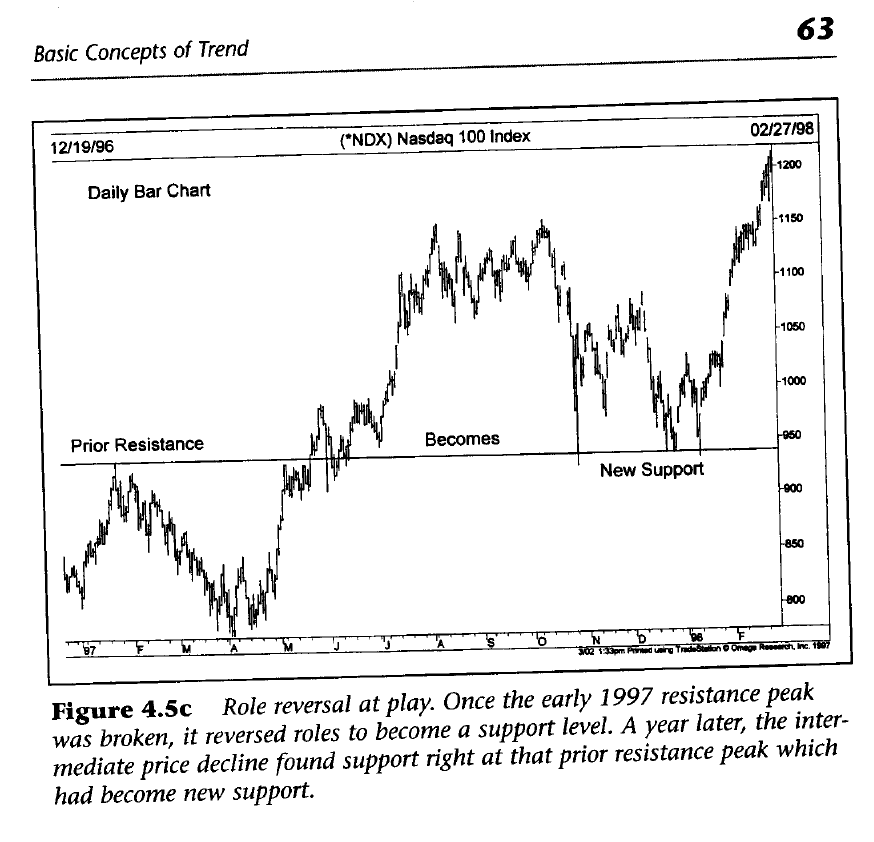
13. What happens if a Support or Resistance line breaks?
They start acting in the opposite nature.
A support line becomes a resistance and a resistance becomes a support.
This above concept is of utmost importance in understanding and confirming a TREND.
They start acting in the opposite nature.
A support line becomes a resistance and a resistance becomes a support.
This above concept is of utmost importance in understanding and confirming a TREND.
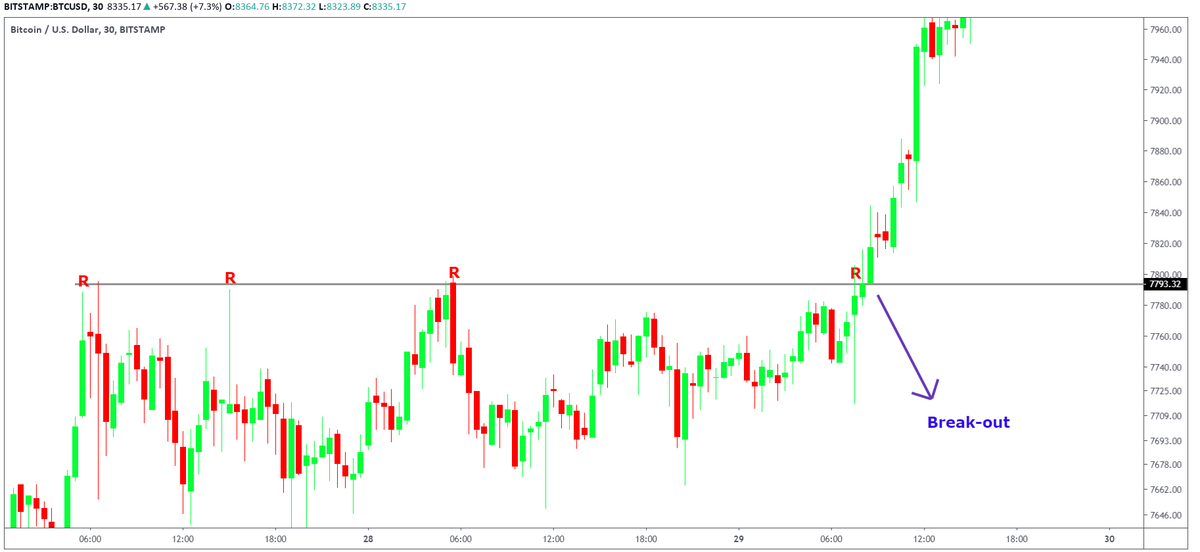
14. Resistance lines, when crossed, become new support, and the cycle repeats until the trend breaks. PIC
Study this chart carefully to see how Resistance level 1, when broken at 2, after formation of a new resistance at 3, becomes a new support at 4.
Study this chart carefully to see how Resistance level 1, when broken at 2, after formation of a new resistance at 3, becomes a new support at 4.
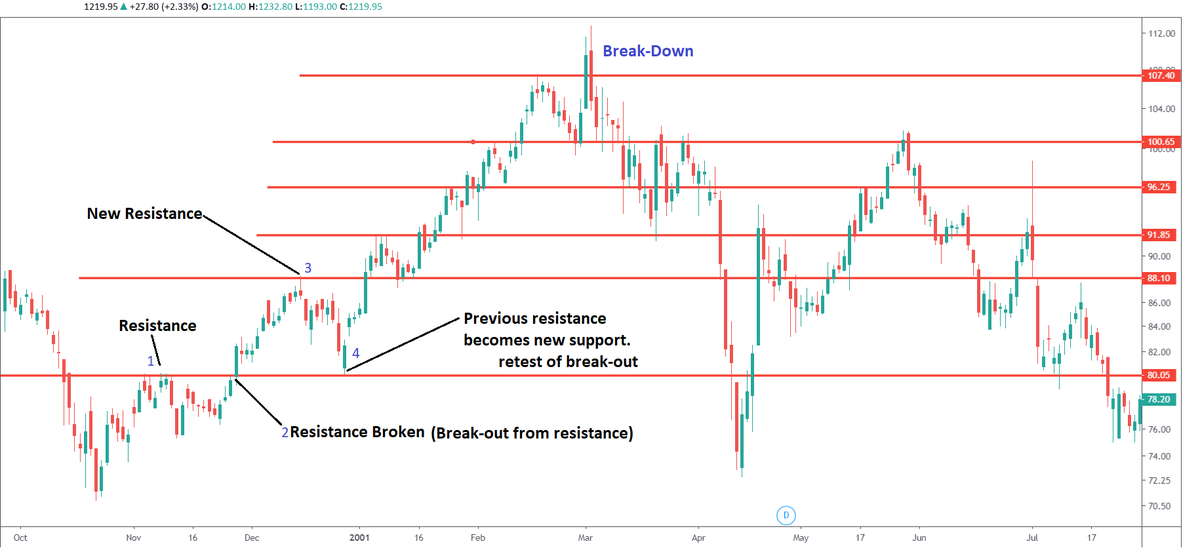
15. This cycle continuous till the breakdown. Take some time to understand the above graph.
16. Uses of Support and resistance.
Intuitively the use of the support line would be to enter a long when the prices bounces off the support line and that of the resistance line would be to go short when the price pulls back from resistance.
Intuitively the use of the support line would be to enter a long when the prices bounces off the support line and that of the resistance line would be to go short when the price pulls back from resistance.
17. However, real world trading isn’t this simple and the above usage needs understanding of the following
Breakouts, Break-down
Fake Breakdown/Breakout
Re-tests
Confirmations
Stop-loss hunting
These are explained below
Breakouts, Break-down
Fake Breakdown/Breakout
Re-tests
Confirmations
Stop-loss hunting
These are explained below
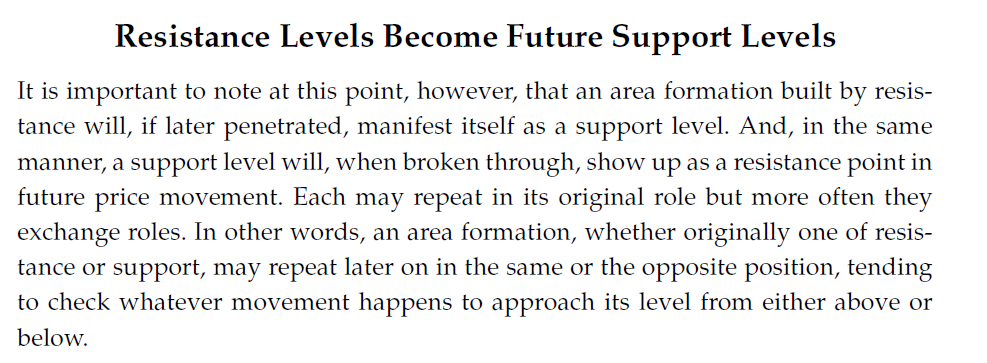
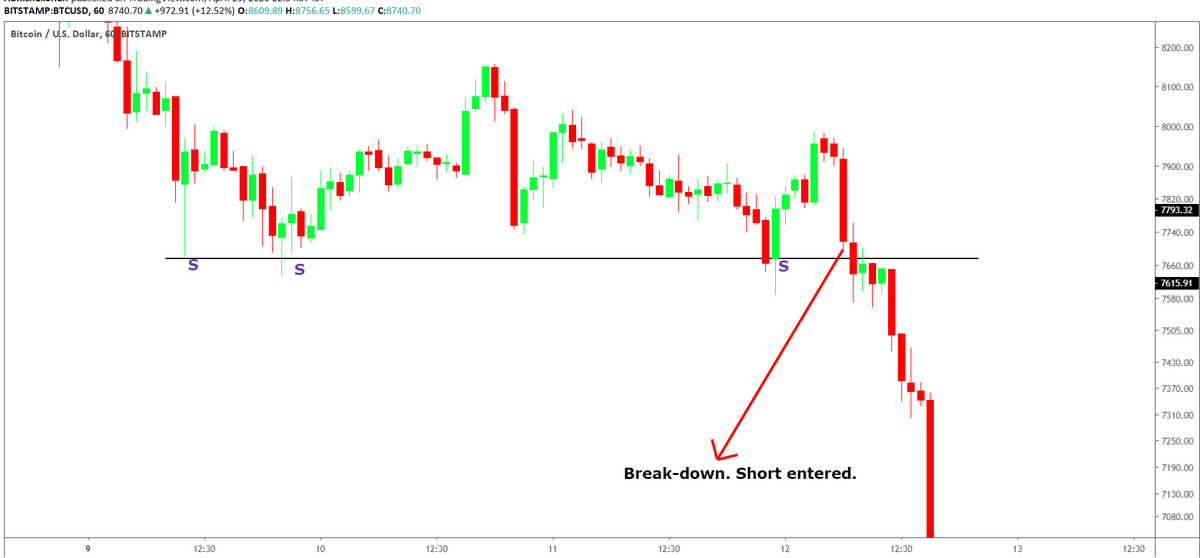
The exact opposite is true for breakdown, which leads to a big pullback in price. Short at the break-down.
See pic below for Break-out and Break-Down
See pic below for Break-out and Break-Down
19. Advanced uses of Support and resistance in determining high probability entry.
Below I illustrate the advanced practices used by seasoned traders to determine high probability entries for profits.
However, they are easy to understand upon a repeated reading.
Below I illustrate the advanced practices used by seasoned traders to determine high probability entries for profits.
However, they are easy to understand upon a repeated reading.
21.Institutional traders stop out BOTH Long and Short retail traders, at the same time, at a similar price zone. A very common problem that retail traders face is being stopped out. Let us understand stop loss hunting in detail.
22. Short hunting at resistance
The red line denotes the resistance line.
At Point A, few retail traders will short it thinking that the price will go down at the resistance.
But the price has a small breakout out. Triggering the stop loss of the people who went short.
The red line denotes the resistance line.
At Point A, few retail traders will short it thinking that the price will go down at the resistance.
But the price has a small breakout out. Triggering the stop loss of the people who went short.
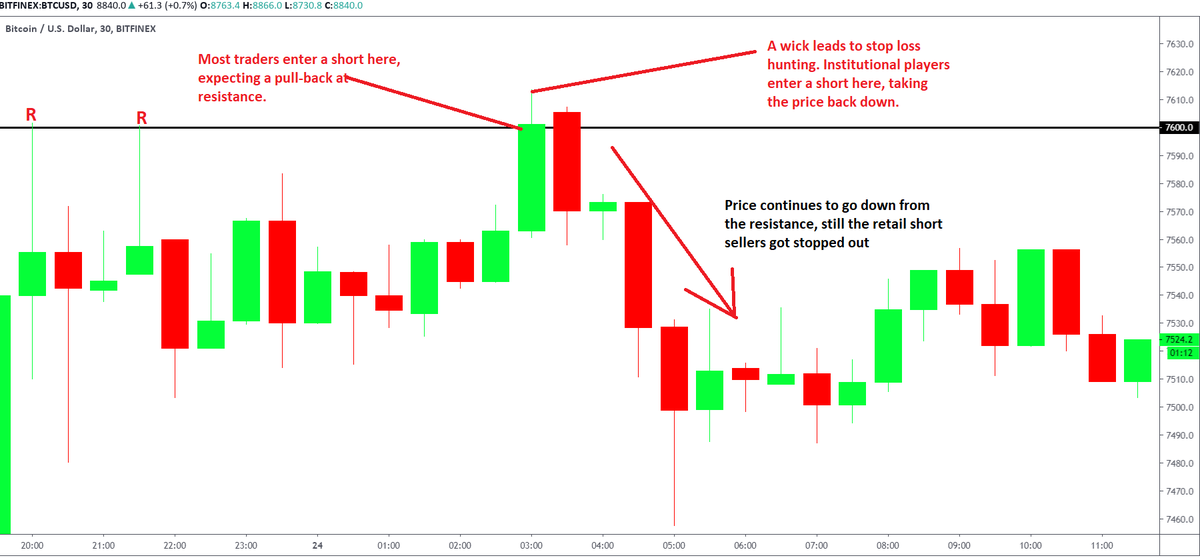
23. This is a fake out as the price then reverses at the resistance. Even though the price goes down, the stop loss gets hit. Here the trader loses money even after being right. This is short hunting.
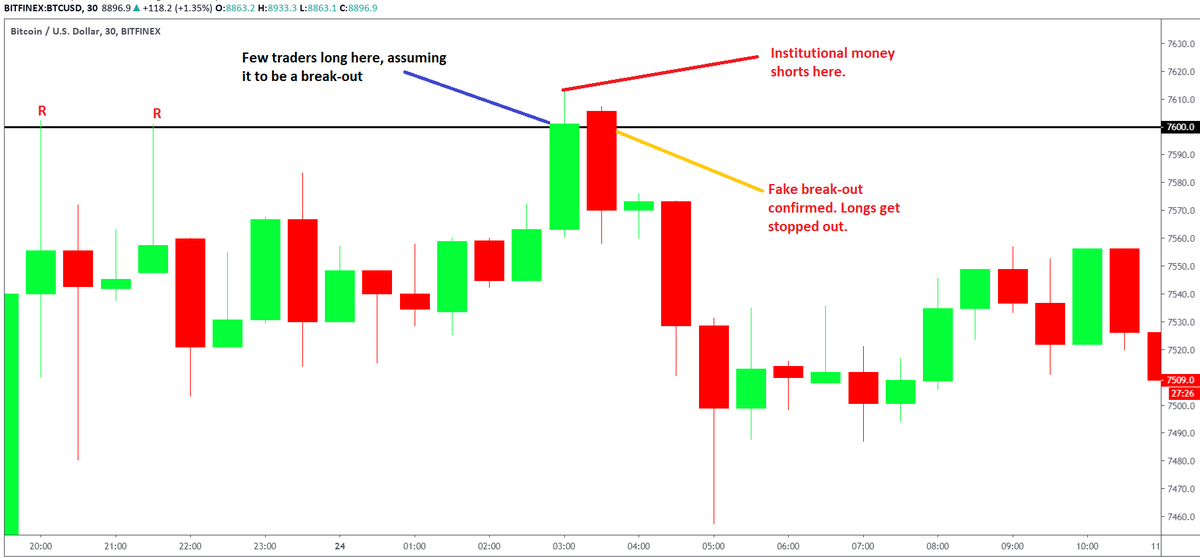
24. With the same chart, we will study long hunting at the resistance.
The wick crosses above the resistance line, most retail traders will long here, calling it a breakout.
The price is then reversed. Stopping out all the longs. This is long hunting at the resistance.
The wick crosses above the resistance line, most retail traders will long here, calling it a breakout.
The price is then reversed. Stopping out all the longs. This is long hunting at the resistance.
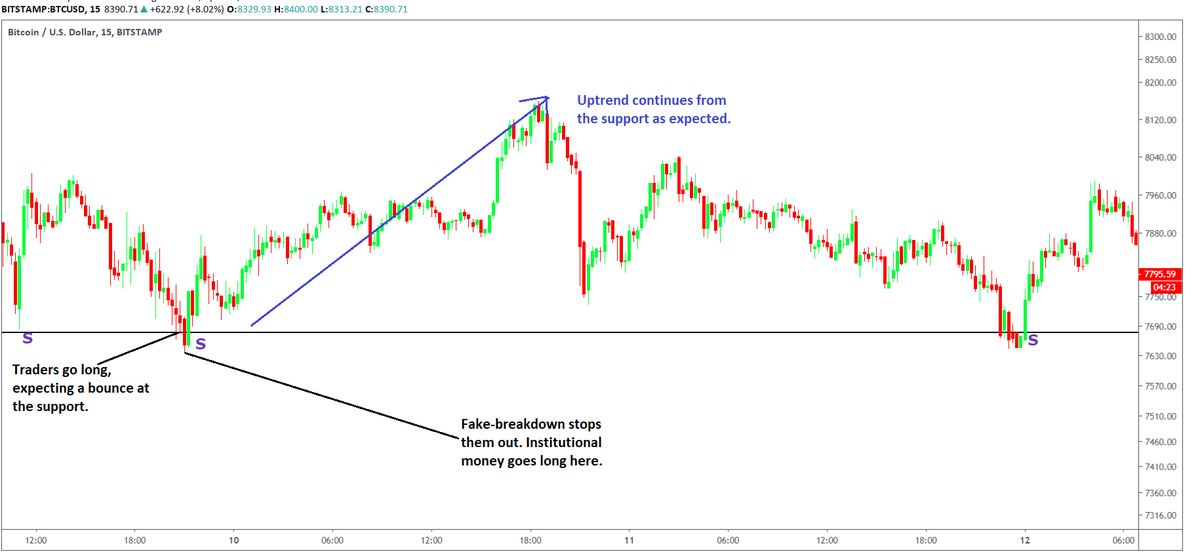
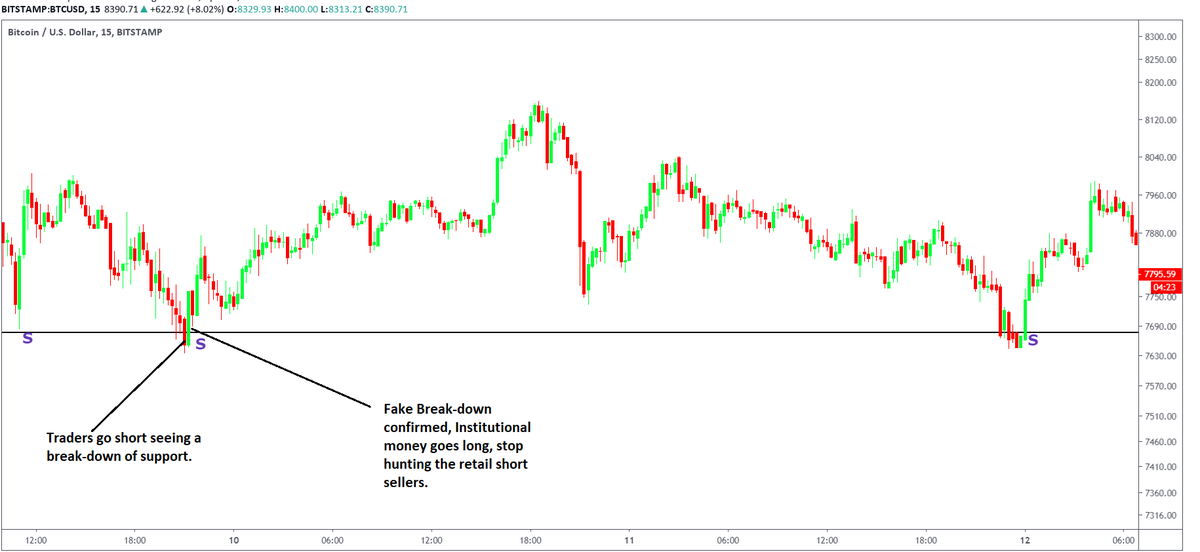
26.The same exact stop loss hunting is done at the support. Stop loss hunting for longs and shorts at the support can be seen here.
This is illustrated in the charts below.
This is illustrated in the charts below.
Now that we have understood that taking long/short entries at the support and resistance can get you stopped out, let us look at the probable solution.
First solution is to look for the following
1. Breakout/Breakdown
2. RE-TEST
3. Follow through
First solution is to look for the following
1. Breakout/Breakdown
2. RE-TEST
3. Follow through
The process of Confirmation and Retest can be used for both long and short entries
1.Confirming the Breakout
2.Confirming the breakdown
3.Confirming the support
4.Confirming the resistance
This chart explains the Re-test and confirmation of support
1.Confirming the Breakout
2.Confirming the breakdown
3.Confirming the support
4.Confirming the resistance
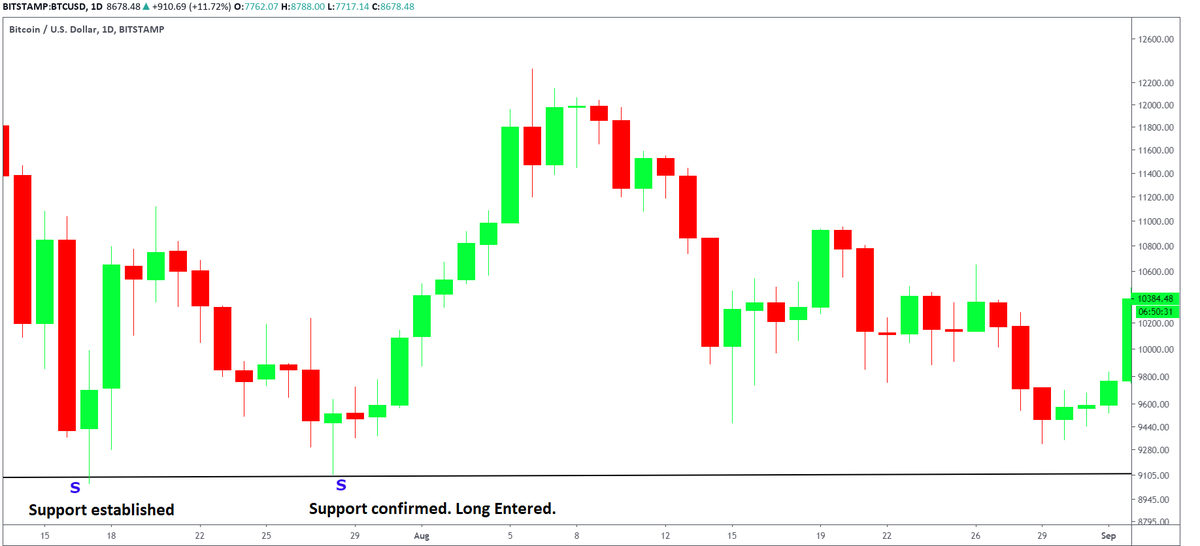
This chart explains the Re-test and confirmation of support
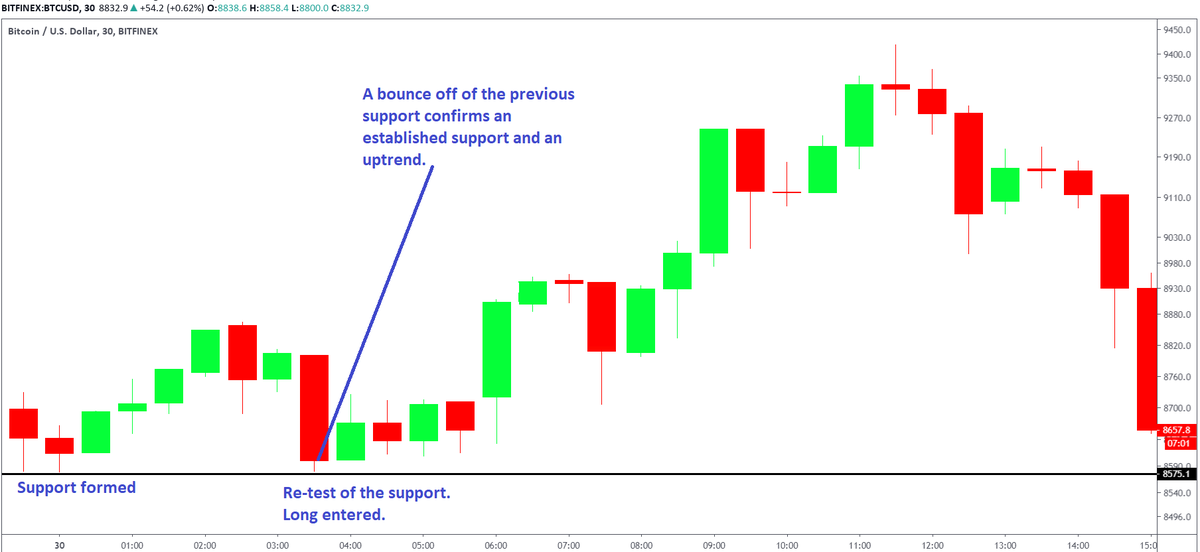
In this chart, The support is established. Then the price comes back to be retested and the support is held and confirmed. This confirms the support line. Leading to an upwards rally.
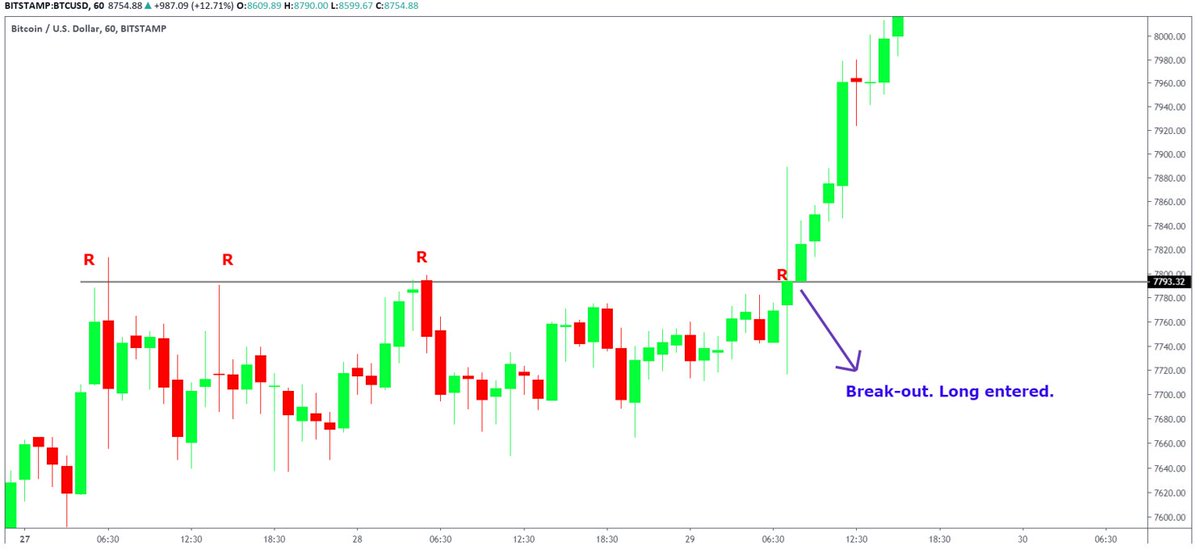
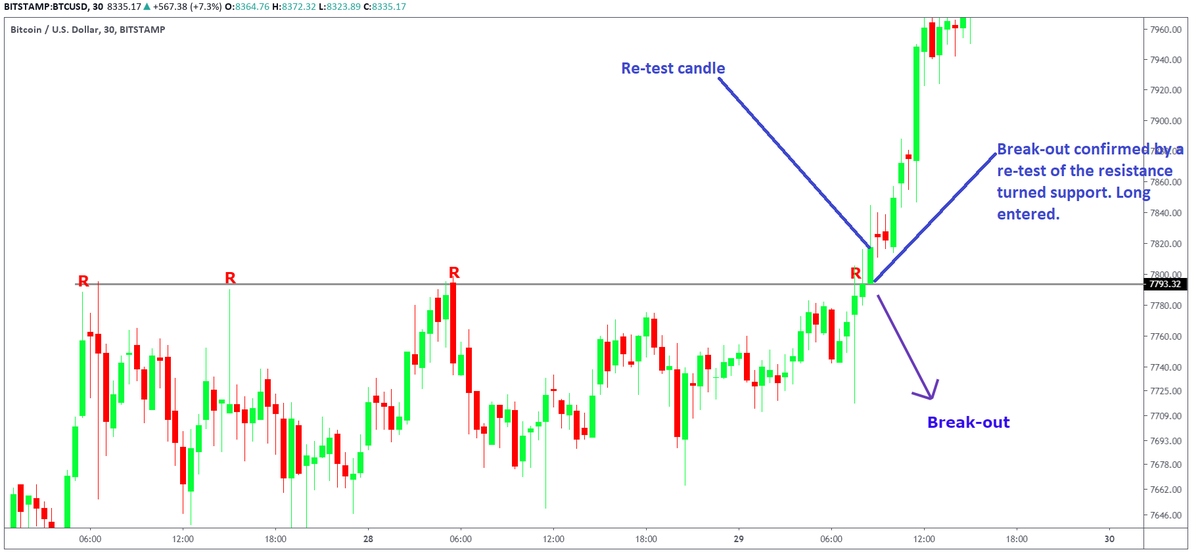
In the same manner, a breakout from a resistance can be confirmed as shown in this chart.
The resistance is broken. The price comes back to confirms the breakout and is confirmed.
On confirmation, a high probability long entry is made.
The resistance is broken. The price comes back to confirms the breakout and is confirmed.
On confirmation, a high probability long entry is made.
2nd Solution
After a break-out or a bounce from the support like, wait for the price to break another resistance above the support line or the break-out levels.
See the example below for entering a long after a bounce at support and break of resistance.
After a break-out or a bounce from the support like, wait for the price to break another resistance above the support line or the break-out levels.
See the example below for entering a long after a bounce at support and break of resistance.

The same concepts can be applied for going short at resistance or breakdowns.
This thread has covered ALL the information you need about horizontal support and resistance in great depth.
I will share trend-line support and resistance and Supply and Demand zone tutorials soon. Study it multiple times and you should be good to go.
I will share trend-line support and resistance and Supply and Demand zone tutorials soon. Study it multiple times and you should be good to go.
References-
Murphy's book for definitions.
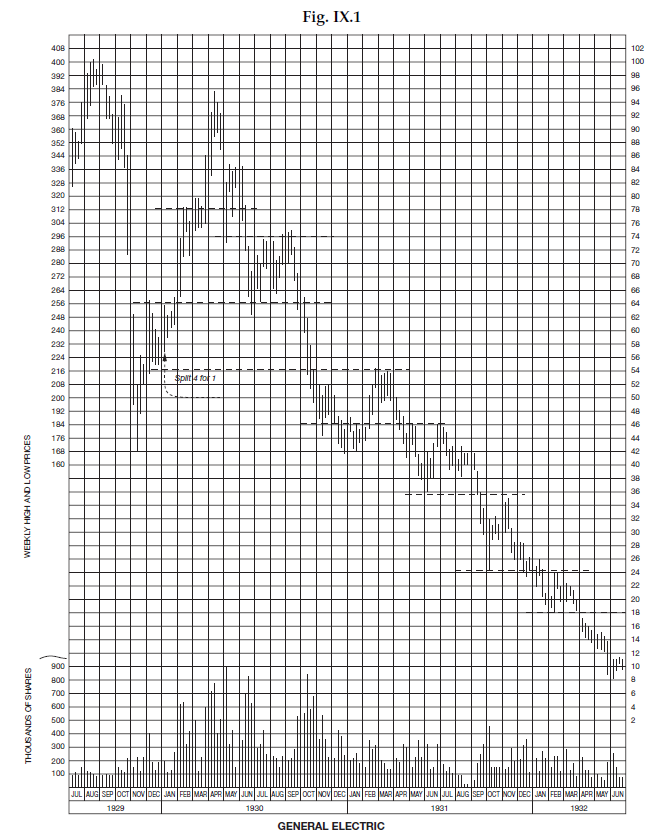
Richard Schabacker's book as recommended by @PeterLBrandt back in 2017 for charts
Idea of Supports becoming weaker upon retests was learnt from @ToneVays back in 2016
@CryptoCred's tutorial for laying out the topics to be covered.
Murphy's book for definitions.
Richard Schabacker's book as recommended by @PeterLBrandt back in 2017 for charts
Idea of Supports becoming weaker upon retests was learnt from @ToneVays back in 2016
@CryptoCred's tutorial for laying out the topics to be covered.
Loading suggestions...