
قراءة تخطيط القلب من اصعب الامور
لذلك في هذا الثريد راح احاول اشرحه لكم بتفاصيله المملة للمبتدئين
راح يكون ثريد مهم وكبير لذلك
فضل التغريدة وممكن ترجع لها لاحقا
How to read ECG
#ECG
#فضفضة_طبيب
لذلك في هذا الثريد راح احاول اشرحه لكم بتفاصيله المملة للمبتدئين
راح يكون ثريد مهم وكبير لذلك
فضل التغريدة وممكن ترجع لها لاحقا
How to read ECG
#ECG
#فضفضة_طبيب

Confirm details
Before beginning ECG interpretation, you should check the following details:
Confirm the name and date of birth of the patient matches the details on the ECG.
Check the date and time that the ECG was performed.
Before beginning ECG interpretation, you should check the following details:
Confirm the name and date of birth of the patient matches the details on the ECG.
Check the date and time that the ECG was performed.
Step 1 – Heart rate
What’s a normal adult heart rate?
Normal: 60-100 bpm
Tachycardia: > 100 bpm
Bradycardia: < 60 bpm
What’s a normal adult heart rate?
Normal: 60-100 bpm
Tachycardia: > 100 bpm
Bradycardia: < 60 bpm
Regular heart rhythm
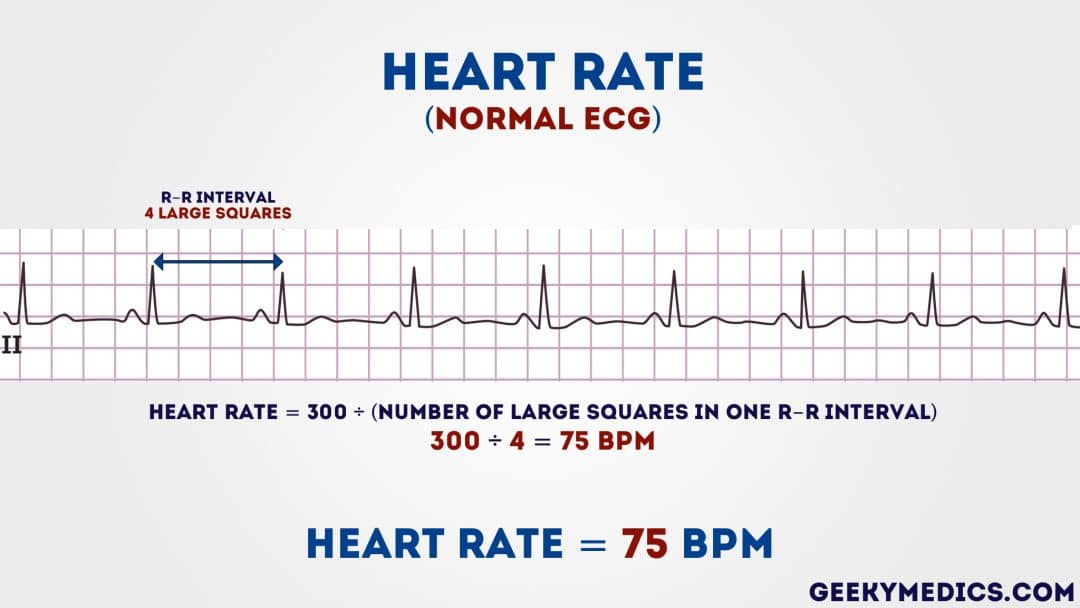
heart rate can be calculated using the following method:
Count the number of large squares present within one R-R interval.
Divide 300 by this number to calculate heart rate.
Example
4 large squares in an R-R interval
300/4 = 75 beats per minute
heart rate can be calculated using the following method:
Count the number of large squares present within one R-R interval.
Divide 300 by this number to calculate heart rate.
Example
4 large squares in an R-R interval
300/4 = 75 beats per minute
Irregular heart rhythm
If a patient’s heart rhythm is irregular the first method of heart rate calculation doesn’t work (as the R-R interval differs significantly throughout the ECG).
As a result
you need to apply a different method:
If a patient’s heart rhythm is irregular the first method of heart rate calculation doesn’t work (as the R-R interval differs significantly throughout the ECG).
As a result
you need to apply a different method:
Count the number of complexes on the rhythm strip (each rhythm strip is typically 10 seconds long).
Multiply the number of complexes by 6 (giving you the average number of complexes in 1 minute).
Example
10 complexes on a rhythm strip
10 x 6 = 60 beats per minuet
Multiply the number of complexes by 6 (giving you the average number of complexes in 1 minute).
Example
10 complexes on a rhythm strip
10 x 6 = 60 beats per minuet
Step 2 – Heart rhythm
A patient’s heart rhythm can be regular or irregular.
Irregular rhythms can be either:
Regularly irregular
(i.e. a recurrent pattern of irregularity)
Irregularly irregular
(i.e. completely disorganised)
A patient’s heart rhythm can be regular or irregular.
Irregular rhythms can be either:
Regularly irregular
(i.e. a recurrent pattern of irregularity)
Irregularly irregular
(i.e. completely disorganised)

Step 3 – Cardiac axis
Cardiac axis describes the overall direction of electrical spread within the heart.
In a healthy individual, the axis should spread from 11 o’clock to 5 o’clock.
To determine the cardiac axis you need to look at leads I, II and III.
Cardiac axis describes the overall direction of electrical spread within the heart.
In a healthy individual, the axis should spread from 11 o’clock to 5 o’clock.
To determine the cardiac axis you need to look at leads I, II and III.
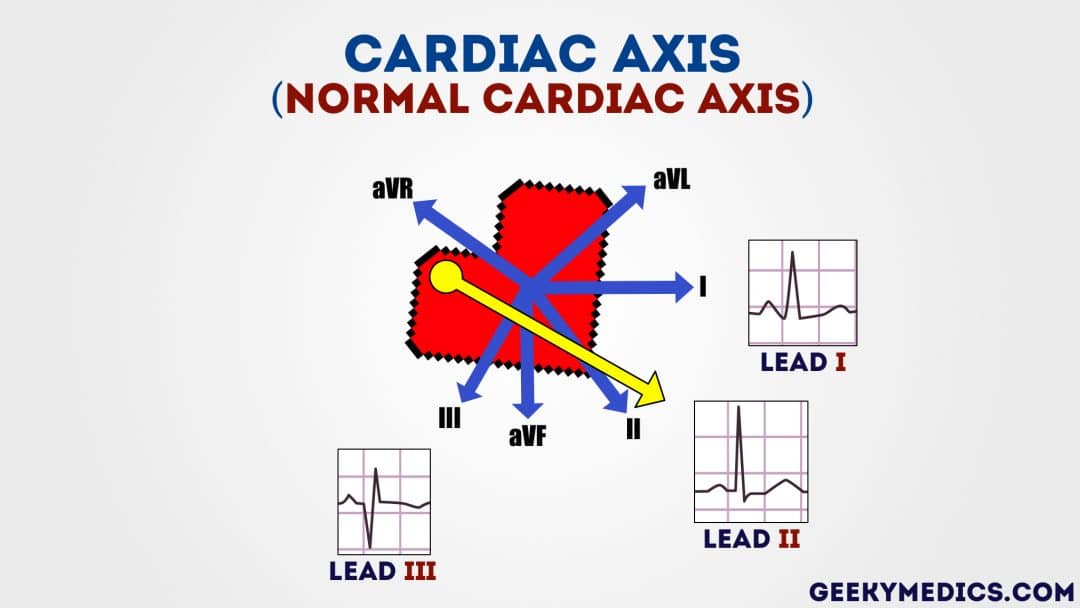
Normal cardiac axis
Typical ECG findings for normal cardiac axis:
Lead II has the most positive deflection compared to leads I and III.
Typical ECG findings for normal cardiac axis:
Lead II has the most positive deflection compared to leads I and III.
Step 4 – P waves
The next step is to look at the P waves and answer the following questions:
Are P waves present?
If so, is each P wave followed by a QRS complex?
Do the P waves look normal? – check duration, direction and shape
The next step is to look at the P waves and answer the following questions:
Are P waves present?
If so, is each P wave followed by a QRS complex?
Do the P waves look normal? – check duration, direction and shape
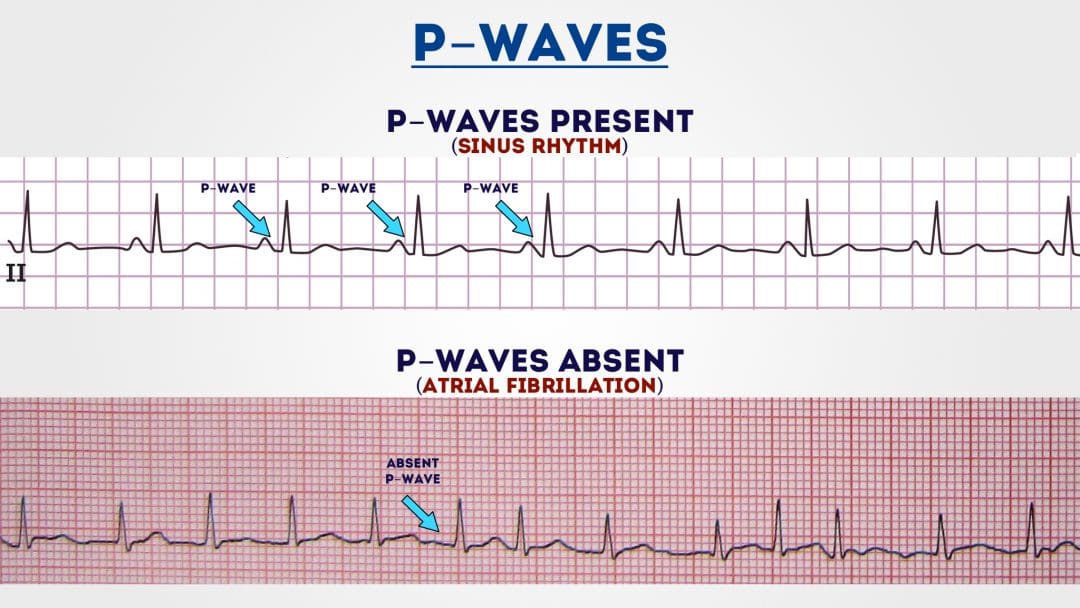
If P waves are absent, is there any atrial activity?
Sawtooth baseline → flutter waves
Chaotic baseline → fibrillation waves
Flat line → no atrial activity at all
Sawtooth baseline → flutter waves
Chaotic baseline → fibrillation waves
Flat line → no atrial activity at all
Step 5 – PR interval
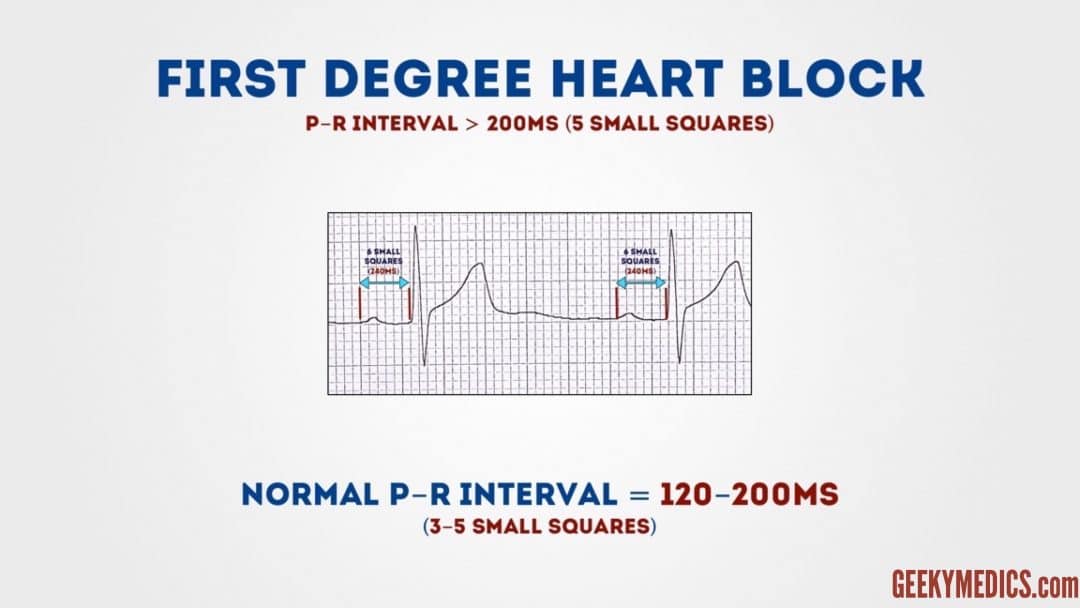
The PR interval should be between 120-200 ms
(3-5 small squares).
Prolonged PR interval (>0.2 seconds)
A prolonged PR interval suggests the presence of atrioventricular delay
(AV block).
The PR interval should be between 120-200 ms
(3-5 small squares).
Prolonged PR interval (>0.2 seconds)
A prolonged PR interval suggests the presence of atrioventricular delay
(AV block).
First-degree heart block (AV block)
First-degree heart block involves a fixed prolonged PR interval
(>200 ms).
First-degree heart block involves a fixed prolonged PR interval
(>200 ms).
Second-degree heart block
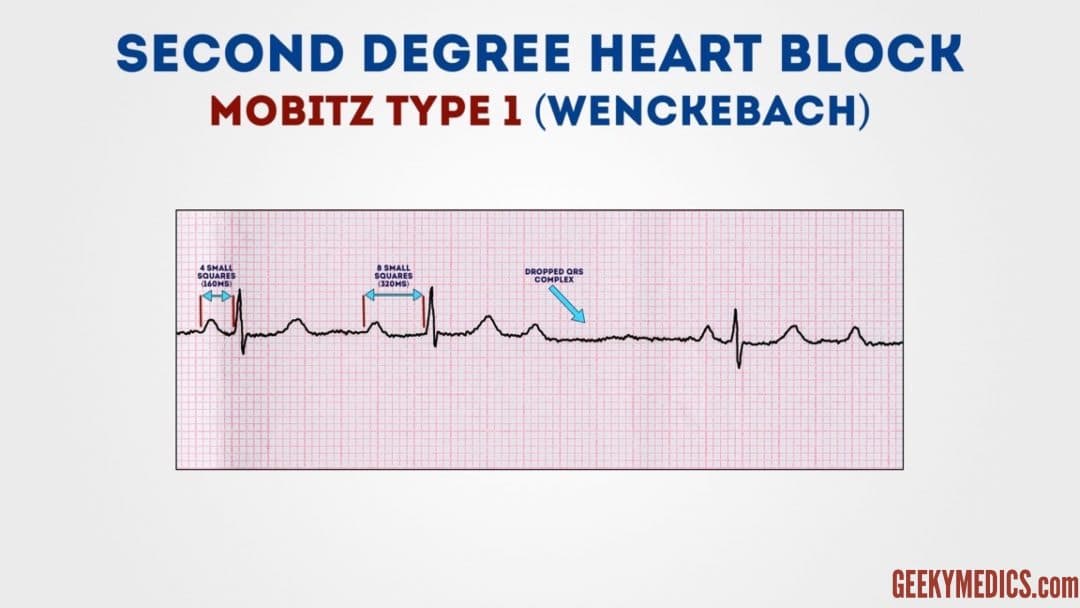
Second-degree AV block
(type 1) known as Mobitz type 1 AV block or Wenckebach phenomenon.
ECG findings in Mobitz type 1 block include prolongation of the PR interval until eventually the atrial impulse is not conducted and the QRS is dropped.
Second-degree AV block
(type 1) known as Mobitz type 1 AV block or Wenckebach phenomenon.
ECG findings in Mobitz type 1 block include prolongation of the PR interval until eventually the atrial impulse is not conducted and the QRS is dropped.
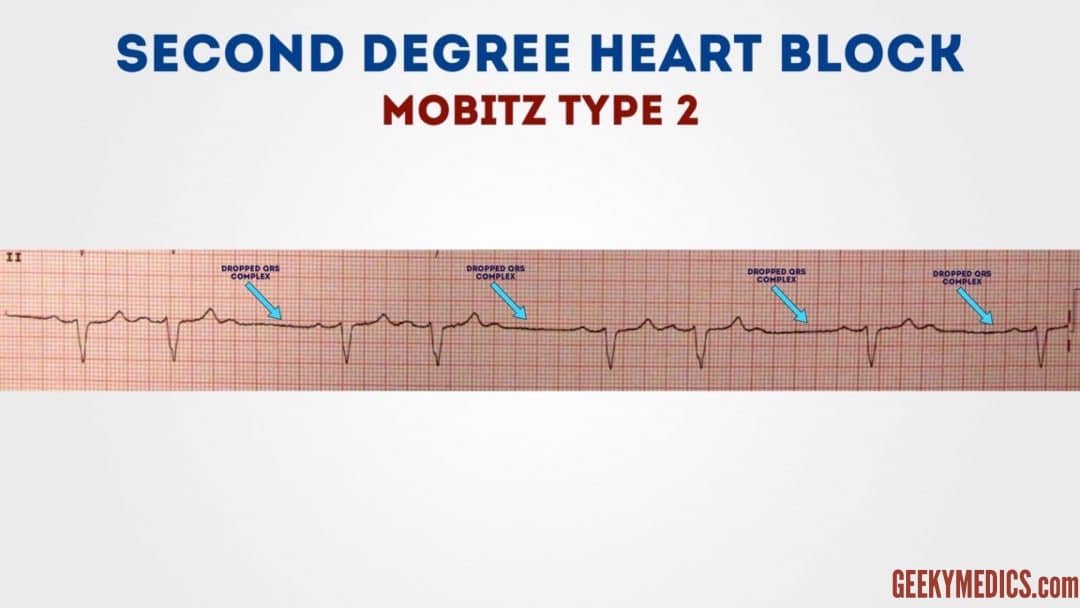
Second-degree heart block
Second-degree AV block (type 2) is also known as Mobitz type 2 AV block.
Typical ECG findings in Mobitz type 2 AV block include a consistent PR interval duration with intermittently dropped QRS complexes due to a failure of conduction.
Second-degree AV block (type 2) is also known as Mobitz type 2 AV block.
Typical ECG findings in Mobitz type 2 AV block include a consistent PR interval duration with intermittently dropped QRS complexes due to a failure of conduction.
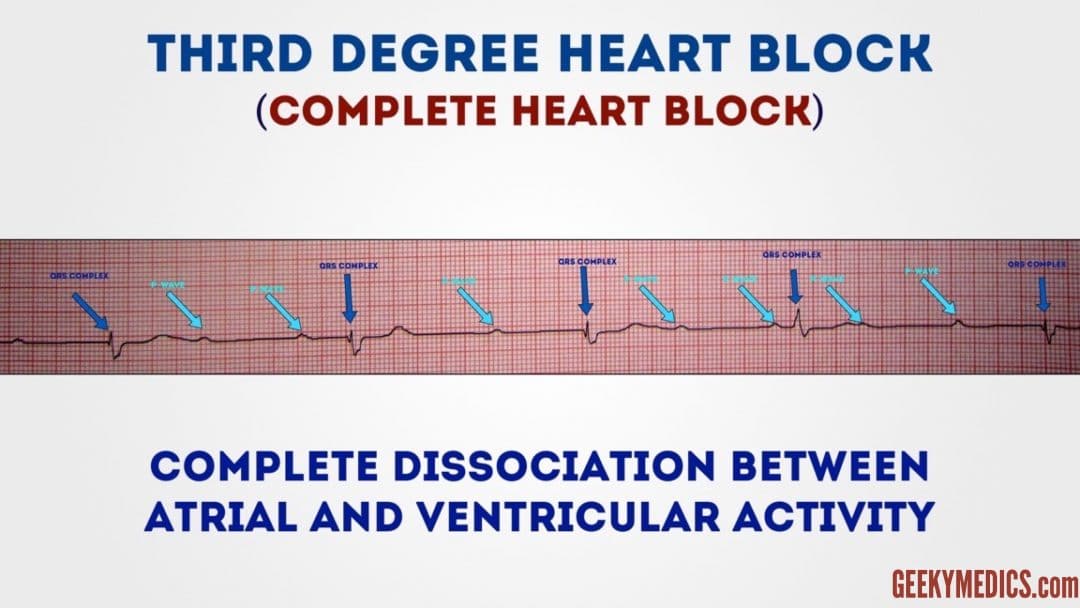
Third-degree heart block (complete heart block)
Third-degree (complete) AV block occurs when there is no electrical communication between the atria and ventricles due to a complete failure of conduction.
Third-degree (complete) AV block occurs when there is no electrical communication between the atria and ventricles due to a complete failure of conduction.
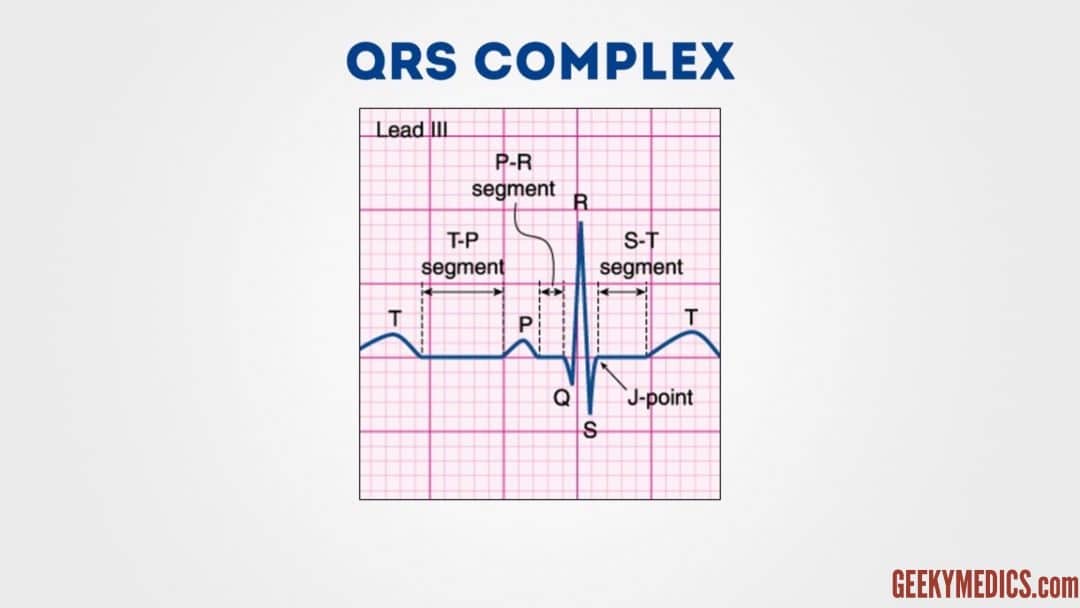
Step 6 – QRS complex
When assessing a QRS complex, you need to pay attention to the following characteristics:
Width
Height
Morphology
When assessing a QRS complex, you need to pay attention to the following characteristics:
Width
Height
Morphology
Width
Width can be described as NARROW (< 0.12 seconds) or BROAD (> 0.12 seconds):
A narrow QRS complex occurs when the impulse is conducted down the bundle of His and the Purkinje fibre to the ventricles. This results in well organised synchronised ventricular depolarisation.
Width can be described as NARROW (< 0.12 seconds) or BROAD (> 0.12 seconds):
A narrow QRS complex occurs when the impulse is conducted down the bundle of His and the Purkinje fibre to the ventricles. This results in well organised synchronised ventricular depolarisation.
A broad QRS complex occurs if there is an abnormal depolarisation sequence – for example, a ventricular ectopic where the impulse spreads slowly across the myocardium from the focus in the ventricle.
Height
Height can be described as either SMALL or TALL:
Small complexes are defined as < 5mm in the limb leads or < 10 mm in the chest leads.
Tall complexes imply ventricular hypertrophy (although can be due to body habitus e.g. tall slim people).
Height can be described as either SMALL or TALL:
Small complexes are defined as < 5mm in the limb leads or < 10 mm in the chest leads.
Tall complexes imply ventricular hypertrophy (although can be due to body habitus e.g. tall slim people).
Morphology
To assess morphology, you need to assess the individual waves of the QRS complex.
Delta wave
The mythical ‘delta wave‘ is a sign that the ventricles are being activated earlier than normal from a point distant to the AV node.
To assess morphology, you need to assess the individual waves of the QRS complex.
Delta wave
The mythical ‘delta wave‘ is a sign that the ventricles are being activated earlier than normal from a point distant to the AV node.
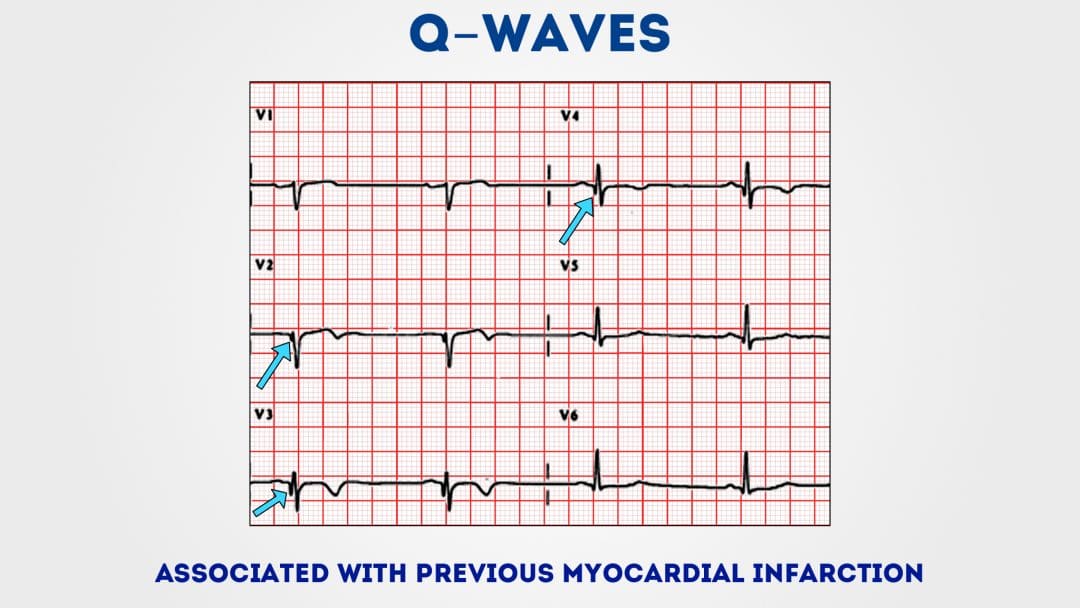
Q-waves
Isolated Q waves can be normal.
A pathological Q wave is > 25% the size of the R wave that follows it or > 2mm in height and > 40ms in width.
A single Q wave is not a cause for concern – look for Q waves in an entire territory (e.g. anterior/inferior)
Isolated Q waves can be normal.
A pathological Q wave is > 25% the size of the R wave that follows it or > 2mm in height and > 40ms in width.
A single Q wave is not a cause for concern – look for Q waves in an entire territory (e.g. anterior/inferior)
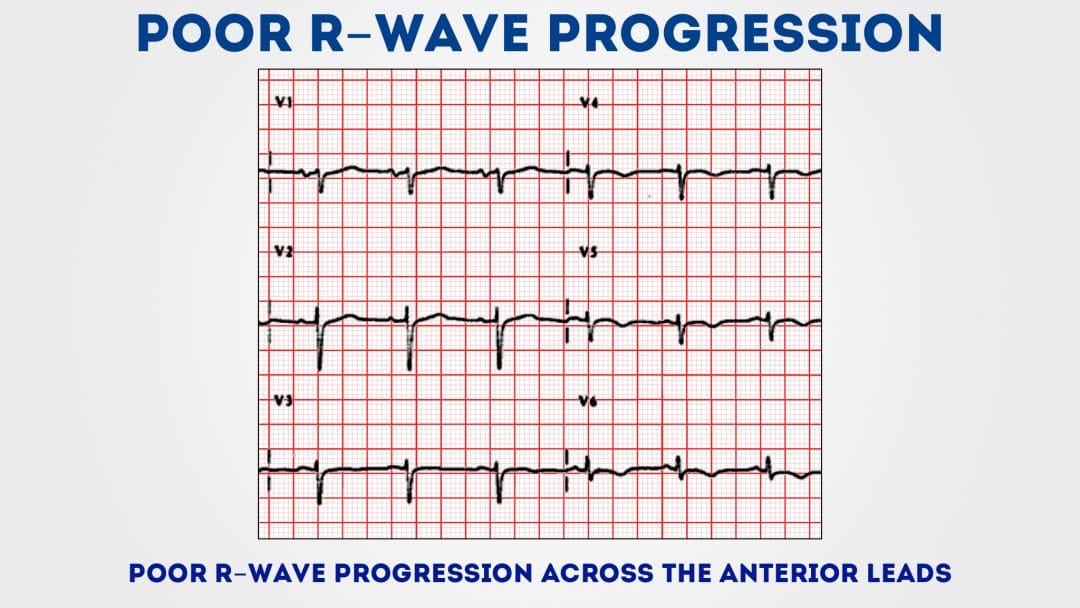
R and S waves
Assess the R wave progression across the chest leads (from small in V1 to large in V6).
The transition from S > R wave to R > S wave should occur in V3 or V4.
Poor progression
(i.e. S > R through to leads V5 and V6)
Assess the R wave progression across the chest leads (from small in V1 to large in V6).
The transition from S > R wave to R > S wave should occur in V3 or V4.
Poor progression
(i.e. S > R through to leads V5 and V6)
Step 7 – ST segment
The ST segment is the part of the ECG between the end of the S wave and the start of the T wave
In a healthy individual, it should be an isoelectric line
(neither elevated nor depressed)
Abnormalities of segment should be investigated to rule out pathology
The ST segment is the part of the ECG between the end of the S wave and the start of the T wave
In a healthy individual, it should be an isoelectric line
(neither elevated nor depressed)
Abnormalities of segment should be investigated to rule out pathology
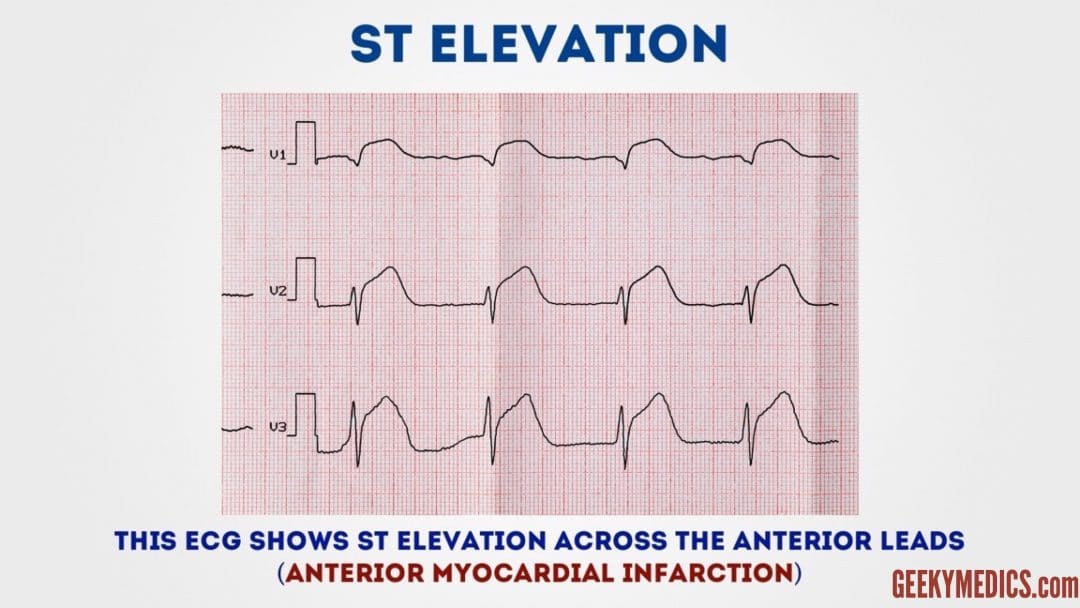
ST-elevation
ST-elevation is significant when it is greater than 1 mm (1 small square) in 2 or more contiguous limb leads or >2mm in 2 or more chest leads.
It is most commonly caused by acute full-thickness myocardial infarction.
ST-elevation is significant when it is greater than 1 mm (1 small square) in 2 or more contiguous limb leads or >2mm in 2 or more chest leads.
It is most commonly caused by acute full-thickness myocardial infarction.
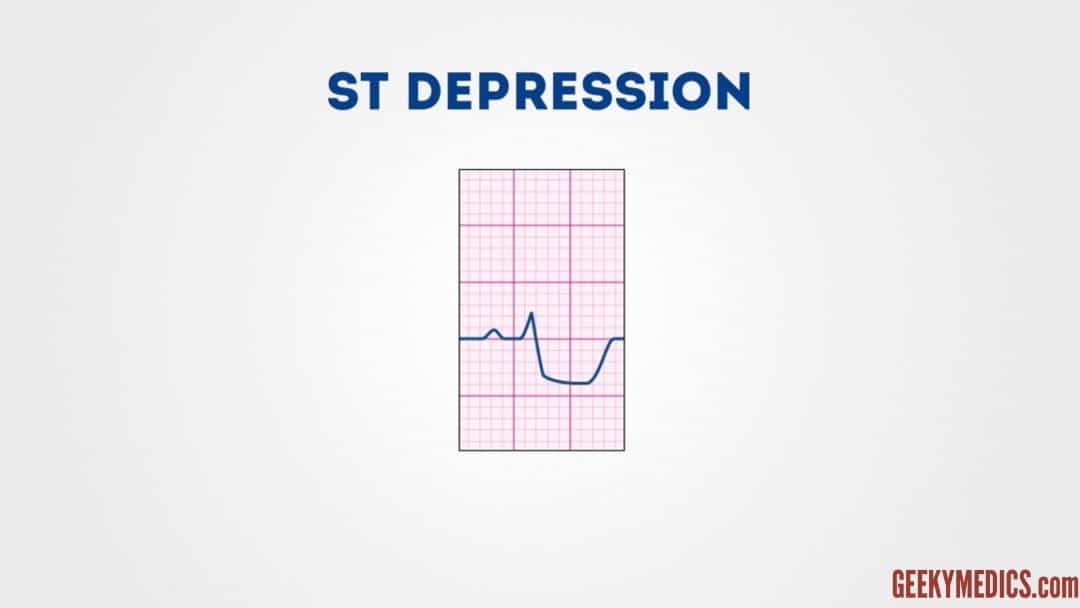
ST depression
ST depression ≥ 0.5 mm in ≥ 2 contiguous leads indicates myocardial ischaemia.
ST depression ≥ 0.5 mm in ≥ 2 contiguous leads indicates myocardial ischaemia.
Step 8 – T wave
T waves represent repolarisation of the ventricles
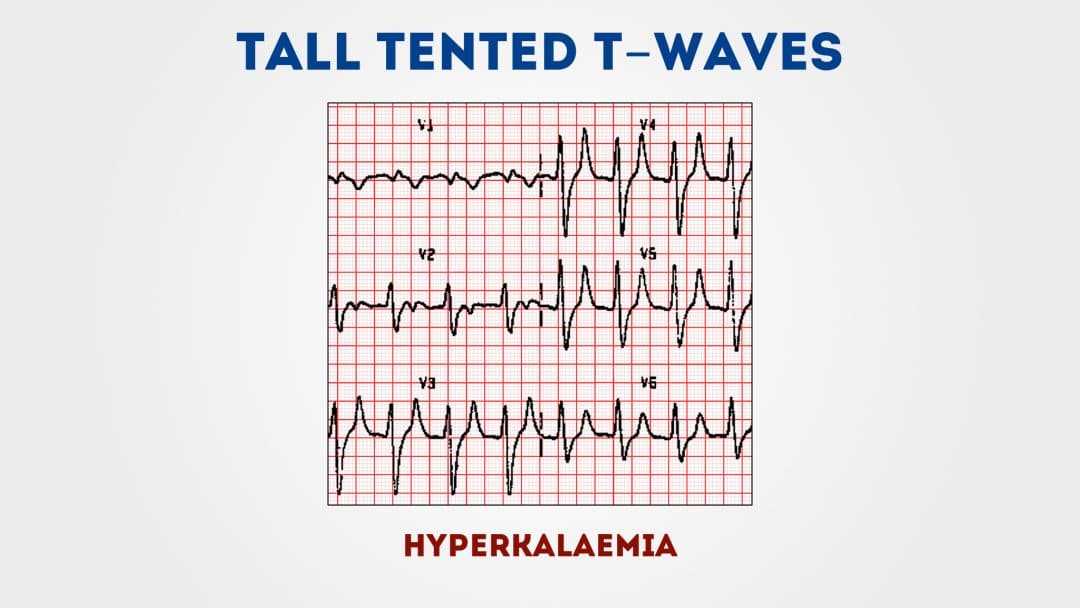
Tall T waves
T waves are considered tall if they are:
>5mm in the limb leads
>10mm in the chest leads
(the same criteria as ‘small’ QRS complexes)
can be associated with:
Hyperkalaemia
Hyperacute STEMI
T waves represent repolarisation of the ventricles
Tall T waves
T waves are considered tall if they are:
>5mm in the limb leads
>10mm in the chest leads
(the same criteria as ‘small’ QRS complexes)
can be associated with:
Hyperkalaemia
Hyperacute STEMI
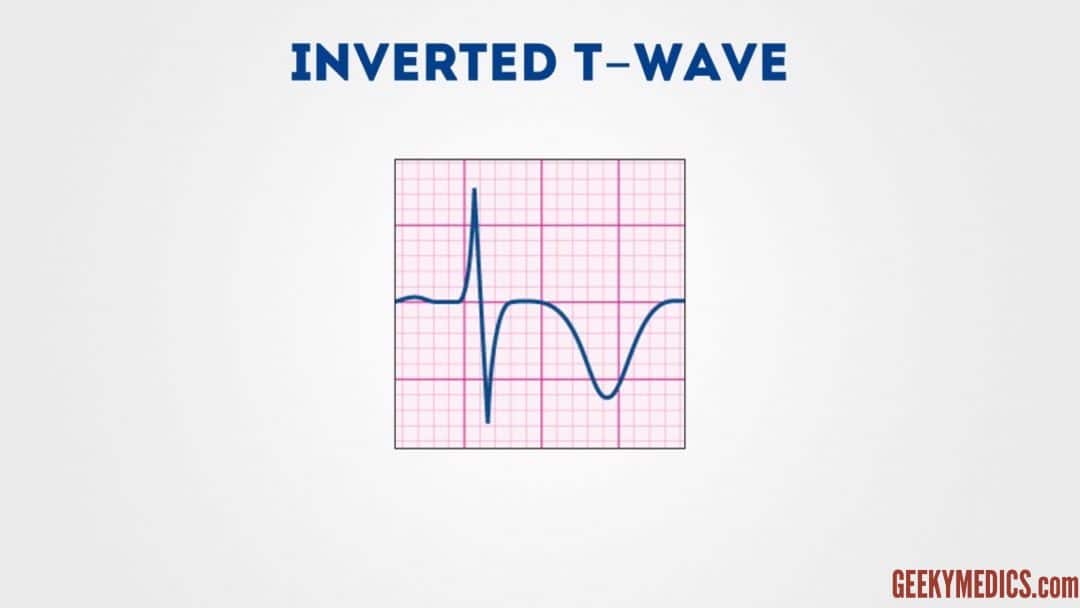
Inverted T waves
T waves are normally inverted in V1 and inversion in lead III is a normal variant.
Inverted T waves in other leads are a nonspecific sign of a wide variety of conditions:
T waves are normally inverted in V1 and inversion in lead III is a normal variant.
Inverted T waves in other leads are a nonspecific sign of a wide variety of conditions:
Ischaemia
Bundle branch blocks (V4-6 in LBBB and V1-V3 in RBBB)
Pulmonary embolism
Left ventricular hypertrophy (in the lateral leads)
Hypertrophic cardiomyopathy (widespread)
General illness
Bundle branch blocks (V4-6 in LBBB and V1-V3 in RBBB)
Pulmonary embolism
Left ventricular hypertrophy (in the lateral leads)
Hypertrophic cardiomyopathy (widespread)
General illness
انتهى الثريد .. المعذرة فقد اطلت عليكم
اتمنى انكم وجدتم الفائدة .. موضوع طويل ومتعب
ومساعدتي في نشره راح يكون بمثابة الشي الكبير
وفي دعمكم نستمر 🌹❤
اتمنى انكم وجدتم الفائدة .. موضوع طويل ومتعب
ومساعدتي في نشره راح يكون بمثابة الشي الكبير
وفي دعمكم نستمر 🌹❤
Loading suggestions...