

<>BULLISH DIVERGENCE<>
After this, you will MASTER the most profitable tool in trading for predicting the tops and the bottoms.
It's a little bit complicated, but if you read this thread, you will master it completely.
Share it with fellow traders!
After this, you will MASTER the most profitable tool in trading for predicting the tops and the bottoms.
It's a little bit complicated, but if you read this thread, you will master it completely.
Share it with fellow traders!
To understand the divergence, we have to get to know another term called an OSCILLATOR.
An oscillator is a momentum indicator used in technical analysis that moves between an upper and lower band.
For example, the Relative Strength Index or RSI.
An oscillator is a momentum indicator used in technical analysis that moves between an upper and lower band.
For example, the Relative Strength Index or RSI.
USUALLY when the price of a certain asset moves in a certain direction the momentum oscillator moves in the SAME direction too.

A Divergence is a term describing the occurrence when the price and the momentum oscillator move in DIFFERENT directions.
Divergences are used to identify the potential REVERSAL of a trend. They work better when using a longer time frame (4-hour or daily time frame).
Divergences are used to identify the potential REVERSAL of a trend. They work better when using a longer time frame (4-hour or daily time frame).
A BULLISH DIVERGENCE is used for predicting the tops and bottoms.
It’s basically the opposite of bearish signals.
Traders use bullish divergences to time their ENTRY points of a trade.
It’s basically the opposite of bearish signals.
Traders use bullish divergences to time their ENTRY points of a trade.
A bullish divergence is formed when the price moves in a downtrend, and it is about to reverse.
When determining the bullish divergence, we always have to look at the lows of the price and the oscillator.
This way, we determine a bottom.
When determining the bullish divergence, we always have to look at the lows of the price and the oscillator.
This way, we determine a bottom.
IMPORTANT
- Always observe the lows of the price and the oscillator.
- When determining the divergence, look for clear new levels (Higher High, Higher Low, or Lower High nad Lower Lows).
- Never use divergences in a sideways trend.
- Always observe the lows of the price and the oscillator.
- When determining the divergence, look for clear new levels (Higher High, Higher Low, or Lower High nad Lower Lows).
- Never use divergences in a sideways trend.
There are 3 TYPES of BULLISH divergences, which are determined by its strength. Strong, medium, and weak.
We will show an example of every type!
We will show an example of every type!
STRONG Bullish Divergence.
This happens when the price of an asset makes a lower low, but the momentum oscillator makes a higher low.
This means that the price is probably going to form a bottom.
This happens when the price of an asset makes a lower low, but the momentum oscillator makes a higher low.
This means that the price is probably going to form a bottom.
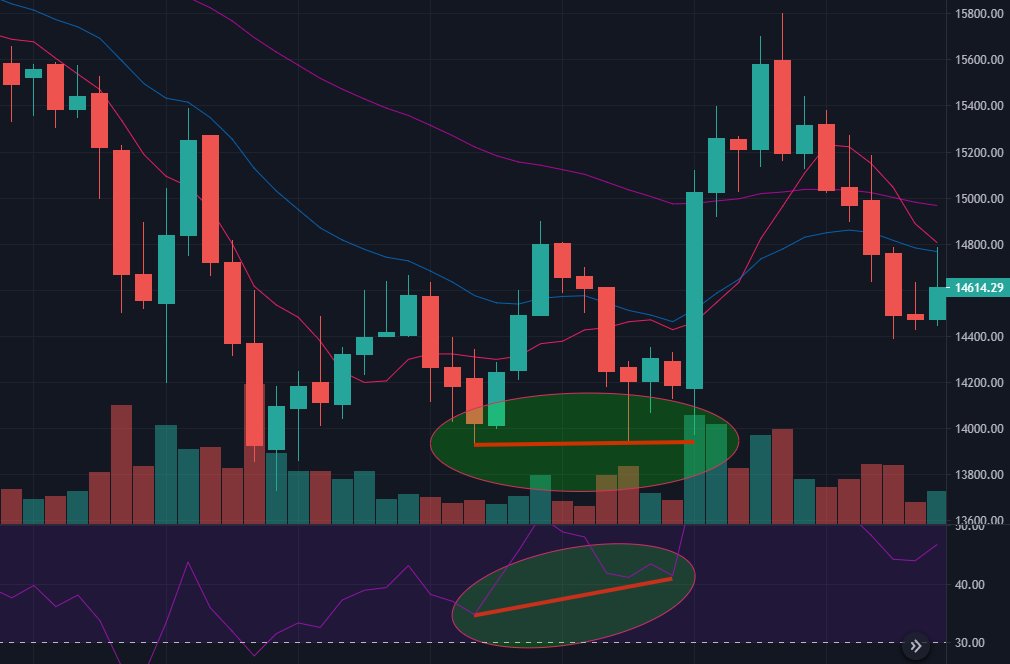
MEDIUM Bullish Divergence.
This happens when the price forms a double bottom, and the momentum oscillator makes a higher low.
This happens when the price forms a double bottom, and the momentum oscillator makes a higher low.
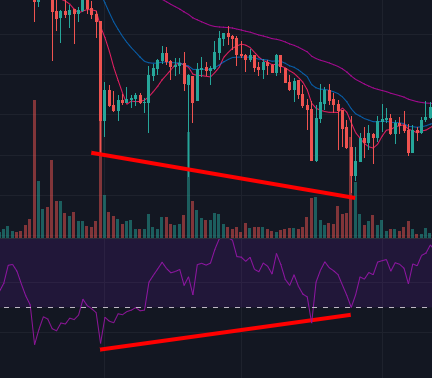
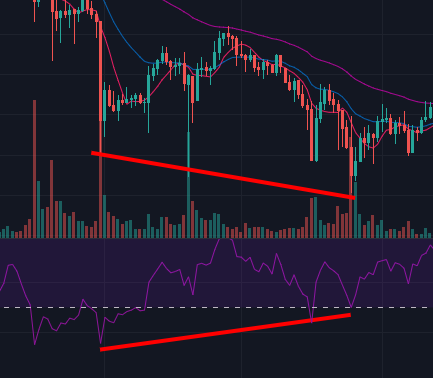
WEAK Bullish Divergence.
The price forms a lower low, and the oscillator forms a double bottom.
The price forms a lower low, and the oscillator forms a double bottom.


Loading suggestions...