

This is a step-by-step guide on how you can solve the Titanic disaster challenge on Kaggle.
🧵 👇🏻
🧵 👇🏻
Kaggle challenges are a great way to practice your machine learning skills.
In this thread, we'll go through each step for solving the beginner friendly titanic disaster challenge.
In this thread, we'll go through each step for solving the beginner friendly titanic disaster challenge.
These are the key steps that we will go over:
- Cleaning the data
- Training a machine learning model using decision trees in Sklearn
- Making a submission to Kaggle using the predictions from our training model
- Cleaning the data
- Training a machine learning model using decision trees in Sklearn
- Making a submission to Kaggle using the predictions from our training model
We will be using:
- Jupyter notebooks/Google Collab
- Python with Sci-kit learn, pandas
Keep in mind that this is just one way of solving this challenge, there are probably many others but I find this intuitive and easy to understand.
- Jupyter notebooks/Google Collab
- Python with Sci-kit learn, pandas
Keep in mind that this is just one way of solving this challenge, there are probably many others but I find this intuitive and easy to understand.
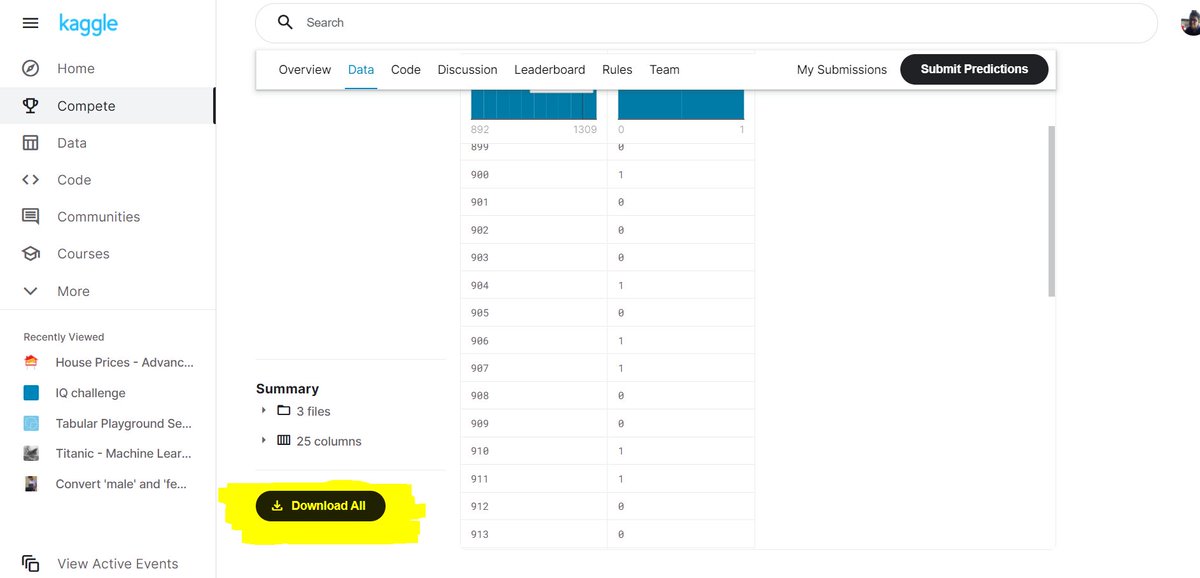
Place the zip file in a folder and unzip it.
You will see 3 CSV files, these are basically like excel files where the data is in a tabular format.
You will see 3 CSV files, these are basically like excel files where the data is in a tabular format.
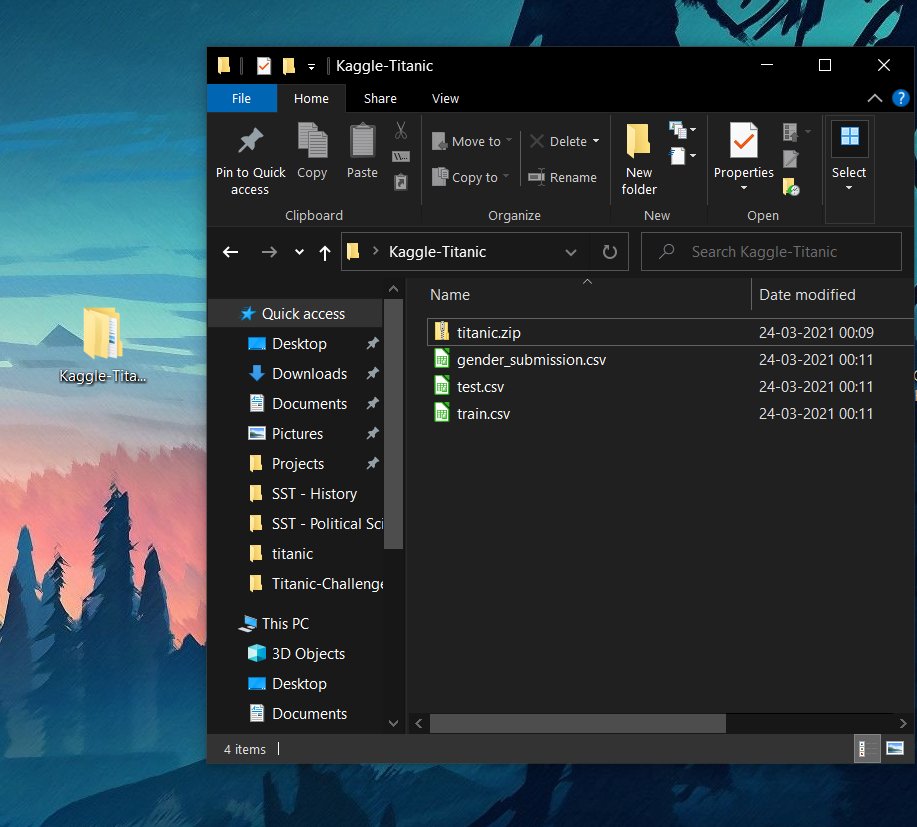
You can open them using Excel, google sheets or libre office (like I have)
This is the train.csv file 👇🏻
This is the train.csv file 👇🏻

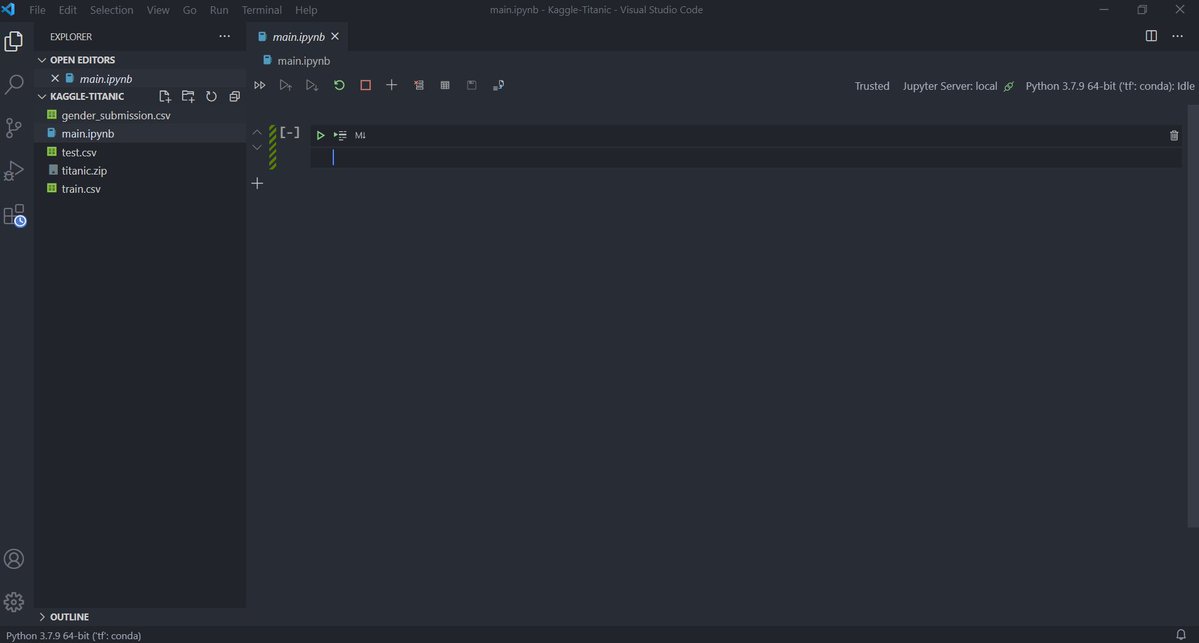
Create a .ipynb file, you can name it anything.
I've named it main.ipynb
I've named it main.ipynb
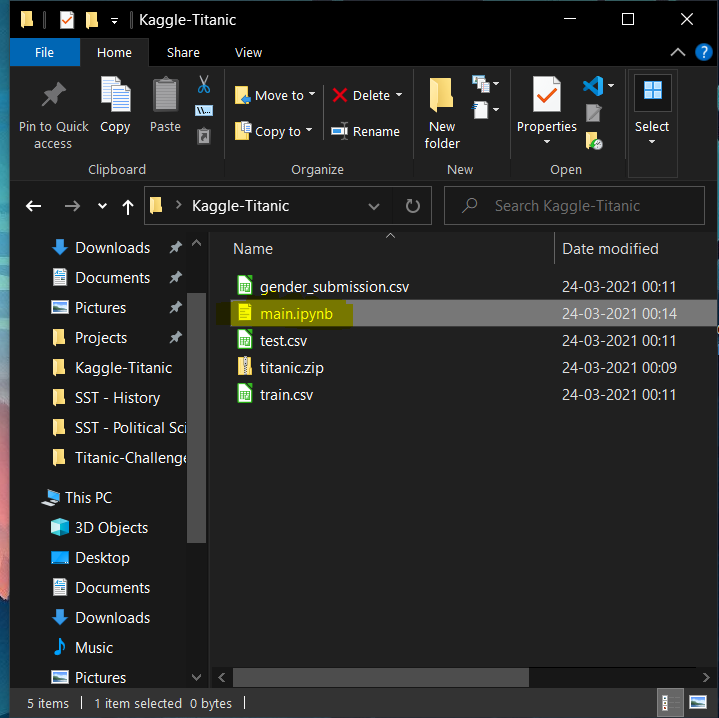
Now open this folder in VS code.
It has a nice editor for Jupyter notebooks which is what we'll be using.
For this, you need to install the Python extension from the VS Code marketplace.
🔗 marketplace.visualstudio.com
It has a nice editor for Jupyter notebooks which is what we'll be using.
For this, you need to install the Python extension from the VS Code marketplace.
🔗 marketplace.visualstudio.com
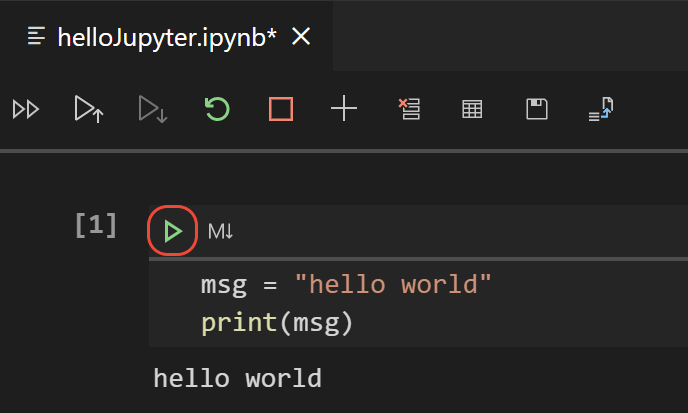
In Jupyter notebooks, we write code in "cells".
These cells can be executed one at a time, allowing you to run certain chunks of code as per your will.
In Vs code, you can run each cell by clicking this button.
These cells can be executed one at a time, allowing you to run certain chunks of code as per your will.
In Vs code, you can run each cell by clicking this button.
Let's start writing the code.
We will first import pandas and the datasets (the CSV files you extracted earlier) using it.
We'll be using the train data to train our model and the test data is for making our predictions which we will send to kaggle.
We will first import pandas and the datasets (the CSV files you extracted earlier) using it.
We'll be using the train data to train our model and the test data is for making our predictions which we will send to kaggle.

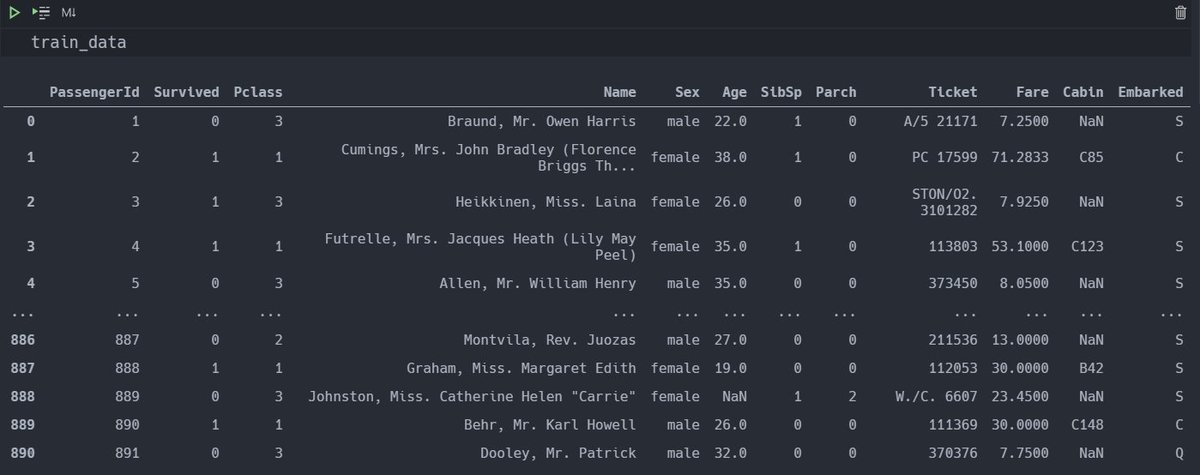
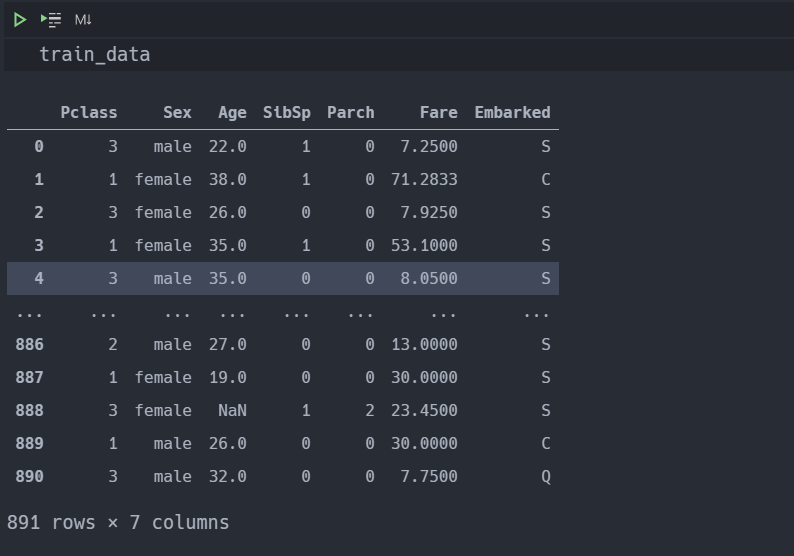
This is how the train_data looks 👇🏻
'Pclass', 'Survived' etc are 'features' of this dataset. They give us information about the passengers that were onboard the Titanic.
We will use the data in these features to train our model.
'Pclass', 'Survived' etc are 'features' of this dataset. They give us information about the passengers that were onboard the Titanic.
We will use the data in these features to train our model.
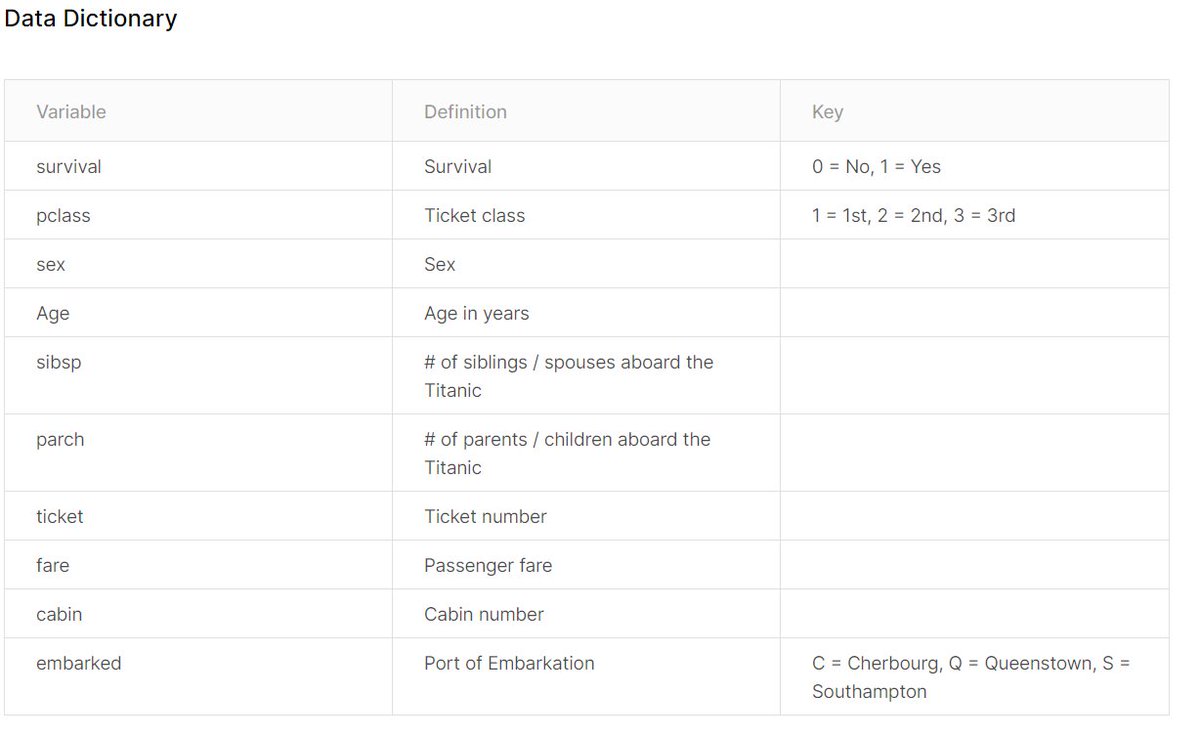
Our goal is predict whether someone onboard the titanic survived or not based on a given set of features.
This is a description of the features in our dataset 👇🏻
Take a moment to think about which ones are useful to us and which ones are not.
This is a description of the features in our dataset 👇🏻
Take a moment to think about which ones are useful to us and which ones are not.
Now we will set the train_labels to the survived column in the train_data dataframe.
We will also 'drop' the data which we do not need for training the model.
We will also 'drop' the data which we do not need for training the model.

The train_data dataframe now looks like this 👇🏻
We need to do 2 more things before we can feed this data to our machine learning model.
1. Map all the categorical data to numerical values
2. Fill the NaN values
1. Map all the categorical data to numerical values
2. Fill the NaN values
If you look at the columns labelled Sex and Embarked, you'll notice values that are in categories.
Our machine learning model will only accept numerical values as input.
Our machine learning model will only accept numerical values as input.
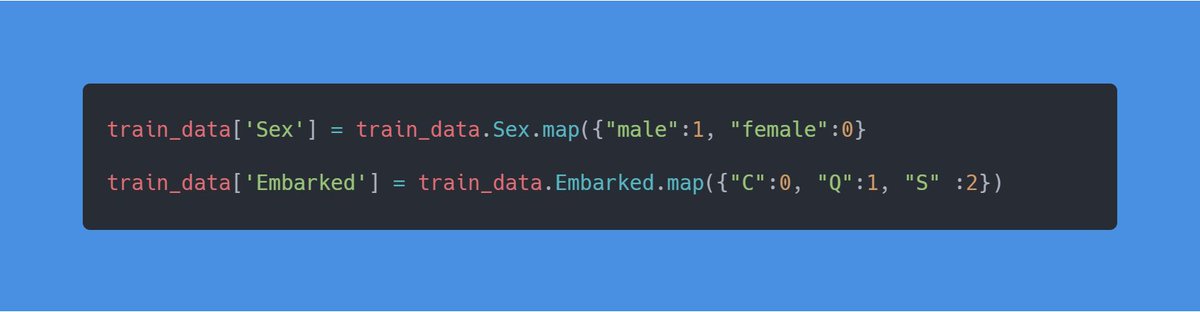
What we can do in this case is map the categorical values to numerical values, which we can then feed into the machine learning model.
male gets mapped to 1
female to 0
so on and so forth.
male gets mapped to 1
female to 0
so on and so forth.
You can also simplify this process by using pd.get_dummies, it essentially does the same thing as above.

NaN values are basically blank places in the dataframe, we have to fill in these values with something before we feed this data to our machine learning model.
We can see that the Age and the embarked column have 177 and 2 NaN or blank values, repectively.
We can see that the Age and the embarked column have 177 and 2 NaN or blank values, repectively.
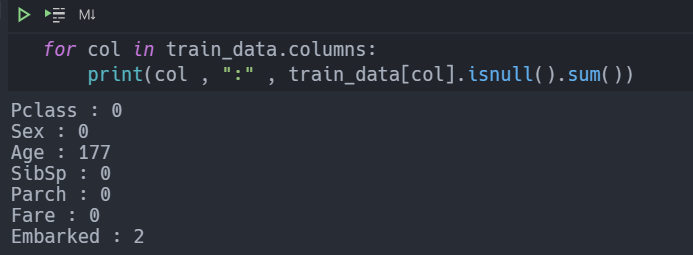
We will come back to the embarked column later on.
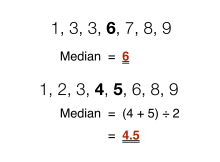
In the Age column, we can basically substitute the blank values with the median of that column.
Median is basically the middle-most value.
In the Age column, we can basically substitute the blank values with the median of that column.
Median is basically the middle-most value.
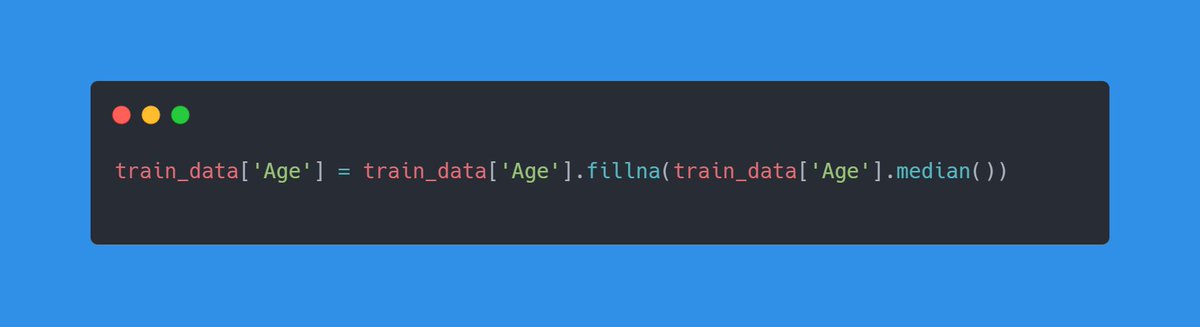
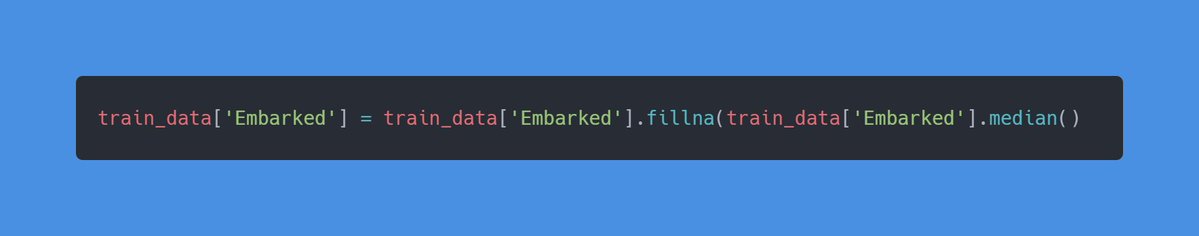
We'll do the same for the embarked column.
Our data is now ready to be fed into the model.
Our data is now ready to be fed into the model.
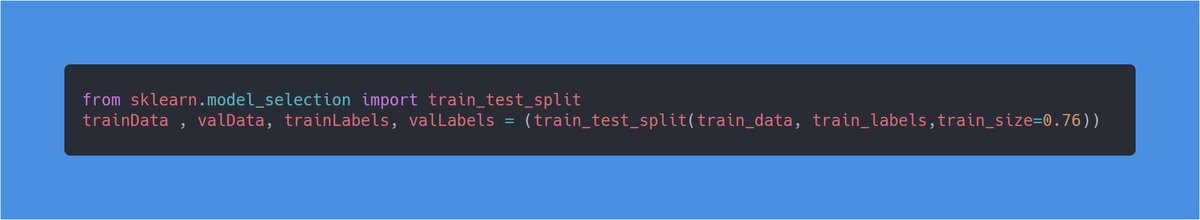
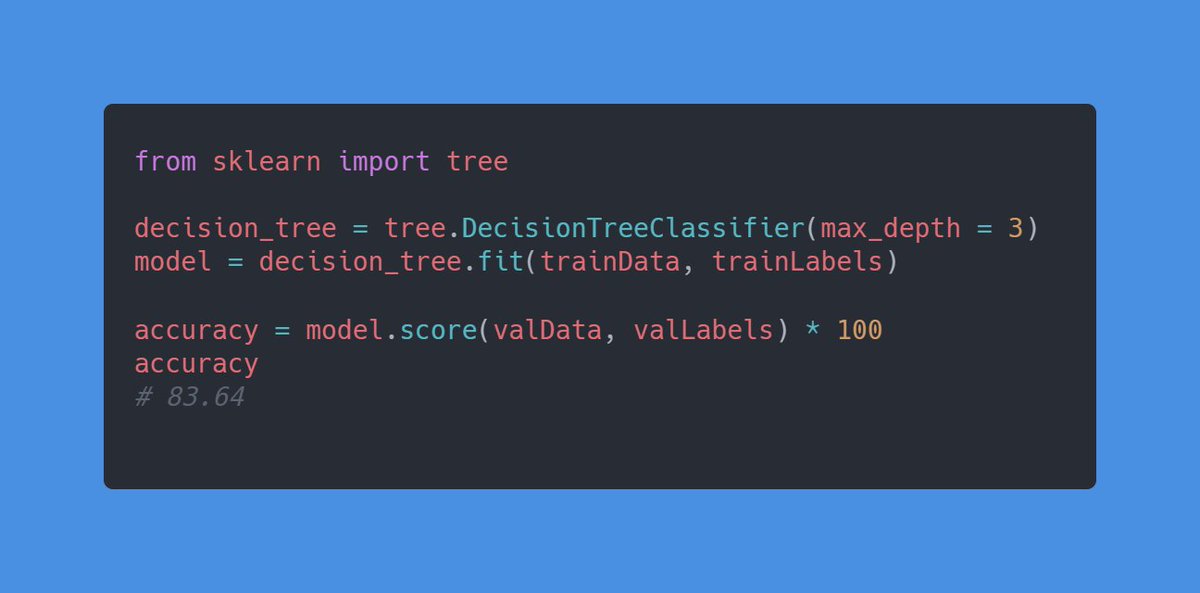
We'll split our train dataset into training and and testing datasets for better accuracy.
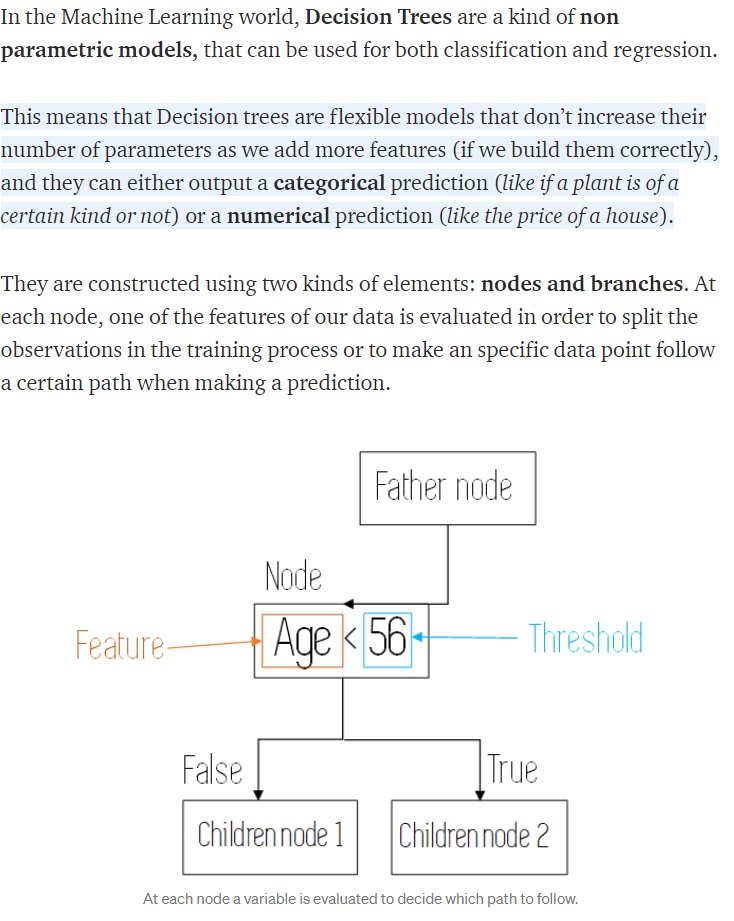
We'll be using a machine learning algorithim called 'decision trees'.
It is an algorthim that we can use for regression as well as classification tasks.
It is an algorthim that we can use for regression as well as classification tasks.
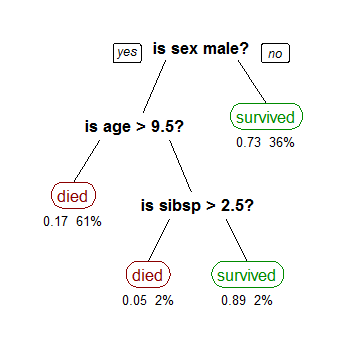
Running the model on the data and printing the accuracy we get 83%.
This means that our model can accurately predict whether a person aboard the titanic died or not 83% of the time.
Nice!
This means that our model can accurately predict whether a person aboard the titanic died or not 83% of the time.
Nice!
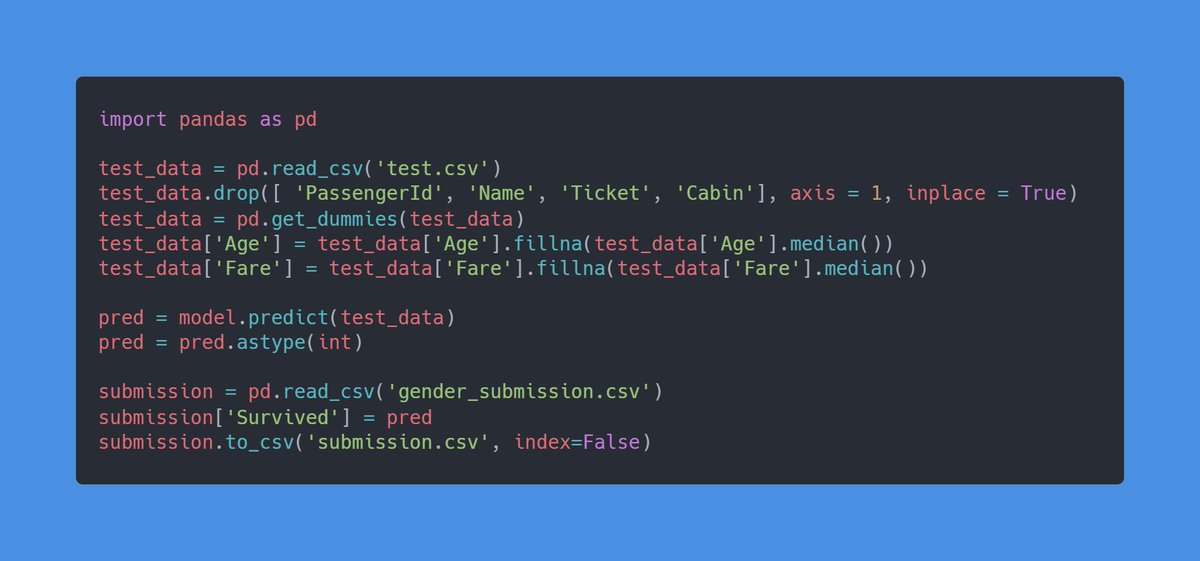
Now we can use this model to make predictions on the test data which we will submit to kaggle.
kaggle.com
kaggle.com
That is the end of thread, if liked it then follow me for more content like this.
In the next thread we will train a neural network to classify images of dogs and cats.
In the next thread we will train a neural network to classify images of dogs and cats.
Loading suggestions...