

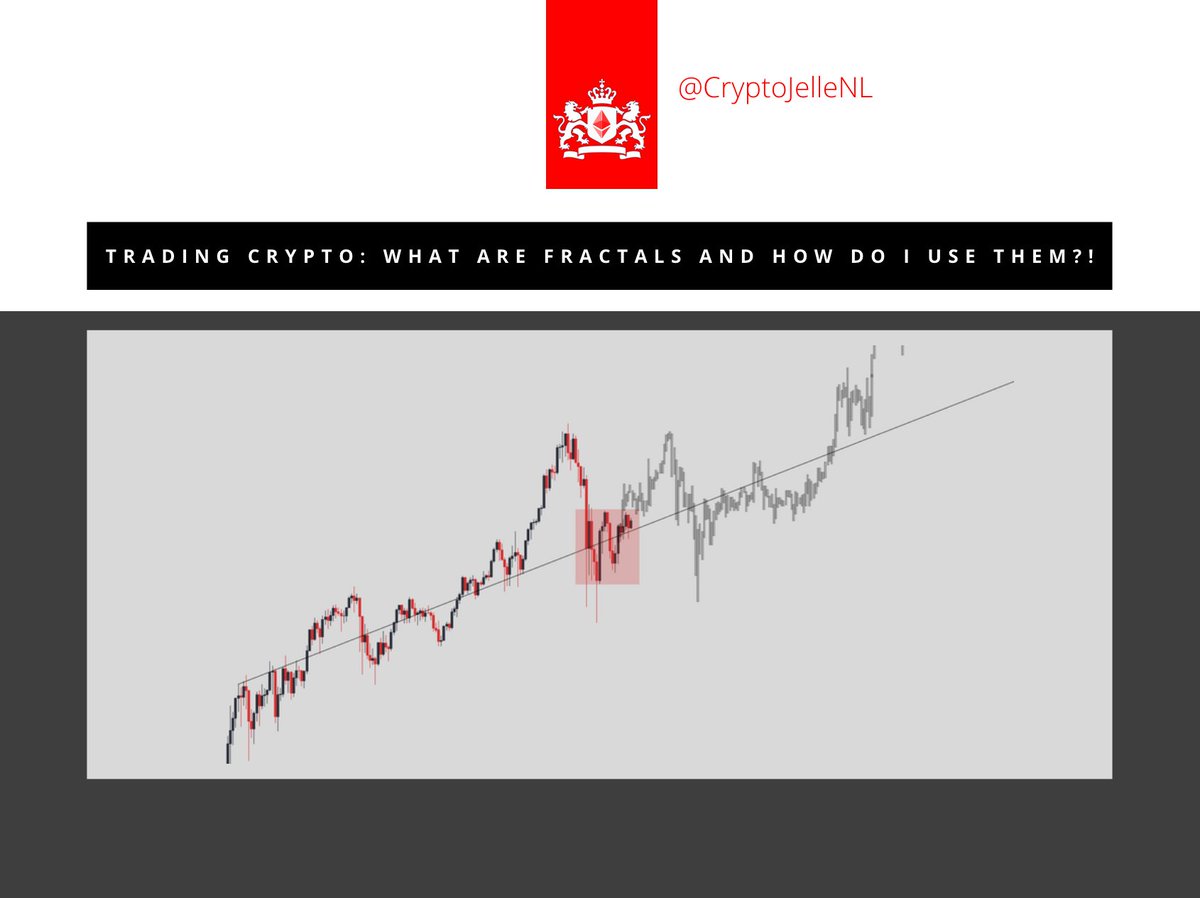
WHAT ARE FRACTALS AND HOW DO I USE THEM? 📈💰
In this thread, I'll explain what fractals are, how to use them, and how to get them on your chart.
Let's get into it! 📚
In this thread, I'll explain what fractals are, how to use them, and how to get them on your chart.
Let's get into it! 📚
Usual disclaimer, this thread, and all my other content is for entertainment purposes only. It does not constitute (financial) advice.
You are responsible for any action you take, in all aspects of life.
Act accordingly.
You are responsible for any action you take, in all aspects of life.
Act accordingly.
WHAT ARE FRACTALS?
Fractals are chart patterns from the past, pasted on the current chart.
They are not exclusive to crypto and are used all across the "technical analysis" board.
Fractals are chart patterns from the past, pasted on the current chart.
They are not exclusive to crypto and are used all across the "technical analysis" board.
Basically, you copy a piece of similar price history and paste it on the current, to see how price behaved back then.
You can compare price history from the same instrument, or a completely different one.
You can compare price history from the same instrument, or a completely different one.
HOW DO I USE THEM?
In the past few weeks, I've seen fractals being used to distribute hopium.
I did a little experiment myself, which resulted in 928 likes on the bullish fractal, while the bearish fractal only got 38.
Thats funny, because the bearish one matched PA better.
In the past few weeks, I've seen fractals being used to distribute hopium.
I did a little experiment myself, which resulted in 928 likes on the bullish fractal, while the bearish fractal only got 38.
Thats funny, because the bearish one matched PA better.
So yes, it's important to not just copy any part of a chart and make it work.
You can adjust fractals to make them fit the chart, but then you're really just making a chart tell you what you want it to say.
You can adjust fractals to make them fit the chart, but then you're really just making a chart tell you what you want it to say.
Generally, I look at price action and think "hey, this reminds me of back then and then".
I then copy PA from there to the current PA to see how similar it is, and how price progressed from there.
I then copy PA from there to the current PA to see how similar it is, and how price progressed from there.
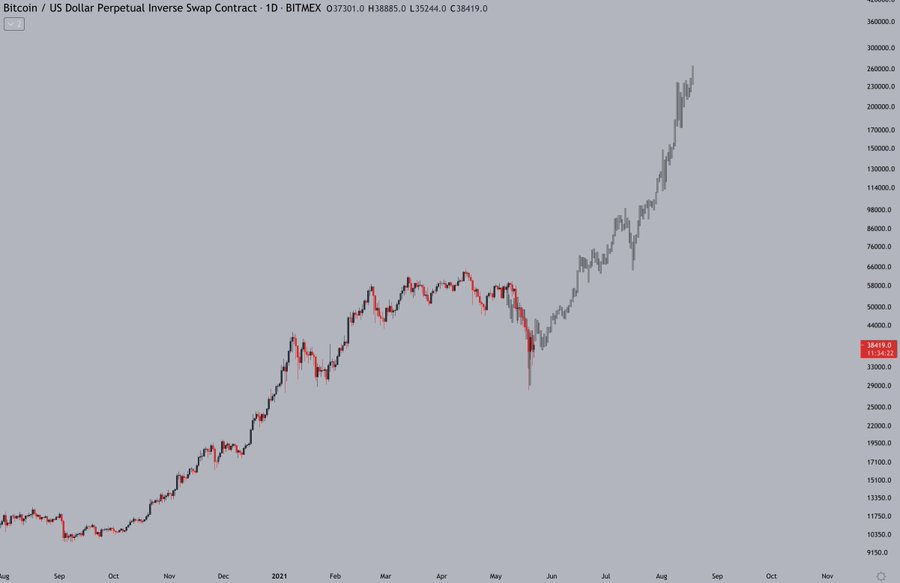
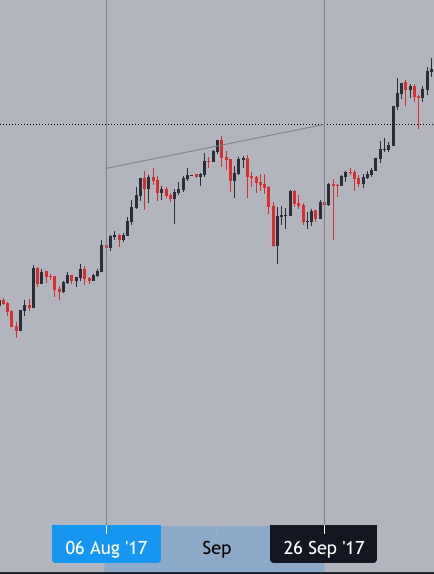
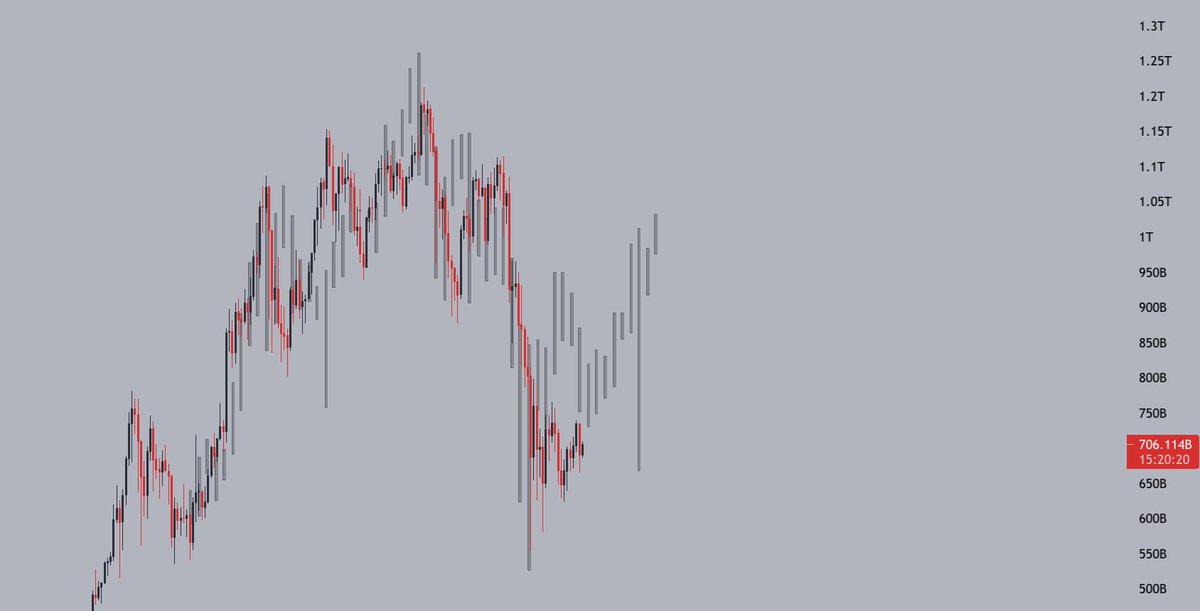
For example, I tweeted how the absorption of yesterday reminded me of the 12-10k drop.
The chart below shows the current PA with a fractal from back then.
As you can see, the price is still acting similar as it did back then, just on a different timeframe.
The chart below shows the current PA with a fractal from back then.
As you can see, the price is still acting similar as it did back then, just on a different timeframe.
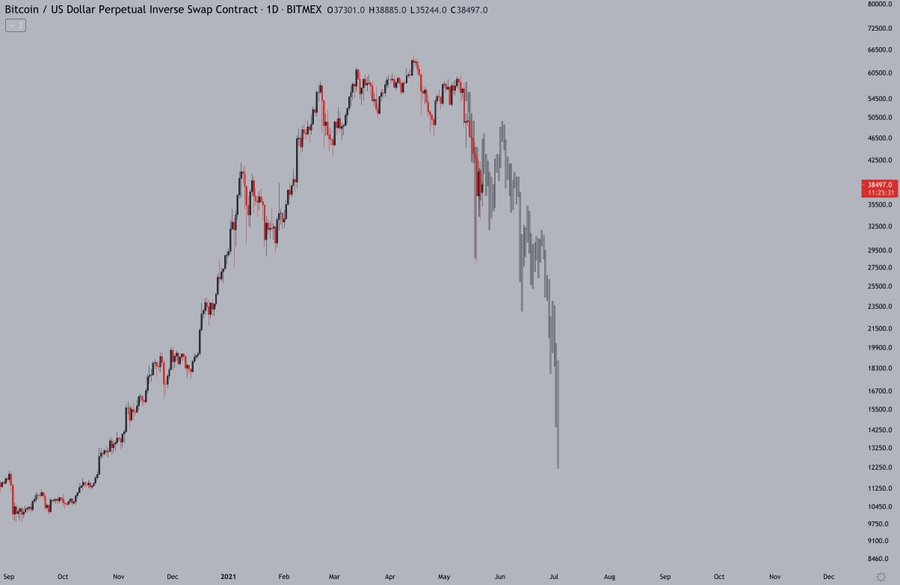
Now the fractal suggests we see some downside in the short term. Do I short? No.
I can trade if my regular triggers present, but I don't act on fractals alone.
They're just to help me study the behaviour of price in the past, not to form biases.
I can trade if my regular triggers present, but I don't act on fractals alone.
They're just to help me study the behaviour of price in the past, not to form biases.
OKAY, SO HOW DO I GET FRACTALS ON MY @TRADINGVIEW CHART?
Step one is to go to the chart history you want to compare to the current price action.
Then select "bars pattern" in the list with your RR tools.
See the picture below.
Step one is to go to the chart history you want to compare to the current price action.
Then select "bars pattern" in the list with your RR tools.
See the picture below.

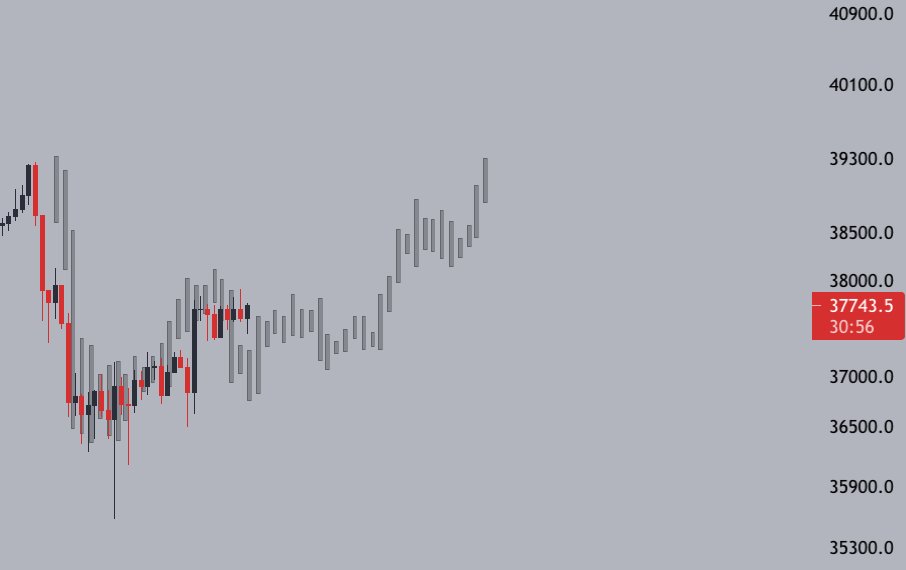
Step 3: Select the area of price action you wish to copy. Click left first, then right.
It then shows up on the chart.
It then shows up on the chart.
Step 4: place the fractal on the current price action.
You can either copy and paste it there, or click and drag.
You can either copy and paste it there, or click and drag.
From there, use the presented "fractal" as I discussed earlier in the thread. Fractals are - in my opinion - not to base trades on, but to study and compare price action.
They can add conviction though!
They can add conviction though!
Hope this explained it well. If you have questions, don't hesitate to ask.
Drop some fractals you found below!
- Jelle
Drop some fractals you found below!
- Jelle
Loading suggestions...