

PRICE ACTION IS KING.
Let me teach you something new and I'll use a live trade as example.
Go to your charts (tradingview dot com), navigate to the BTC charts and select 1D TF
Have you done that?
🚨 A THREAD 🚨
Let me teach you something new and I'll use a live trade as example.
Go to your charts (tradingview dot com), navigate to the BTC charts and select 1D TF
Have you done that?
🚨 A THREAD 🚨
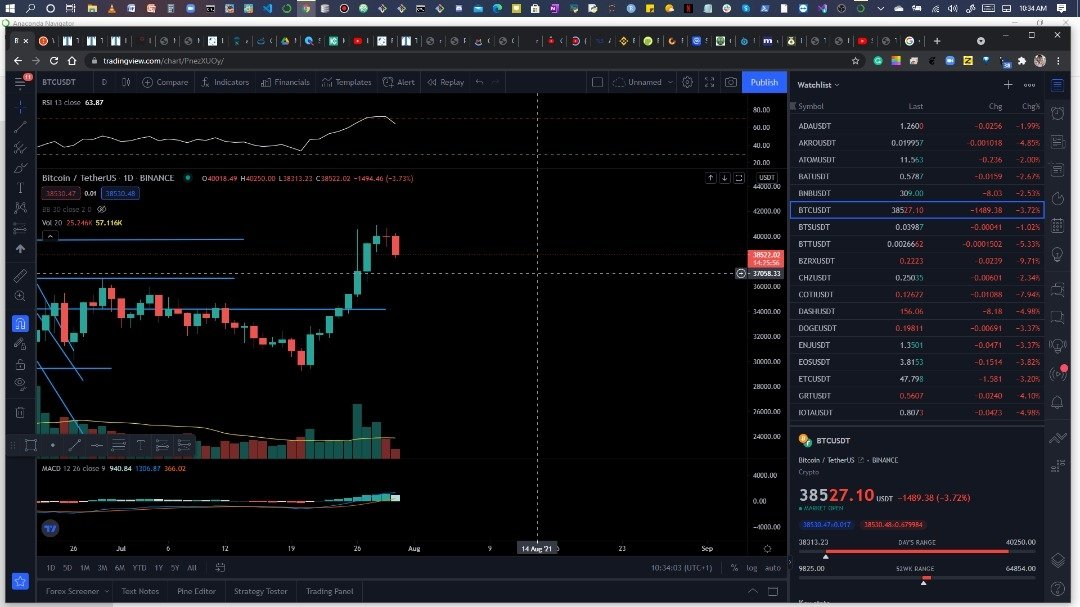
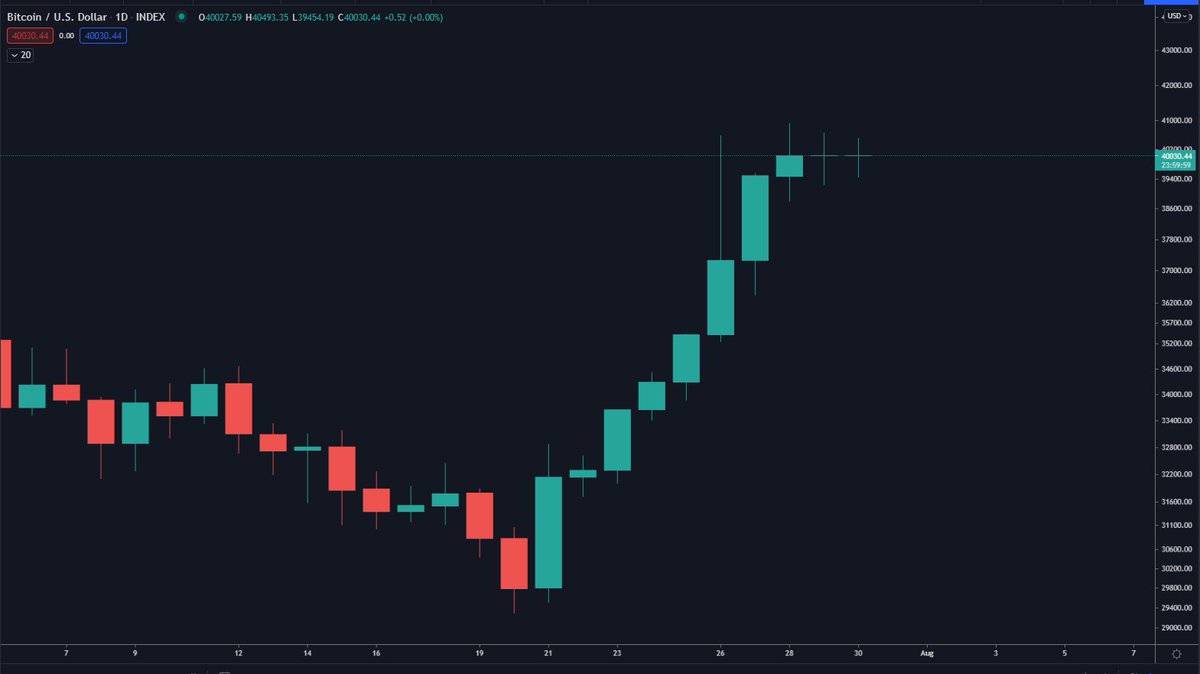
What do you see?
8 consecutive green candles and a candlestick without body seating just right on top. Do you know what that candlestick is called? A DOJI.
A Doji in simple terms is when buying pressure and selling pressure matches each other
8 consecutive green candles and a candlestick without body seating just right on top. Do you know what that candlestick is called? A DOJI.
A Doji in simple terms is when buying pressure and selling pressure matches each other
In Japanese, "doji" means blunder or mistake, referring to the rarity of having the open and close price be exactly the same.
What is the implication?
When a Doji appears right above consecutive green candles, it is an indication of trend reversal.
What is the implication?
When a Doji appears right above consecutive green candles, it is an indication of trend reversal.
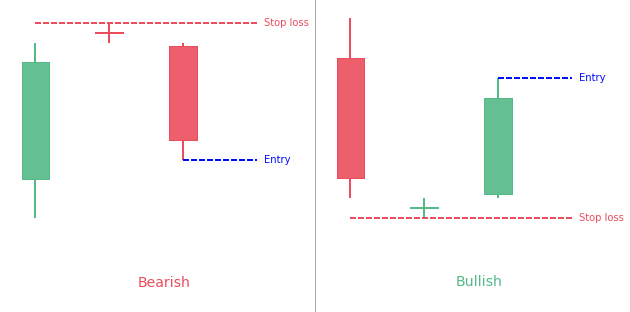
Doji Spirit: A Doji by itself is neither bullish nor bearish. But when it comes after other candles, it can have very powerful interpretations.
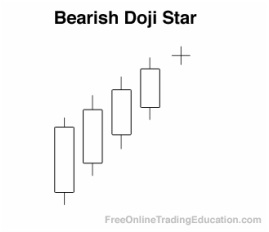
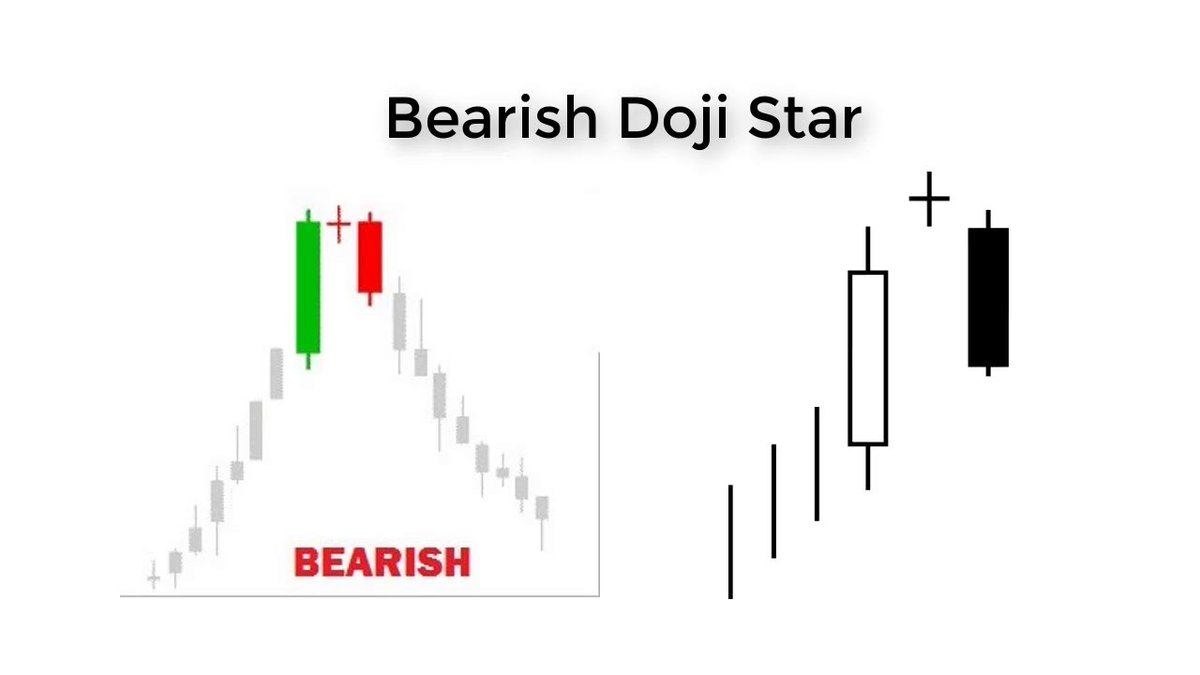
The Bearish Doji Star appears in an uptrend and belongs to the bearish reversal patterns group.
The Bearish Doji Star appears in an uptrend and belongs to the bearish reversal patterns group.

The Bearish Doji Star pattern is a three bar formation that develops after an up leg. The first bar has a long white body while the next bar then opens even higher and closes as a Doji with a small trading range.
The final bar then closes below the midpoint of the first day.
The final bar then closes below the midpoint of the first day.
For the past 10 weeks, we've see #BTC range between 29K and 35K levels.
If our bias remains, we're anticipating another range appearance and that's between 36K and 40K levels.
This is good for the market as it balances the uptrend move.
If our bias remains, we're anticipating another range appearance and that's between 36K and 40K levels.
This is good for the market as it balances the uptrend move.
Do with this information whatever you wish, boss!
PRICE ACTION IS KING
#NFA
By the way, I can teach you technical analysis extensively (feel free to send me a DM)
I also have a free telegram channel (link is in my bio)
PRICE ACTION IS KING
#NFA
By the way, I can teach you technical analysis extensively (feel free to send me a DM)
I also have a free telegram channel (link is in my bio)
Loading suggestions...