

I've been getting a lot of DM's lately from people asking for help with trading. So I decided to share my most used trading setups with a short explanation.
I will be updating this thread daily with setups and other helpful information, so make sure to follow.
Cheers! 🍻
I will be updating this thread daily with setups and other helpful information, so make sure to follow.
Cheers! 🍻
First things first. I'm not saying that I'm a pro trader, I will just share with you what helped me through the bull & the bear market.
None of the material should be considered as financial advice, it's considered for pure entertainment.
None of the material should be considered as financial advice, it's considered for pure entertainment.
1/n
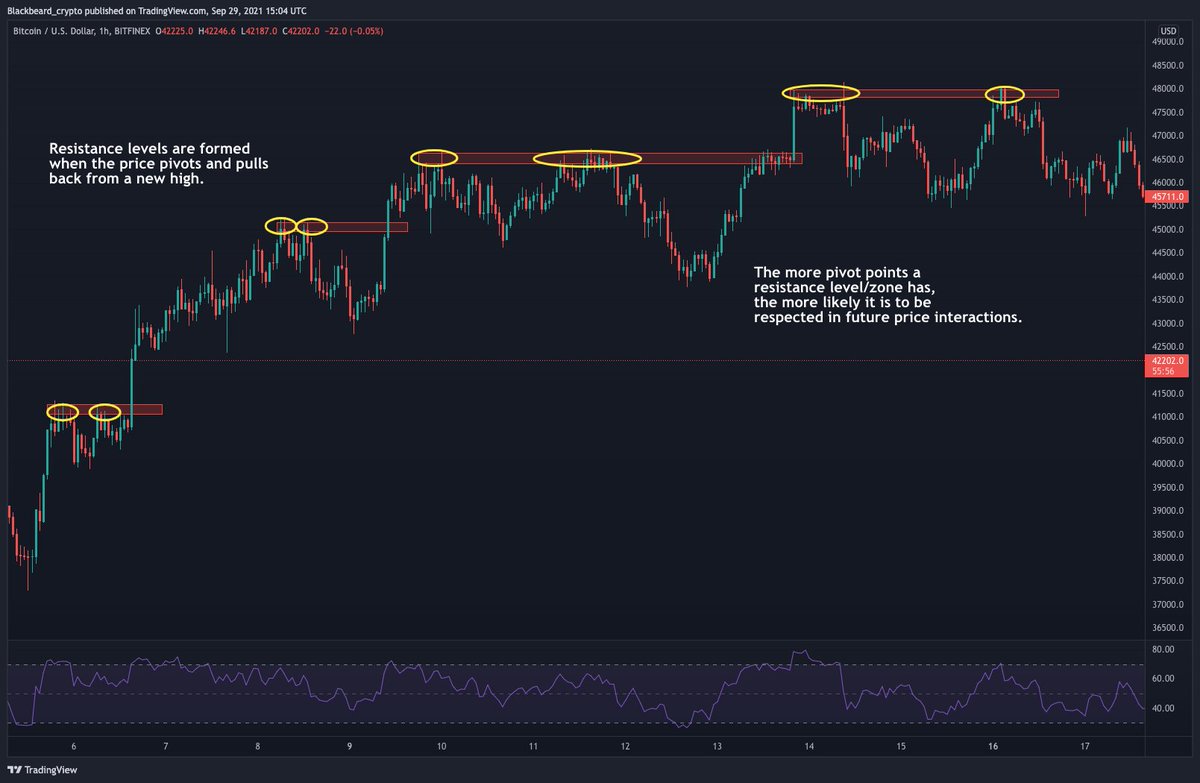
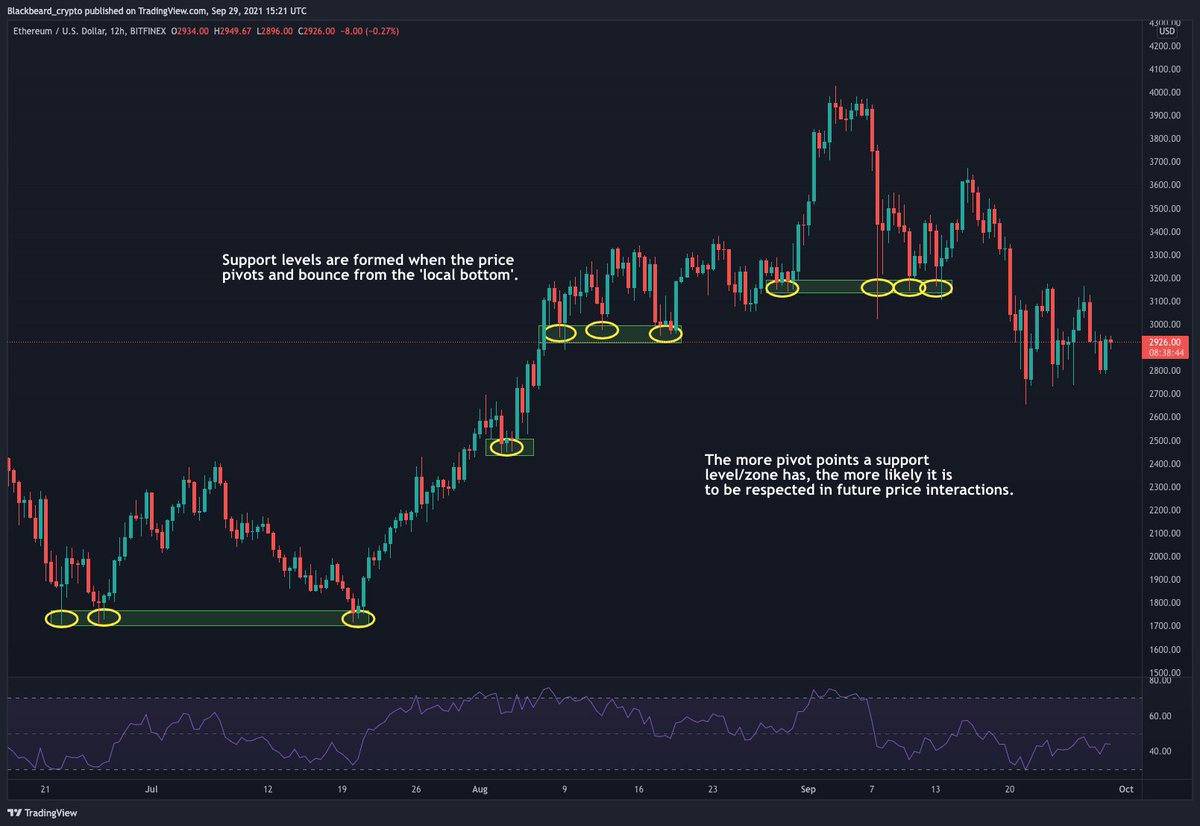
Resistance & Support Levels/Zones
Personally, I use 'zones' rather than concrete numbers to filter out false breakouts.
If you think this is helpful give it a like and share it with friends or let me know what do you want to see next.
Resistance & Support Levels/Zones
Personally, I use 'zones' rather than concrete numbers to filter out false breakouts.
If you think this is helpful give it a like and share it with friends or let me know what do you want to see next.
2/n
Ascending Triangle
An ascending triangle is a type of triangle chart pattern that occurs when there is a resistance level and a slope of higher lows.
Note: if the resistance level is too strong and there is insufficient buying power, it can also break to the downside.
Ascending Triangle
An ascending triangle is a type of triangle chart pattern that occurs when there is a resistance level and a slope of higher lows.
Note: if the resistance level is too strong and there is insufficient buying power, it can also break to the downside.

3/n
Descending Triangle
Descending triangles are the exact opposite of ascending triangles.
Note: If the support level is too strong and there is a lot of buying power, it can also break to the upside.
If you think this is helpful give it a like and share it with friends.
Descending Triangle
Descending triangles are the exact opposite of ascending triangles.
Note: If the support level is too strong and there is a lot of buying power, it can also break to the upside.
If you think this is helpful give it a like and share it with friends.

4/n
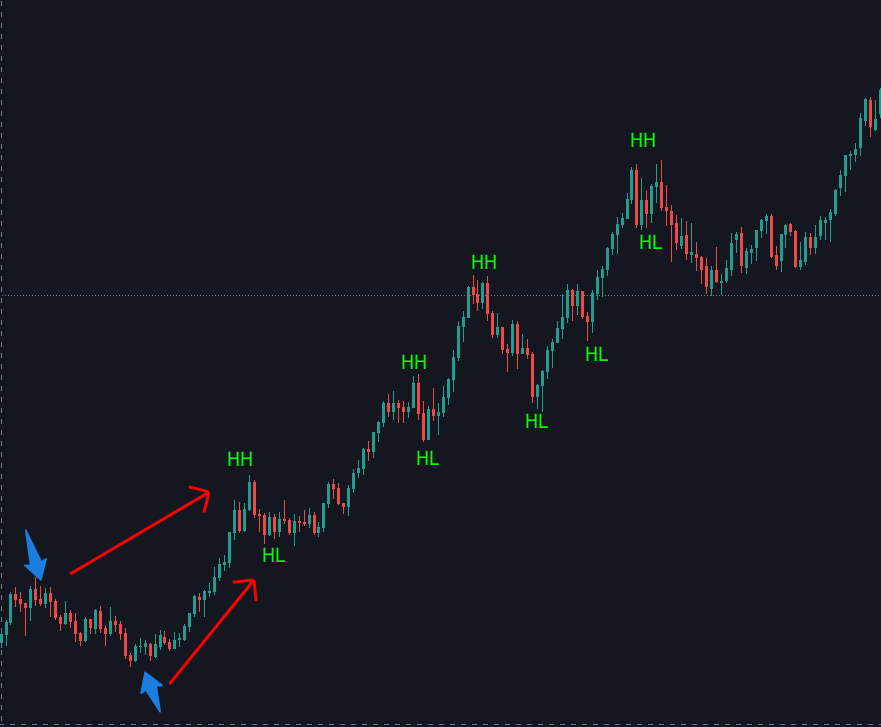
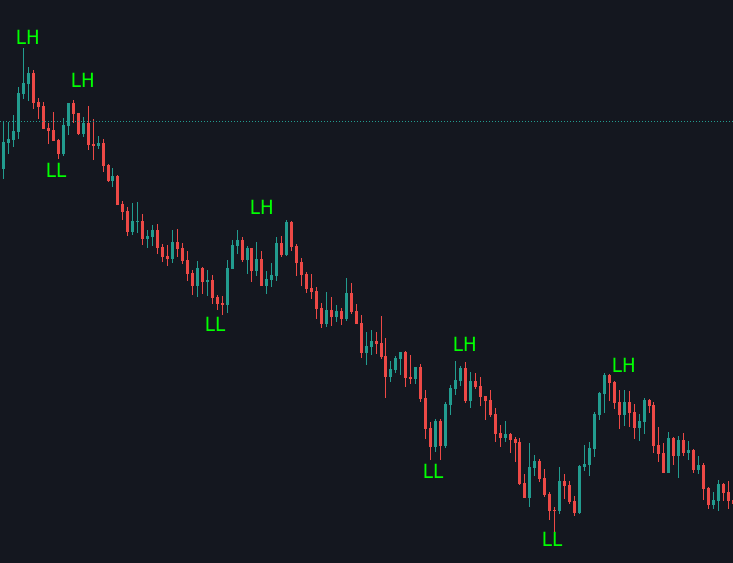
Three easy ways that helped me to spot trends.
𝗙𝗶𝗿𝘀𝘁 𝘄𝗮𝘆 - 𝗛𝗶𝗴𝗵𝗲𝗿 𝗛𝗶𝗴𝗵𝘀 𝗮𝗻𝗱 𝗟𝗼𝘄𝗲𝗿 𝗟𝗼𝘄𝘀
Uptrend: Look for higher highs and higher lows.
Downtrend: Look for lower highs and lower lows.
I often use trendlines but left them out for this example.
Three easy ways that helped me to spot trends.
𝗙𝗶𝗿𝘀𝘁 𝘄𝗮𝘆 - 𝗛𝗶𝗴𝗵𝗲𝗿 𝗛𝗶𝗴𝗵𝘀 𝗮𝗻𝗱 𝗟𝗼𝘄𝗲𝗿 𝗟𝗼𝘄𝘀
Uptrend: Look for higher highs and higher lows.
Downtrend: Look for lower highs and lower lows.
I often use trendlines but left them out for this example.
5/n
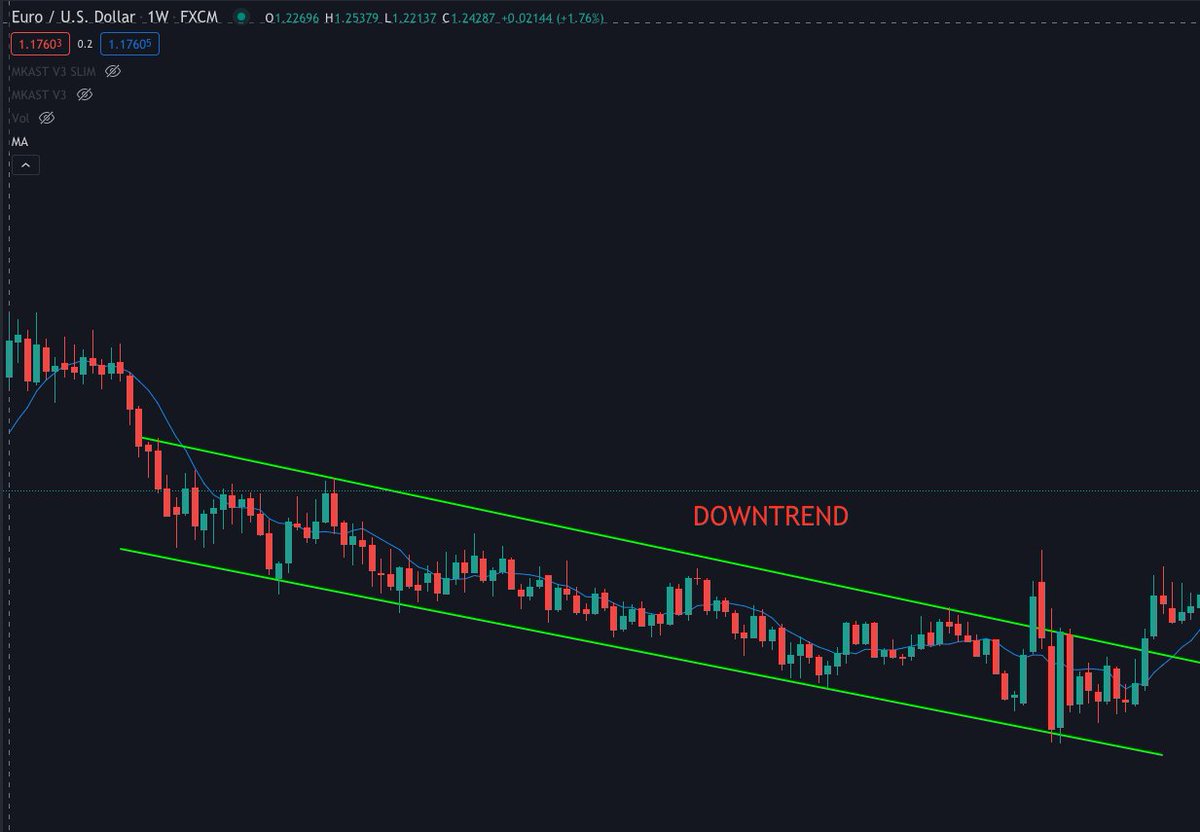
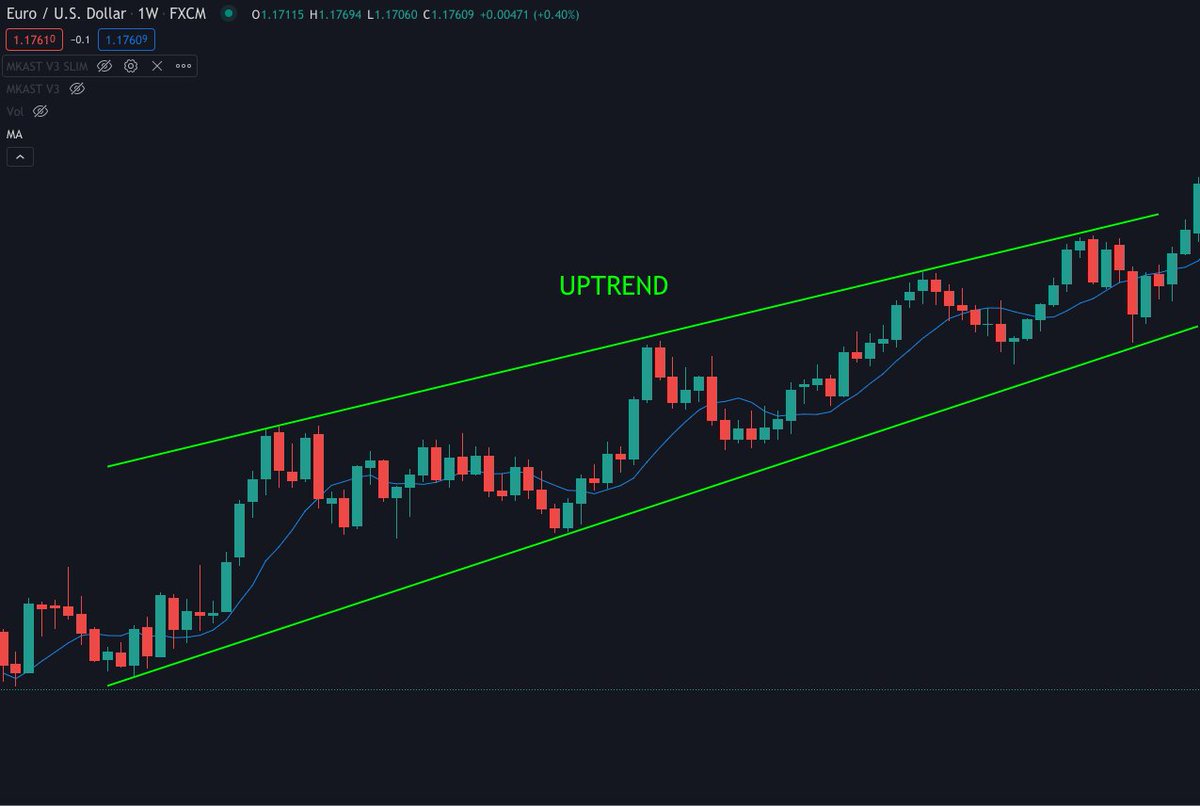
Second way - Trendlines
This is probably the easiest way to spot trends. Simply draw trendlines to spot an up-trending or down-trending channel.
It's not always perfect but it does its thing.
If you think this is helpful give it a like and share it with friends.
Second way - Trendlines
This is probably the easiest way to spot trends. Simply draw trendlines to spot an up-trending or down-trending channel.
It's not always perfect but it does its thing.
If you think this is helpful give it a like and share it with friends.
6/n
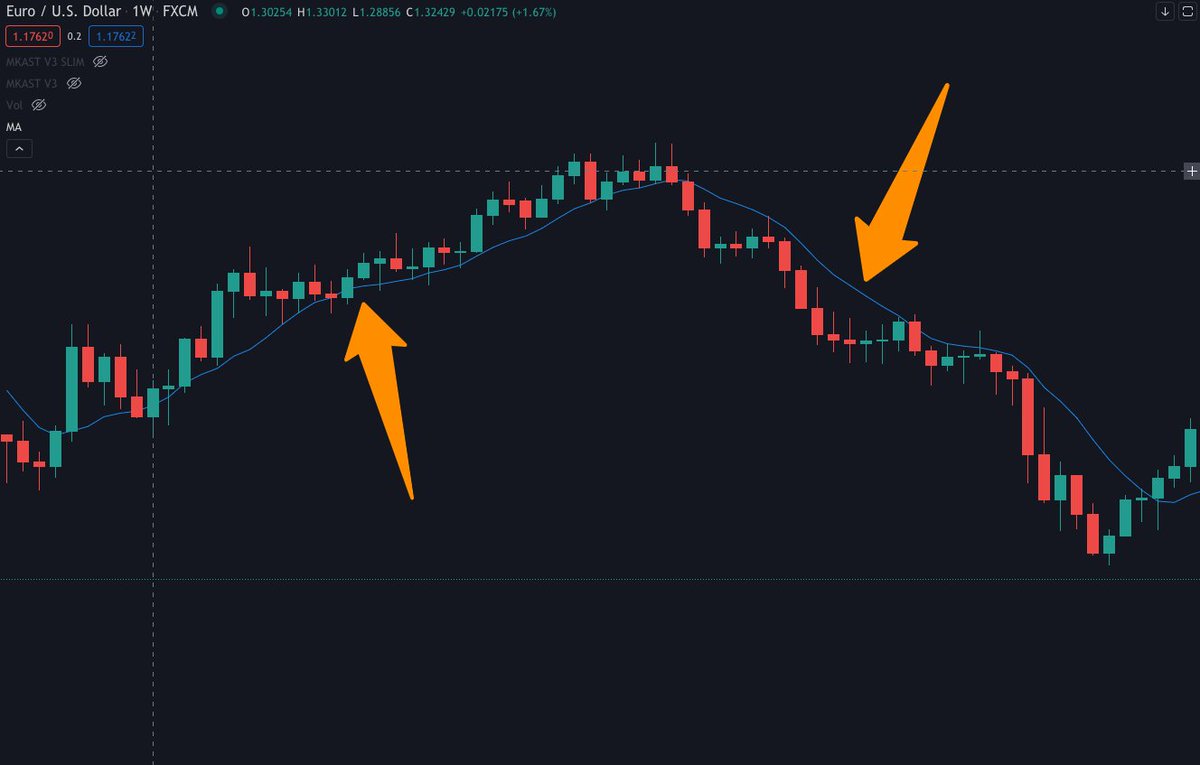
The third way - Moving Average (MA)
The MA is a great indicator to check if the moving average is supporting or resisting the price action.
If it supports the price the candles are printing HH's and HL's and vice versa.
As you can see all three ways support each other.
The third way - Moving Average (MA)
The MA is a great indicator to check if the moving average is supporting or resisting the price action.
If it supports the price the candles are printing HH's and HL's and vice versa.
As you can see all three ways support each other.
7/n
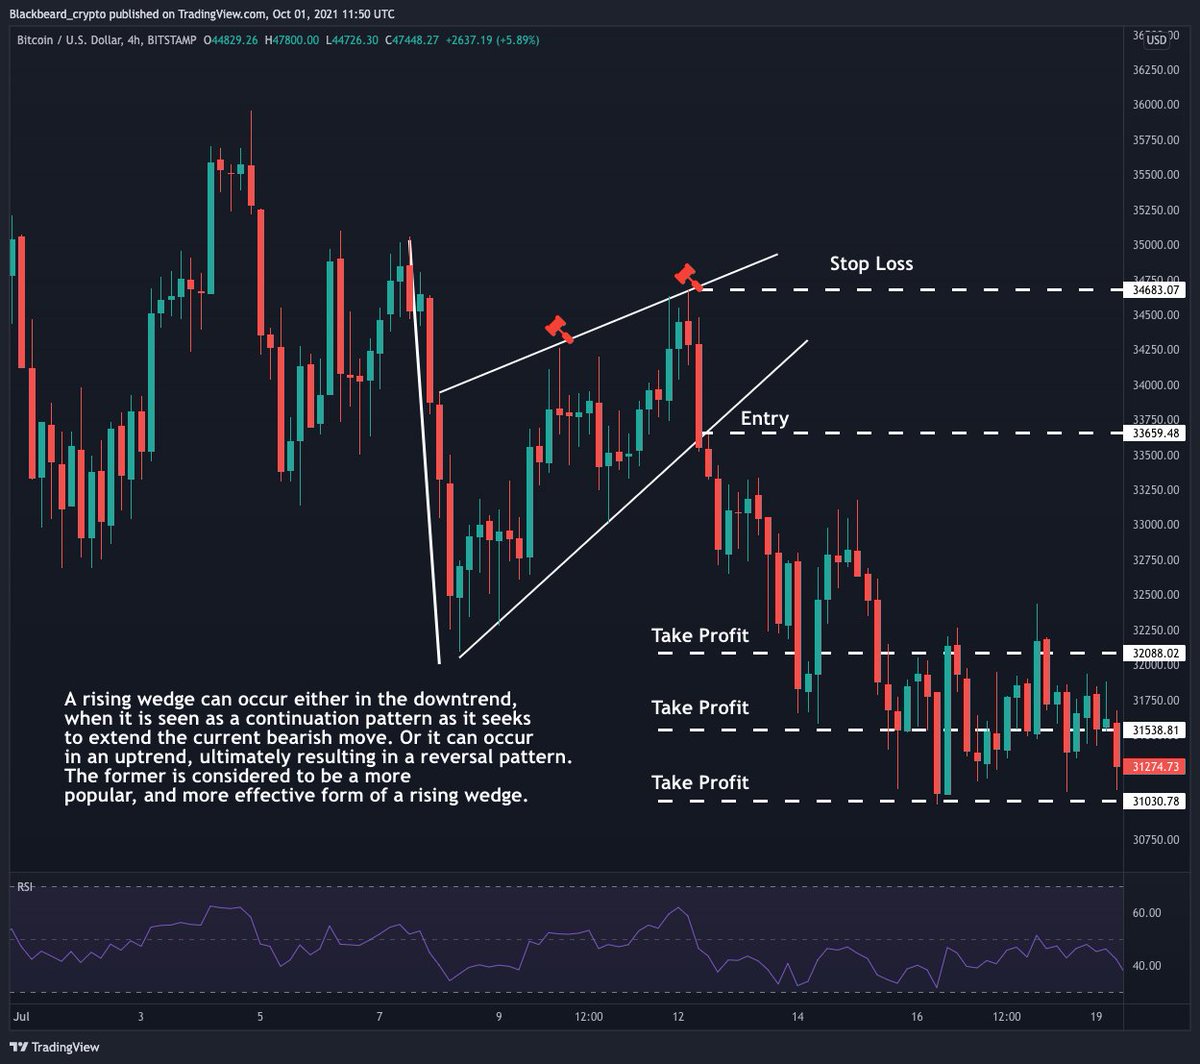
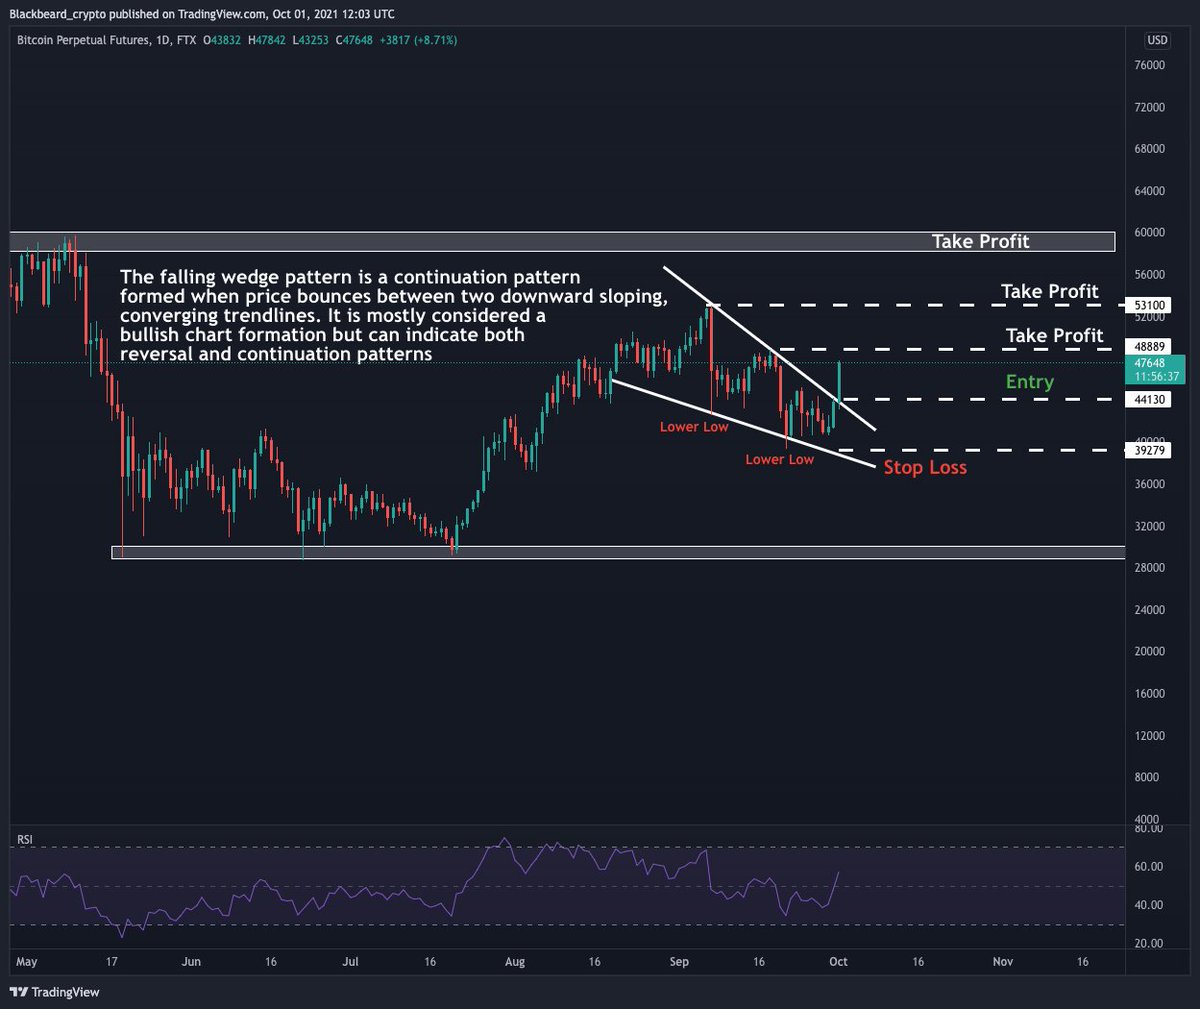
Wedge Patterns
These patterns are probably the patterns I trade the most and also made me the most money while trading them. They have pretty high accuracy imo.
The first one is the 'Rising Wedge' and is mostly considered as a bearish wedge pattern.
Wedge Patterns
These patterns are probably the patterns I trade the most and also made me the most money while trading them. They have pretty high accuracy imo.
The first one is the 'Rising Wedge' and is mostly considered as a bearish wedge pattern.
8/n
The second one is the 'Falling Wedge' and is mostly considered as a bullish wedge pattern.
We can actually see the pattern on the current 1D $BTC chart.
If you think this is helpful give it a like and share it with friends or let me know what do you want to see next.
The second one is the 'Falling Wedge' and is mostly considered as a bullish wedge pattern.
We can actually see the pattern on the current 1D $BTC chart.
If you think this is helpful give it a like and share it with friends or let me know what do you want to see next.
9/n
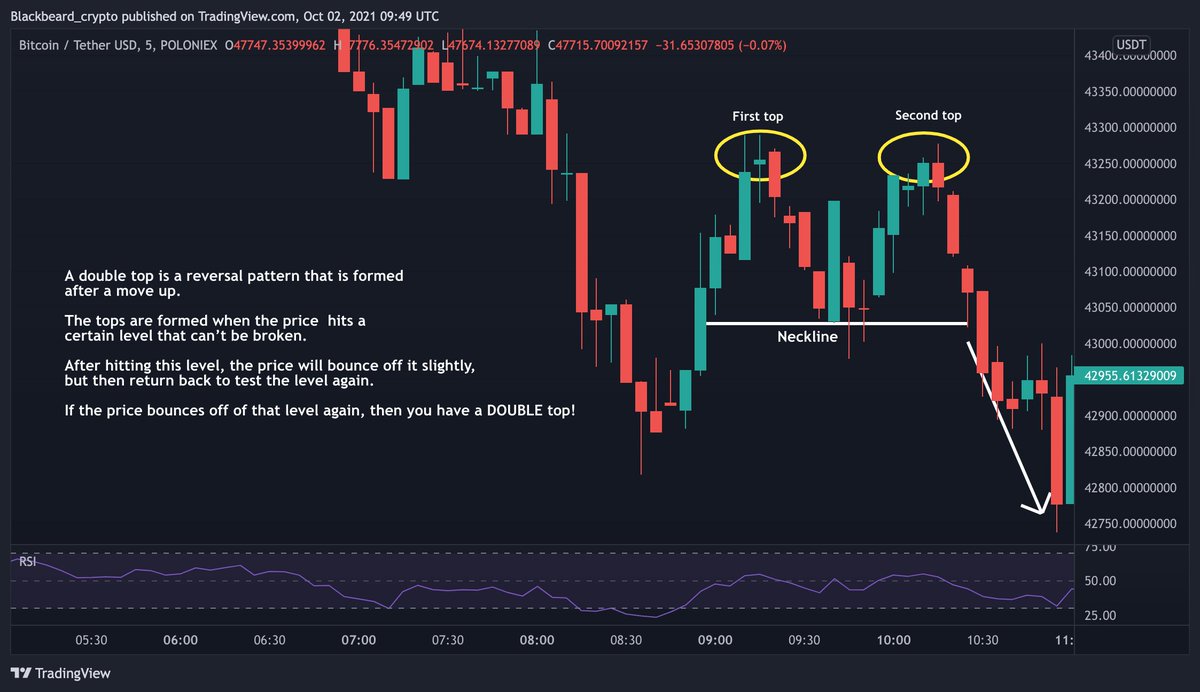
Double Top
Personally, I don't use this much because I think this pattern doesn't fit for crypto most of the time since it's a volatile market, but if you spot it, I think it's good to watch it, and if it breaks the neckline to short it for some quick bucks.
Double Top
Personally, I don't use this much because I think this pattern doesn't fit for crypto most of the time since it's a volatile market, but if you spot it, I think it's good to watch it, and if it breaks the neckline to short it for some quick bucks.
10/n
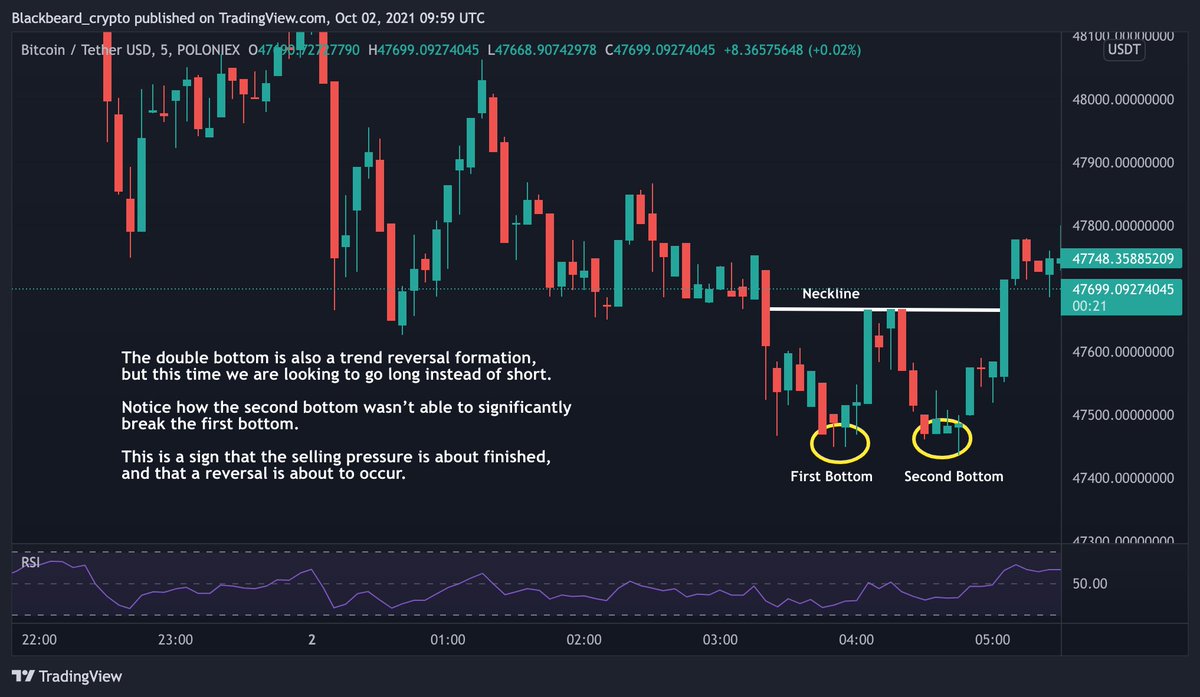
Double Bottom
This pattern is basically the opposite of the previous pattern. More explanation is in the picture below.
If you think this is helpful give it a like and share it with friends or let me know what do you want to see next.
Double Bottom
This pattern is basically the opposite of the previous pattern. More explanation is in the picture below.
If you think this is helpful give it a like and share it with friends or let me know what do you want to see next.
11/n
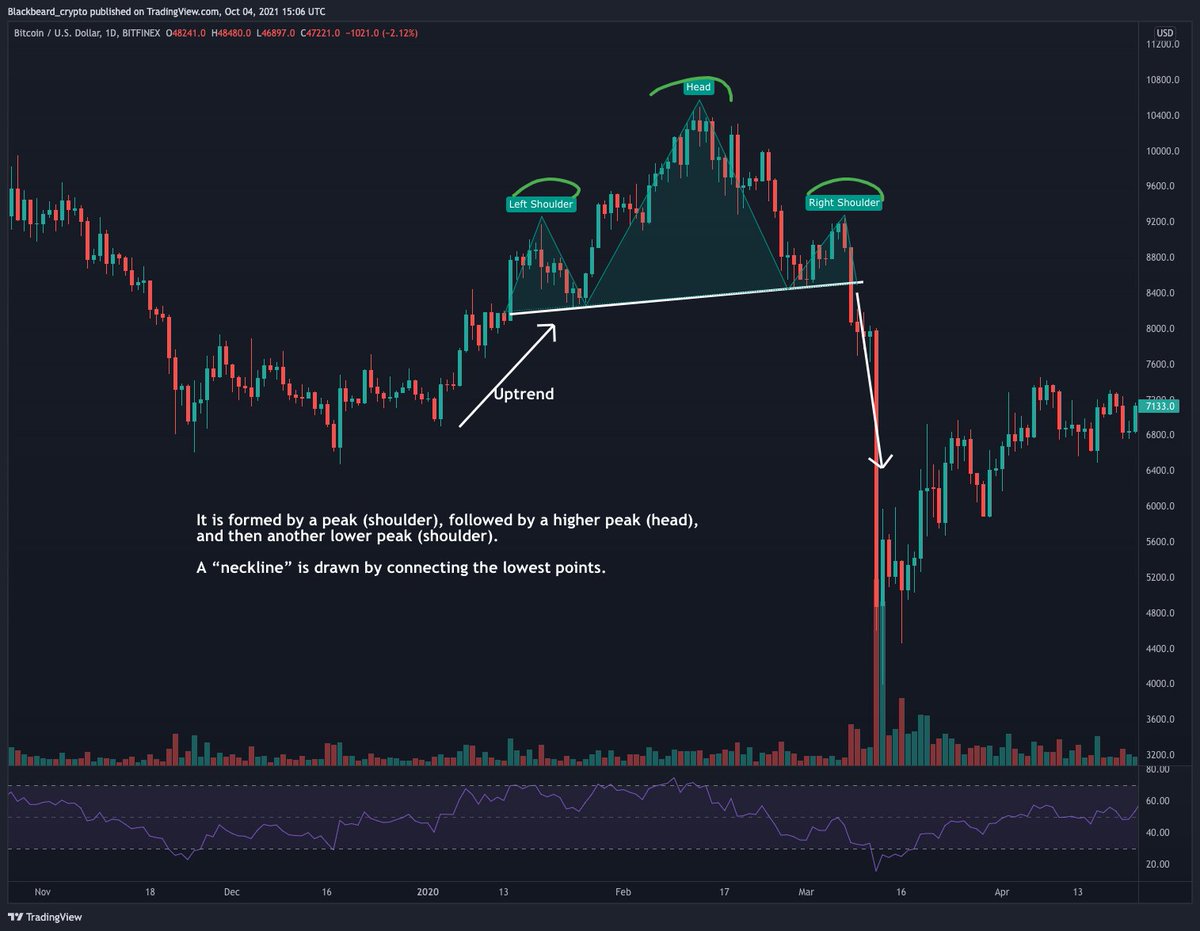
Head and Shoulders (H&S)
This chart pattern is a reversal pattern and is most often seen in uptrends. Personally, I trade them only on higher time frames (1D) but they take some time to form but you can also spot them on lower time frames as well.
Head and Shoulders (H&S)
This chart pattern is a reversal pattern and is most often seen in uptrends. Personally, I trade them only on higher time frames (1D) but they take some time to form but you can also spot them on lower time frames as well.
12/n
Inverted Head and Shoulders
The name speaks for itself. It is basically an H&S formation, except this time it’s upside down. 🙃
The information in the previous tweet also applies here.
If you think this is helpful give it a like and share it with friends.
Inverted Head and Shoulders
The name speaks for itself. It is basically an H&S formation, except this time it’s upside down. 🙃
The information in the previous tweet also applies here.
If you think this is helpful give it a like and share it with friends.

Loading suggestions...