

Analyzing BTC's price action without using on-chain data is like valuing a company without using its financials
On-chain data is BTC's ultimate valuation tool
Just published “A Framework for Valuing BTC” w/ @kenoshaking feat 5 new ARK on-chain indicators
ark-invest.com
On-chain data is BTC's ultimate valuation tool
Just published “A Framework for Valuing BTC” w/ @kenoshaking feat 5 new ARK on-chain indicators
ark-invest.com

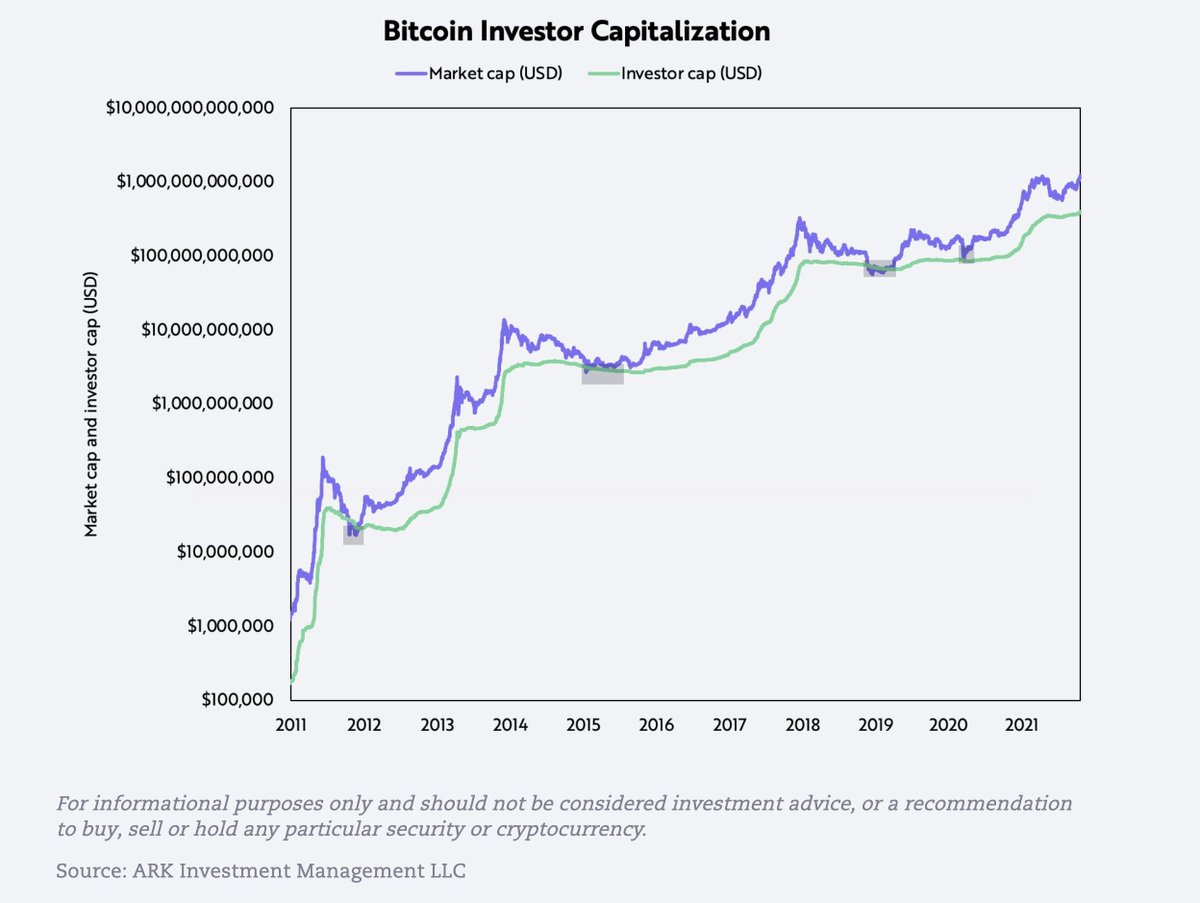
1. Investor capitalization
Investor cap is a good gauge of capitulation during bear markets.
By removing the outstanding value paid to miners (thermo cap) from overall cost basis (realized cap), we can assess the fair value of bitcoin at the bottom of a market cycle.
Investor cap is a good gauge of capitulation during bear markets.
By removing the outstanding value paid to miners (thermo cap) from overall cost basis (realized cap), we can assess the fair value of bitcoin at the bottom of a market cycle.
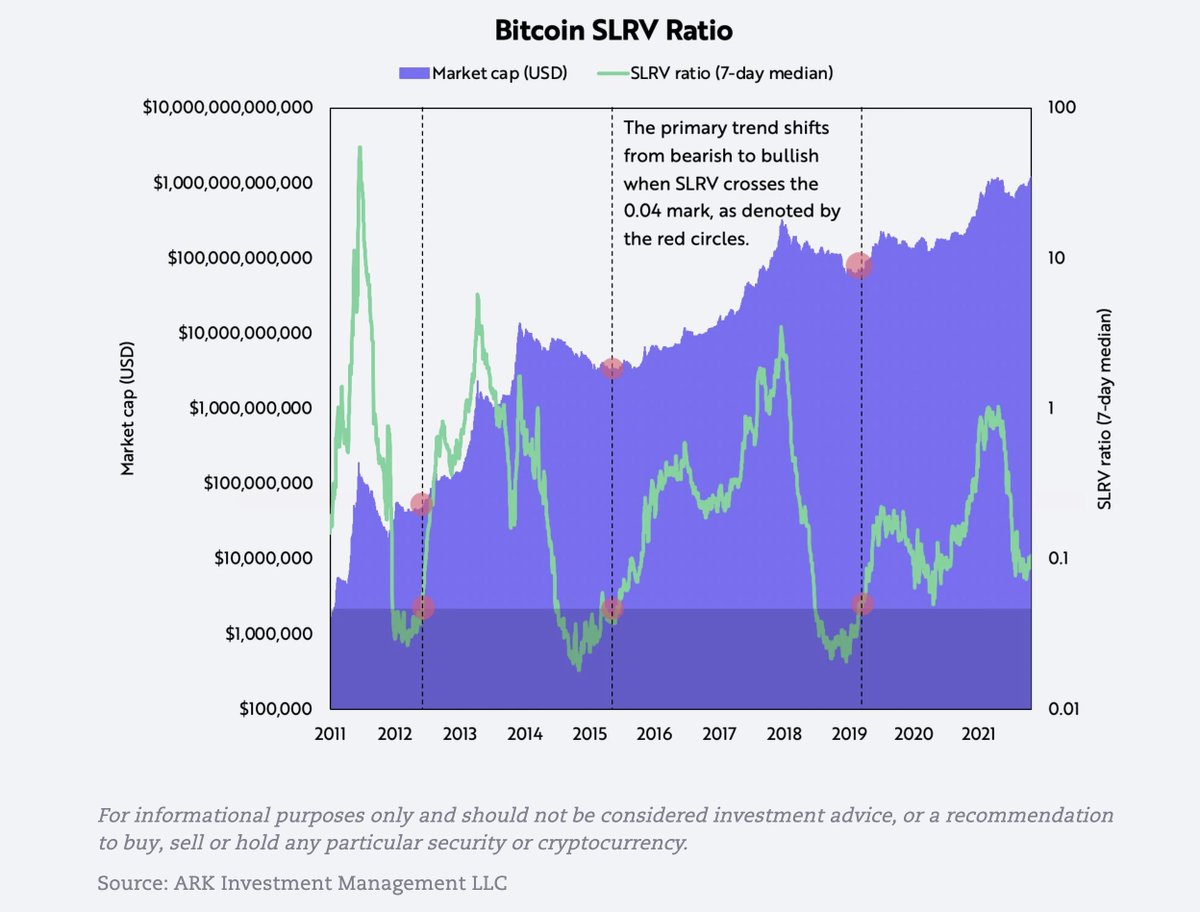
2. Short-to-Long-Term-Realized-Value (SLRV)
SLRV divides 1-day HODL wave by the 6-month-to-1-yr HODL wave, both weighted by realized cap. This metric compares short term velocity relative to medium/long-term velocity
SLRV moving above .04 signals the start of a bull market
SLRV divides 1-day HODL wave by the 6-month-to-1-yr HODL wave, both weighted by realized cap. This metric compares short term velocity relative to medium/long-term velocity
SLRV moving above .04 signals the start of a bull market
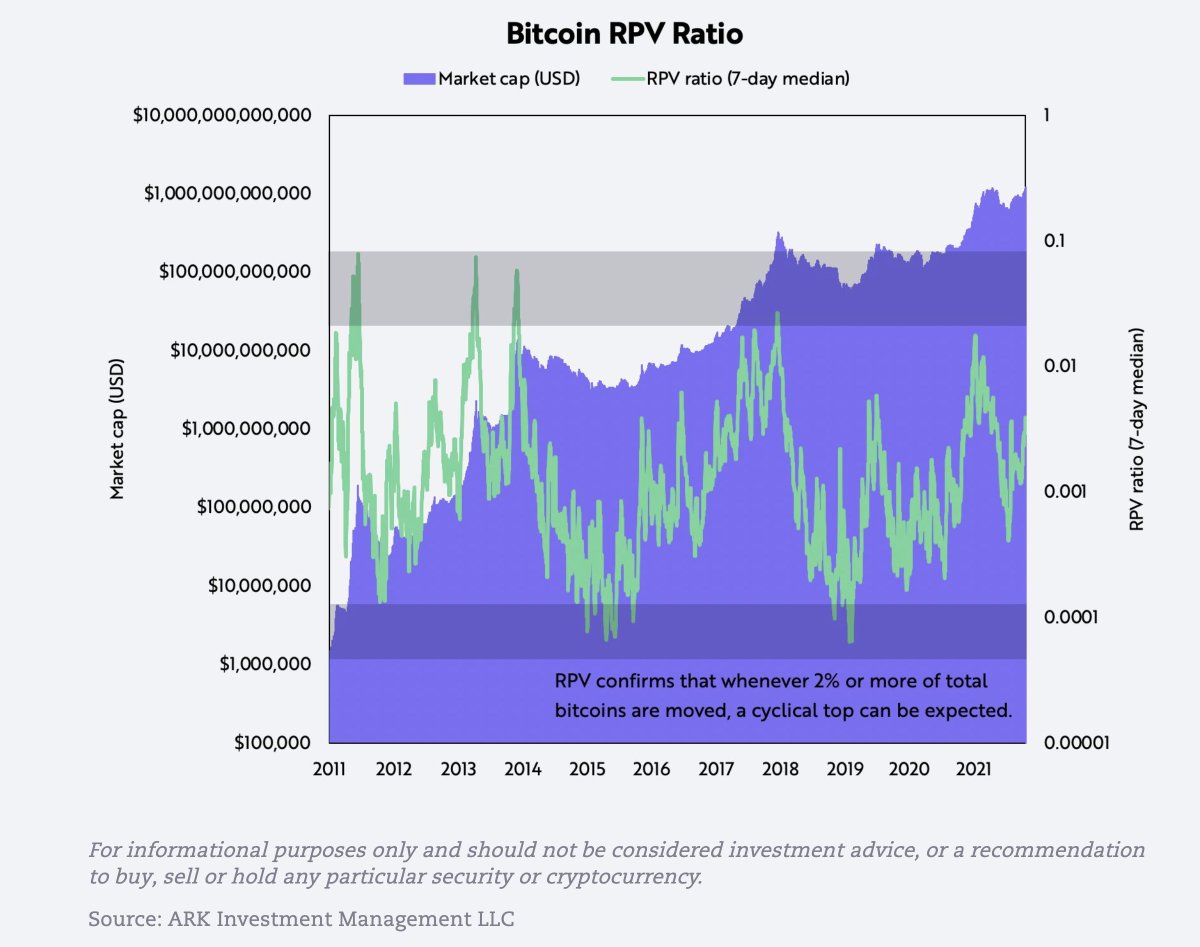
3. Realized Profits-to-Value Ratio (RPV)
RPV is realized on-chain profits in USD / by realized cap, measuring the difference between daily profit-taking behavior & cost basis
Historically, when profit-takers have moved >2% of their btc in 1 day, the market hits a cyclical top.
RPV is realized on-chain profits in USD / by realized cap, measuring the difference between daily profit-taking behavior & cost basis
Historically, when profit-takers have moved >2% of their btc in 1 day, the market hits a cyclical top.
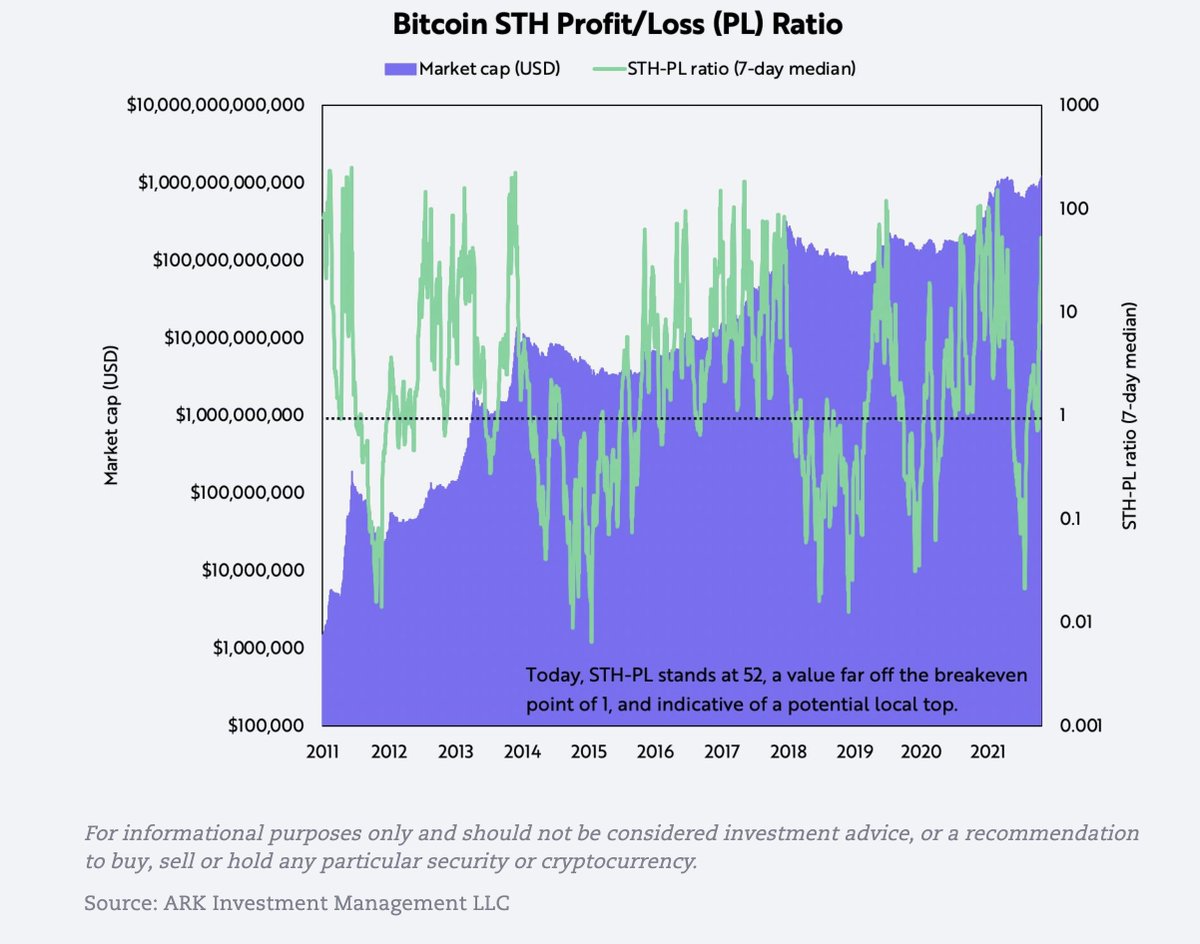
4. Short-Term-Holder Profit/Loss Ratio
STH P/L ratio is the short-term supply of bitcoin at a profit divided by the short-term supply at a loss. A ratio of 1 typically is associated with local bottoms in bull markets and local tops in bear markets.
STH P/L ratio is the short-term supply of bitcoin at a profit divided by the short-term supply at a loss. A ratio of 1 typically is associated with local bottoms in bull markets and local tops in bear markets.
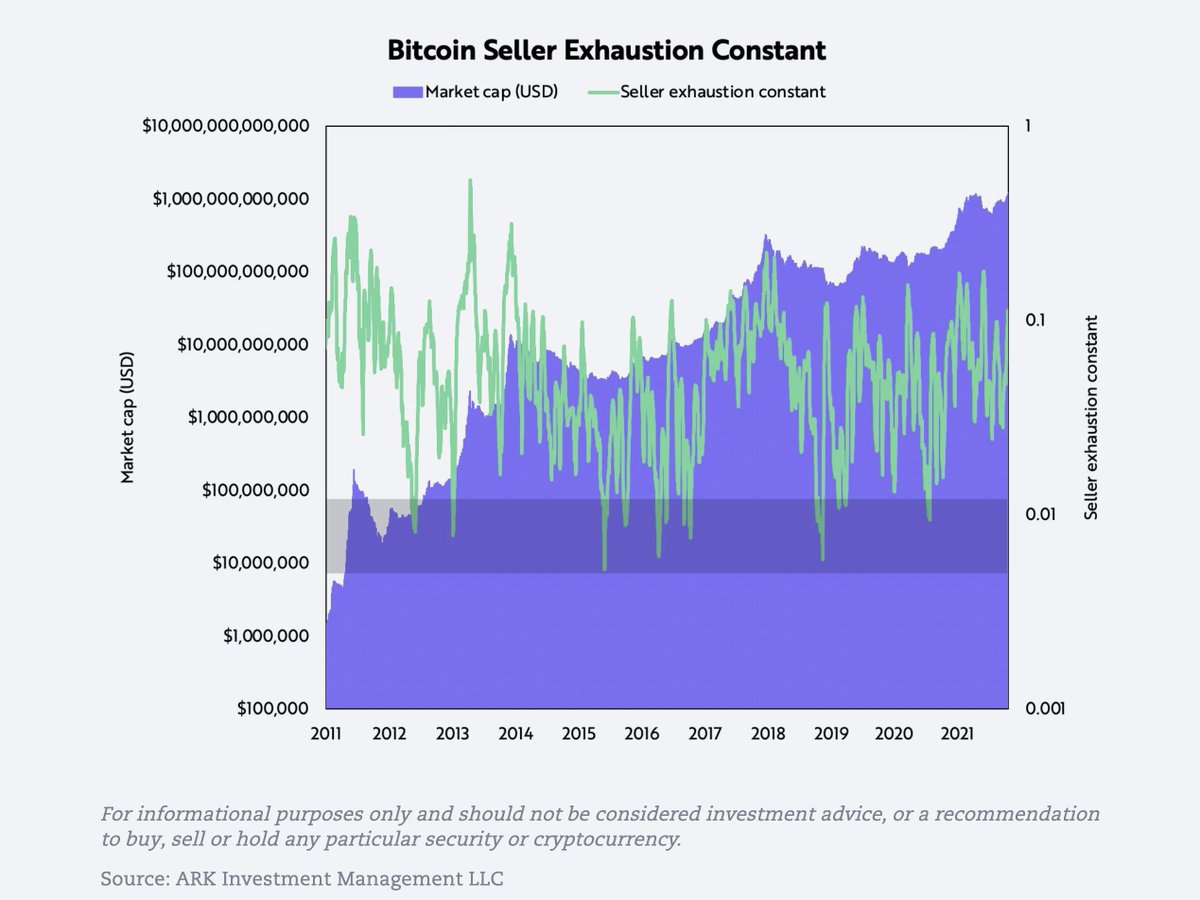
5. Seller Exhaustion Constant
The seller exhaustion constant is the % of bitcoin total circulating supply in profit multiplied by its volatility over the last 30 days. The combination of low volatility and high losses is associated with a bottoming out of the bitcoin price.
The seller exhaustion constant is the % of bitcoin total circulating supply in profit multiplied by its volatility over the last 30 days. The combination of low volatility and high losses is associated with a bottoming out of the bitcoin price.
All of these metrics are now live on @glassnode:
Investor Cap: studio.glassnode.com
SLRV: studio.glassnode.com
RPV: studio.glassnode.com
Seller Exhaustion: studio.glassnode.com
Investor Cap: studio.glassnode.com
SLRV: studio.glassnode.com
RPV: studio.glassnode.com
Seller Exhaustion: studio.glassnode.com
studio.glassnode.com/metrics?a=BTC&…
studio.glassnode.com/metrics?a=BTC&…
studio.glassnode.com/metrics?a=BTC&…
Glassnode Studio - On-Chain Market Intelligence
Glassnode Studio is your gateway to on-chain data. Explore data and metrics across the most popular...
studio.glassnode.com/metrics?a=BTC&…
Glassnode Studio - On-Chain Market Intelligence
Glassnode Studio is your gateway to on-chain data. Explore data and metrics across the most popular...
Loading suggestions...