

Posting Comparative Chart of NF and BNF. U will see NF made a high of approx 17240 at 12 noon and then went to 17100 by 2.15 PM while BNF made 36468 at 12 noon and then went to 36130 by 2.15 PM. U can clearly see while NF was going down, BNF was holding fort.
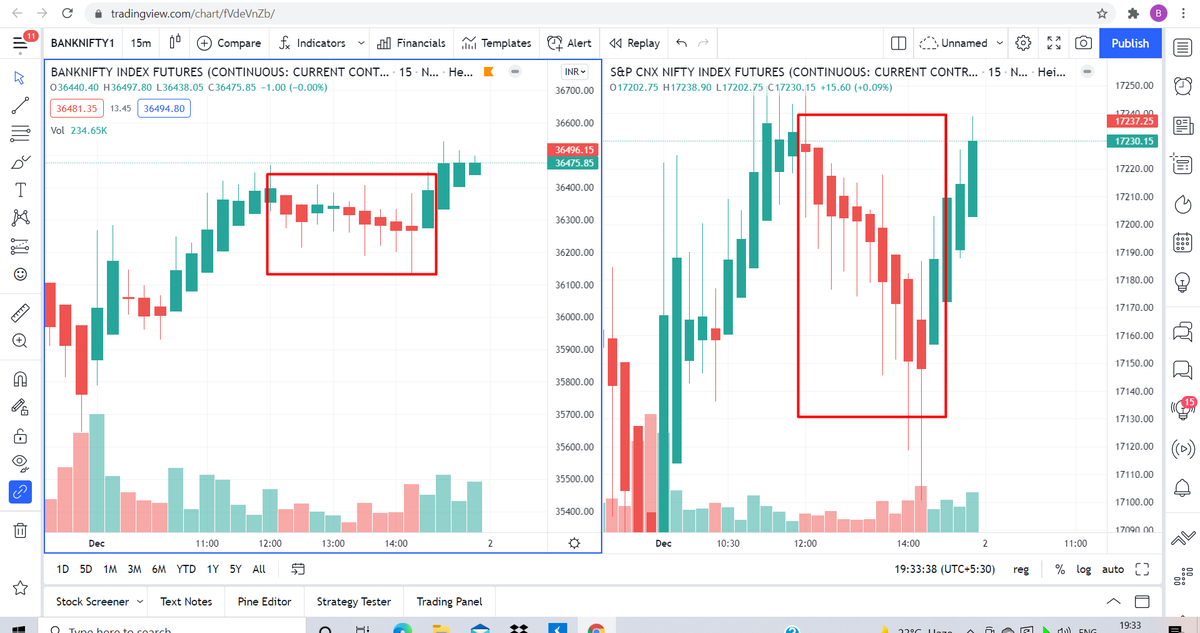
With both index showing divergence moves, it becomes very difficult for intraday traders to manage trades. So lets see what was happening in ATM of both NF and BNF throughout the day.
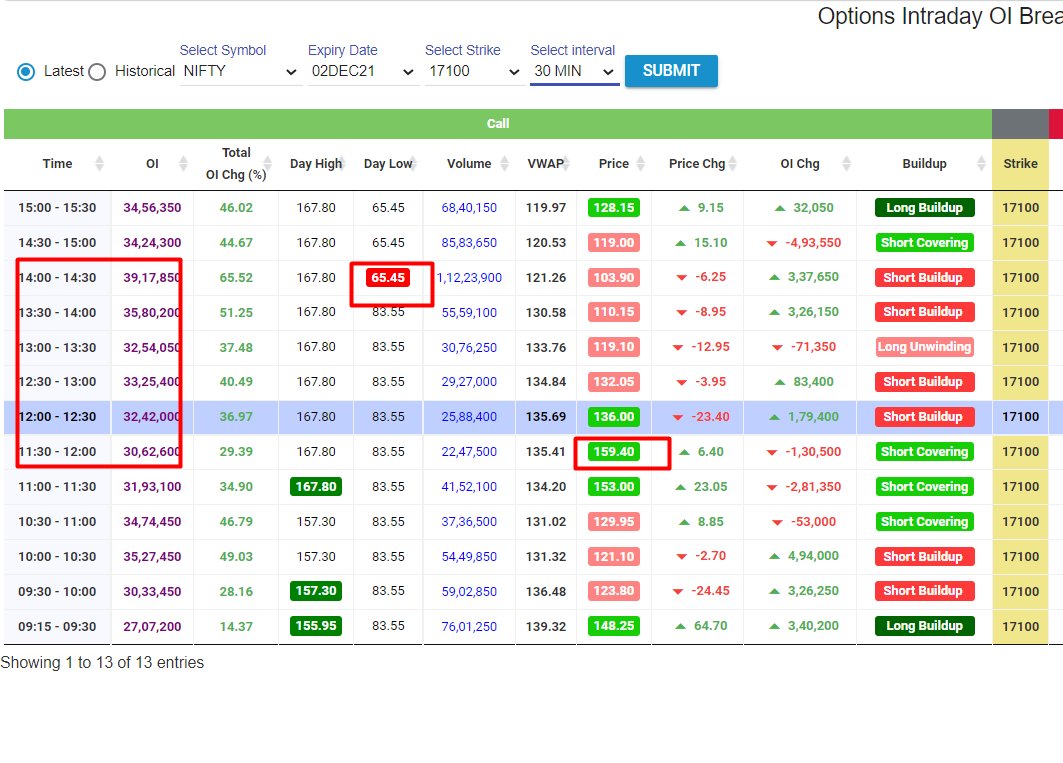
17100CE OI started increasing frm 11.30 AM from 30 lk to 39 lk by 2.30 PM, showing clear rise
17100CE OI started increasing frm 11.30 AM from 30 lk to 39 lk by 2.30 PM, showing clear rise
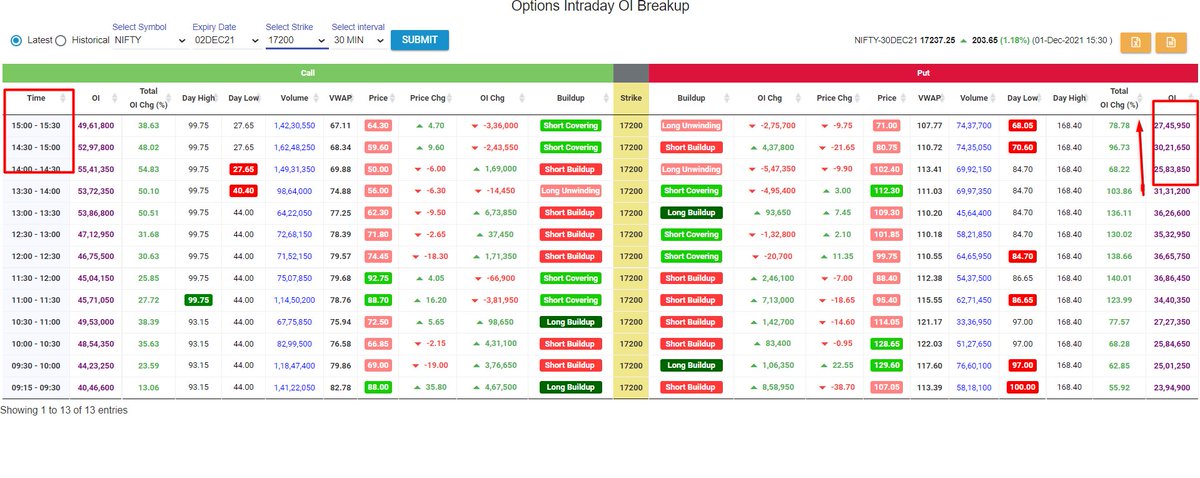
in ITM CE during the day. Now lets see what happened at ITM PE of 17200 around 2.30 PM. The PE Oi decreased from 31 lk to 25 Lk but then again started rising at 2.30, clearly saying that downmove in Nifty wont sustain.
Lets see what was happening in BNF 36000 and 36500 strike during the day. On 36500 strike concentrate on PE side. You will see throughout the day OI was increasing giving clear indication that sooner than later BNF will blast up.
On 36000 strike, u can see that CE writer were
On 36000 strike, u can see that CE writer were
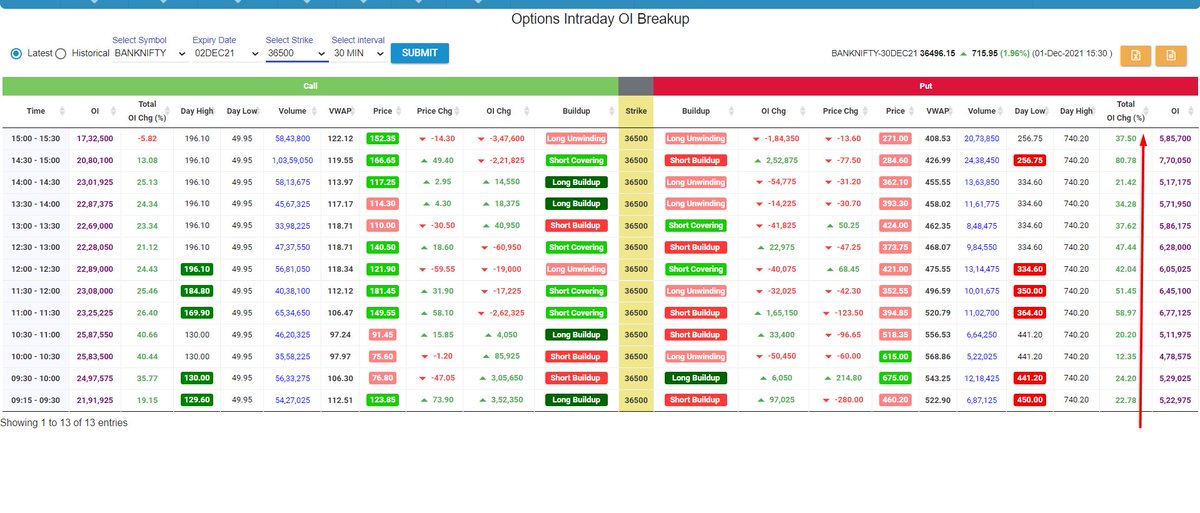
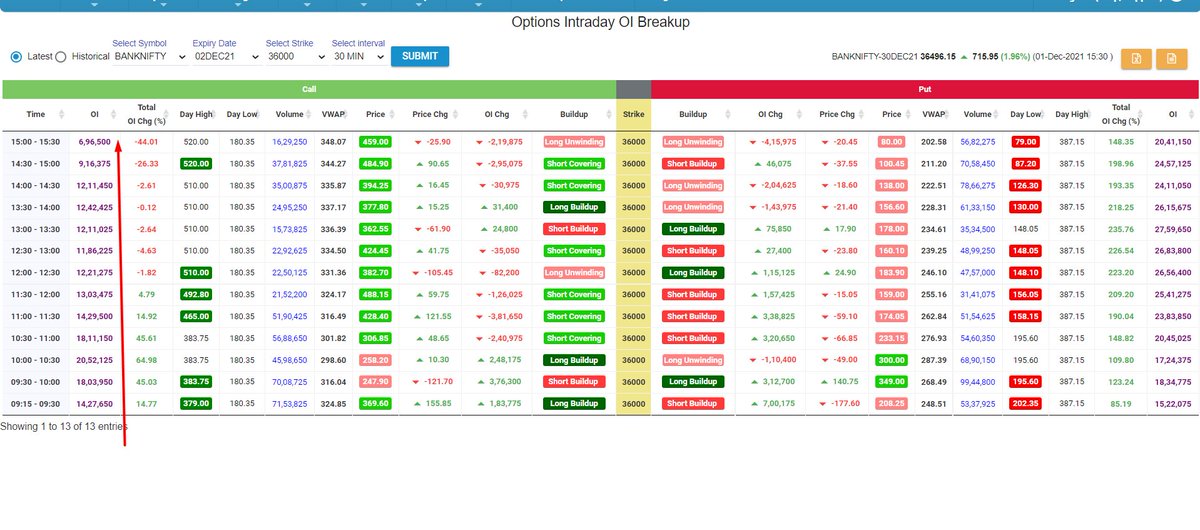
running away. A clear sign that upmove should come.
This we need to do in live market. If we can do these analysis, then chances of our losses will decrease to some extent.
Hope all these helps
This we need to do in live market. If we can do these analysis, then chances of our losses will decrease to some extent.
Hope all these helps
Loading suggestions...