

After the great success of CVD thread ( here is another tool that gets beaten to death nowadays on Twitter. Footprint charts, lets go into another thread (not using the stupid emoji this time)
what is it? Footprint chart is a tool developed by Marketdelta in 2003, since it is a trademarked name you won't see name "footprint" on any other platform, you will of ten see cluster charts, number bars and so on, they are all the same thing.
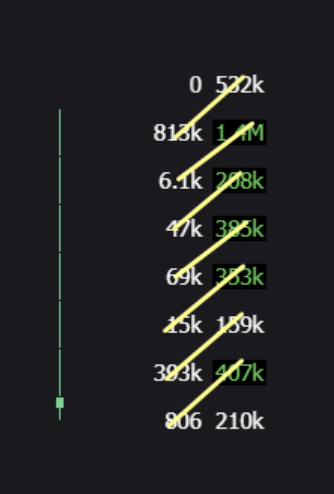
The footprint chart essentially shows the same thing as CVD but in a different style. It shows the number of trades executed at bid and the offer for every single price point.

Although most people assume those trades are executed horizontally, it is not true, if you watch a DOM and see how prices are executed, you will see this relationship is diagonal as there is always a spread in price.
Why this is not a holy grail of trading? Footprint became an orderflow educators holy grail for sure, this "see inside the candle" motto is an awesome tool how to lure retail in to pay thousands of dollars for courses.
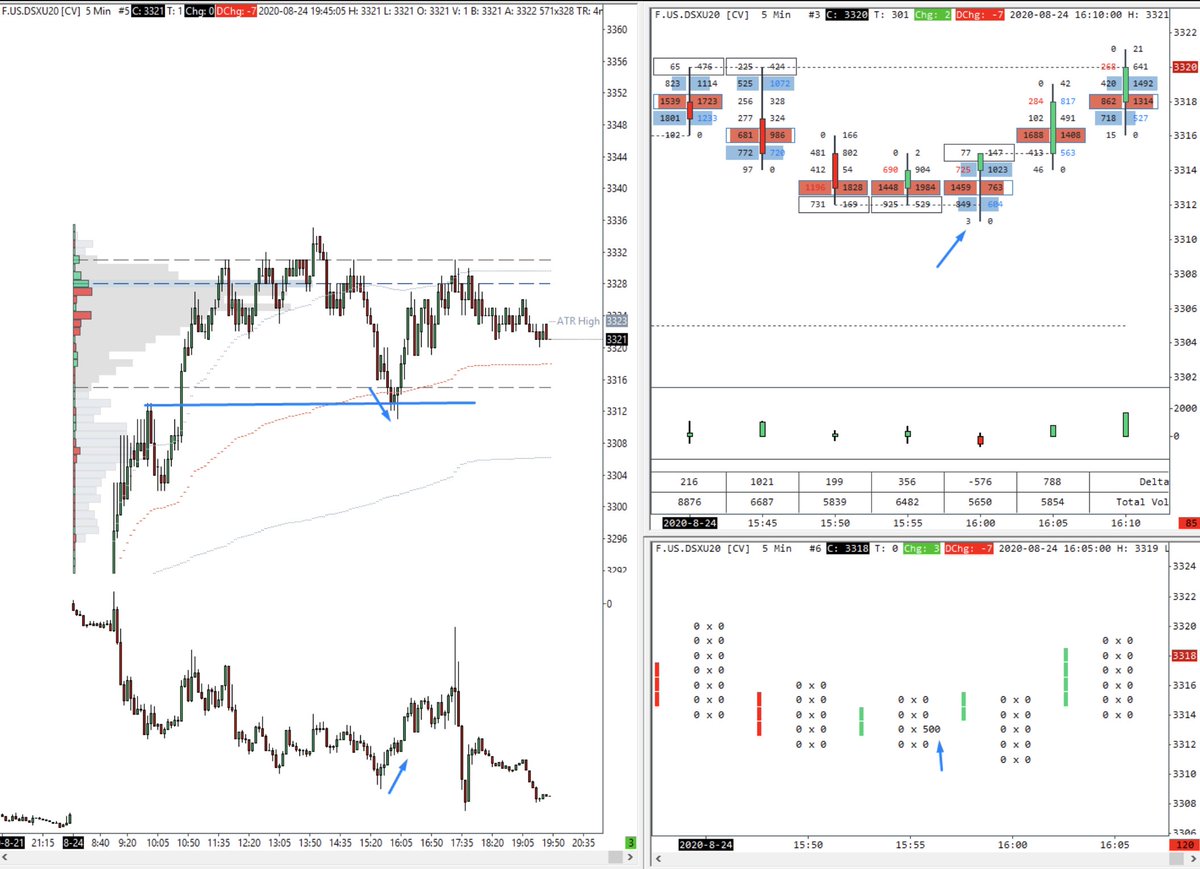
Once again the problem is the same as with CVD being orderflow fragmentation, also in thinner markets, you will very easily lose a bigger picture as you are forced to increase the tick size of the Footprint.
For me, this is one of the less used tools, especially in crypto. I see many many people posting daily or hourly footprints now, there is a very little edge in that.
Why there is edge there? Imo the biggest edge in footprint is in very thick markets such as bonds or if you trade crypto you need to focus on very quick nontime-based rotations to be really able to see patterns footprint has to offer.
Before I mention these patterns lets cover the "easy mode" for footprint, I would not personally move above 30min chart, but once understand the delta you can use a simple footprint to see where buying and selling is taking place and how the market reacts to it.

This way you can spot strong breakouts but also the areas where buyers or sellers tried to step in but got absorbed by the heavier hand being the limit orders.
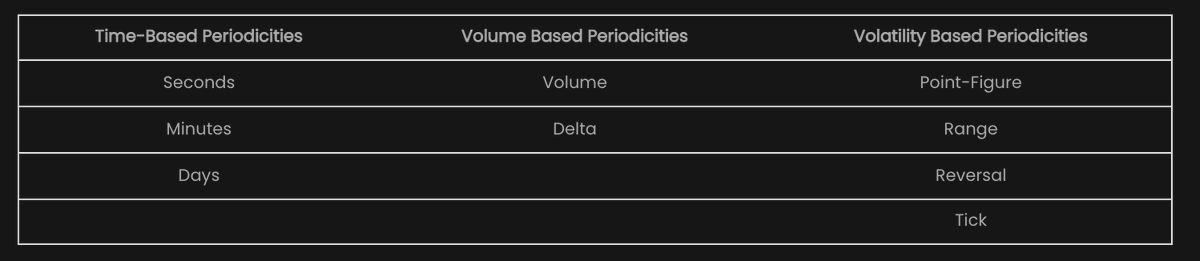
Footprint patterns: If you decide the focus on intraday trading there are three patterns worth paying attention to.
1) finished/unfinished auctions. There is an auction process going at each price, the highest and lowest points can tell us if buyers and sellers are still interested in doing business or not. if you have something like 197x490 followed by 0x23 you

can tell that those buyers were not interested in buying at higher prices, therefore you can expect rotation lower. Opposite to that is an unfinished auction where there is no 0 and you can assume that market still wants to auction higher.
2) large size tracker. Probably my favorite use of footprint. By filtering bid and ask for certain size (depending on the market you trade) you can see where large players are stepping in the market or getting trapped. This often tends to be enough drive for moving prices
3) volume imbalance, already mentioned above footprint is great for visualization who is getting trapped or where the large size is stepping in. Thanks to footprint you can also see where stops are getting triggered (row of numbers with 0 on the other side)

Key takeaway: once again, there is no right or wrong way to trade, asymmetric risk/reward ratio and risk management outperform any tool or indicator
If you are new to this is extremely easy to lose your head in footprint charts, you see all these numbers and you get little too excited. Focus on footprint only at areas where you want to trade, there are some obvious spots like daily/weekly highs/lows, key s/r levels etc
at those places, you will be able to spot those patterns mentioned above. also important thing is to not get too spooked once you are already in trade. You might get out mid-way because of something on footprint and you will regret it later on.
More about footprint charts is covered here: tradingriot.com
If you are interested to see how I use it, you can pick up Blueprint tradingriot.com
If you are interested to see how I use it, you can pick up Blueprint tradingriot.com
Loading suggestions...