

Ive done a thread on CVD ( and Footprint ( now its time to finish this with one last thing that brings "what is chart" question all the time, Market Profile. /cont
Although you see people who use market profile use also orderflow in most cases, these two are not tied to each other and can be used separately.
Also as orderflow requires a lot of screen time to observe patterns unique to each market, the market profile always stays the same and once you spend initial time to understand it, it gets quite easy and systematic.
Market profile follow the principles based on auction market theory, this is behind scope of this thread but you can learn more here - tradingriot.com. This simple infographic can be used to build actual trading strategies and execute trades.
So what are these letters on the market profile? Created in the 80s by Peter Steidlemeyer, the Market profile breaks down price action to so-called TPOs (Time price opportunity). Every 30 min candle get assigned a letter, A for the first 30min bar of the day and so on.
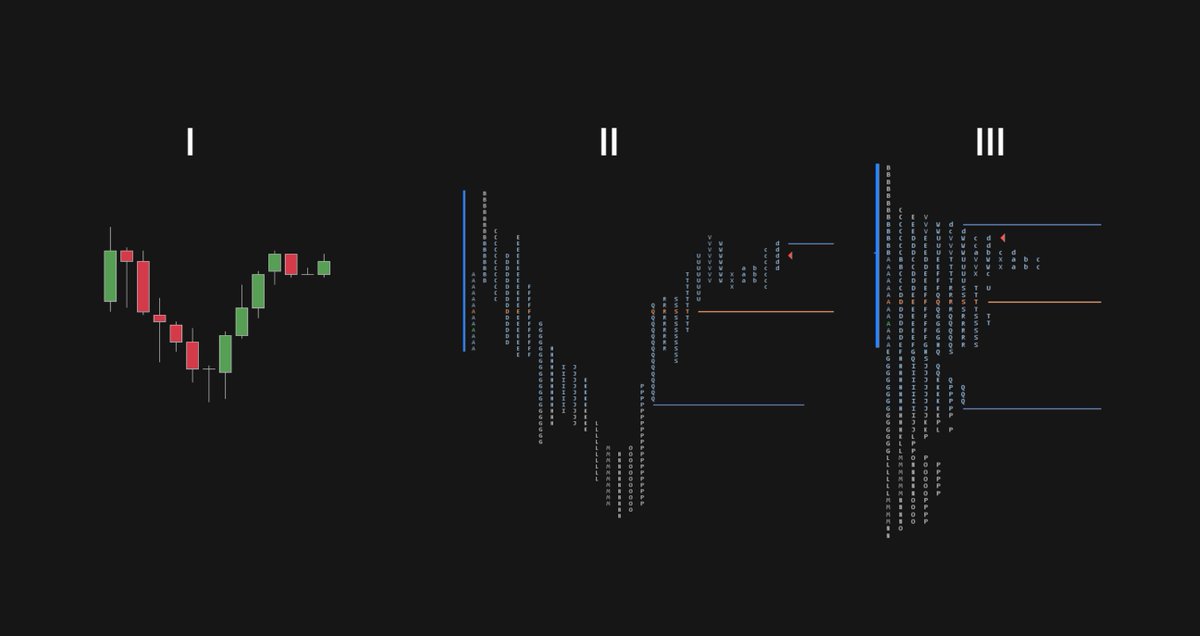
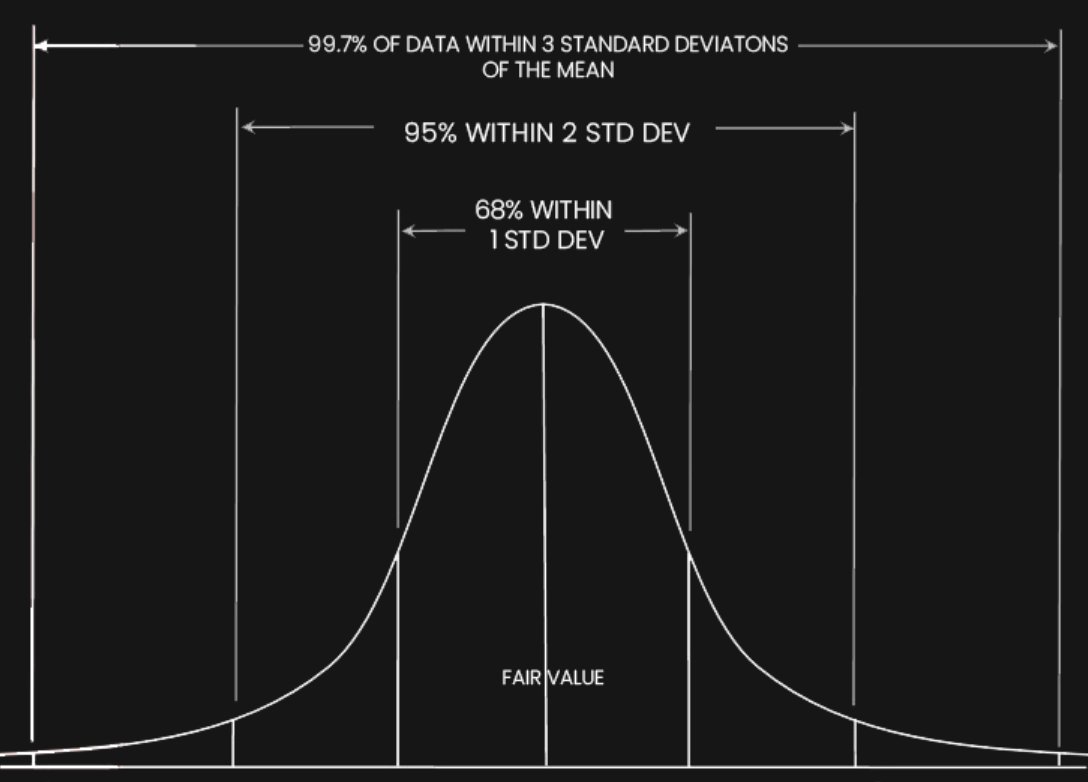
One trading day is finished, these TPOs are then composed into s distribution bell curve. 68% within 1 standard deviation is market as a Value area for a day and the area with the most traded time (most TPOs) is called point of control.
There are two ways how you can plot your market profiles, based on time or volume. With rise of electronic trading using volume market profile sounds like better idea and it is what I personally use as well, but using volume can pose some problems as profiles can get skewed
by one single execution during the day, because of that its advised to test both and find what suits you better.
This is how your daily profile looks like once it's finished, Open and Close is usually market with different colors and you have your value area and point of control.

Intial balance is another feature Market profile popularized, it marks out range of first 2 TPOs. This differs based on a market, for BTC initial balance is set first hour after the open, in legacy futures like ES traders usually use IB of first hour after RTH open.
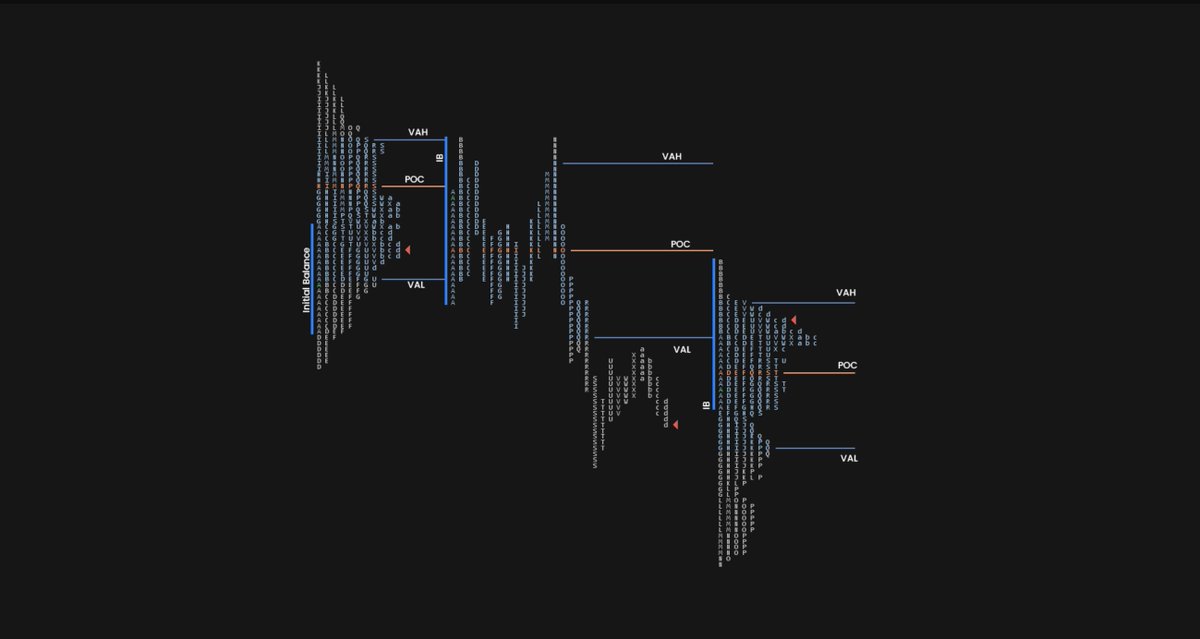
The initial balance is a powerful tool that works in a similar way as the popular "opening range" strategy from the pits and you can create strategies solely based on initial balance, breakouts but also failed auctions (false breaks) can be spotted on day to day basis.
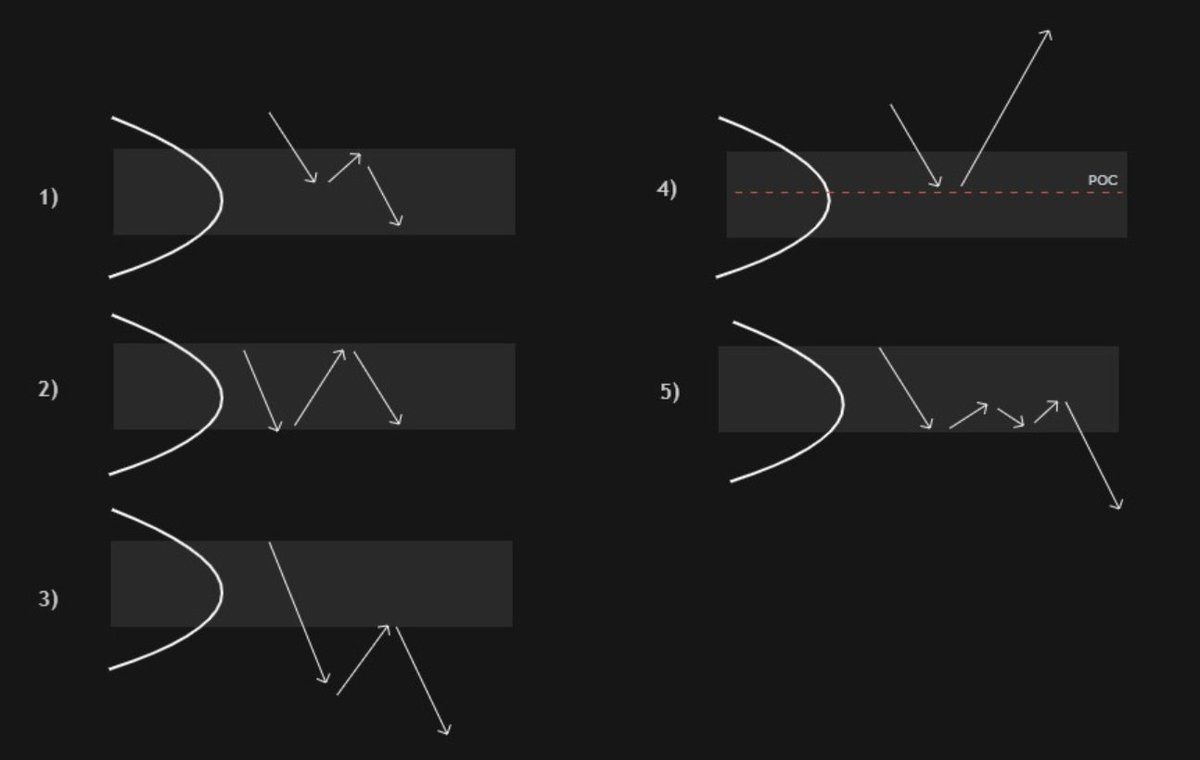
Another patterns MP creates are known as Excess, Poor Highs/Lows and Single print.
Excess tells us market tried to go one direction but failed and created a tail within one 30min bar. These are usually "stop runs" as most PA traders call them.
Excess tells us market tried to go one direction but failed and created a tail within one 30min bar. These are usually "stop runs" as most PA traders call them.
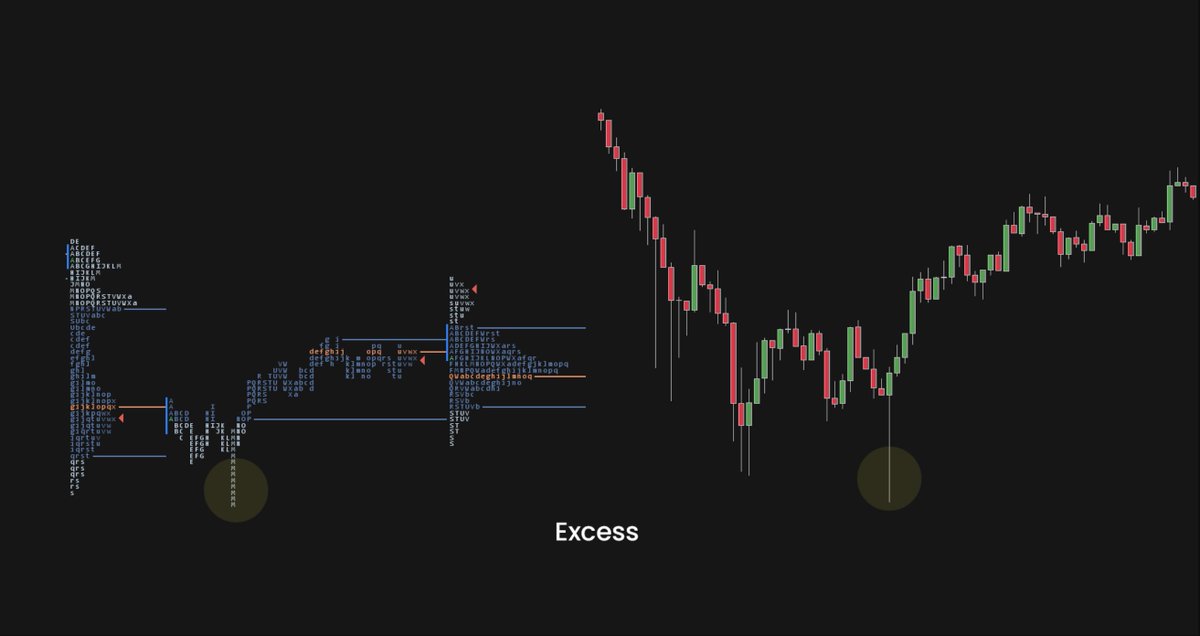
A good excess is solid indication of high/low in for the session.
Poor High/low tells us market lacks excess and it is not done auctioning at those prices. This is usually double top/bottom retail traders trade but more often than not these are revisited in near future. Chart below shows PH and also excess that fixed the poor high with FP.
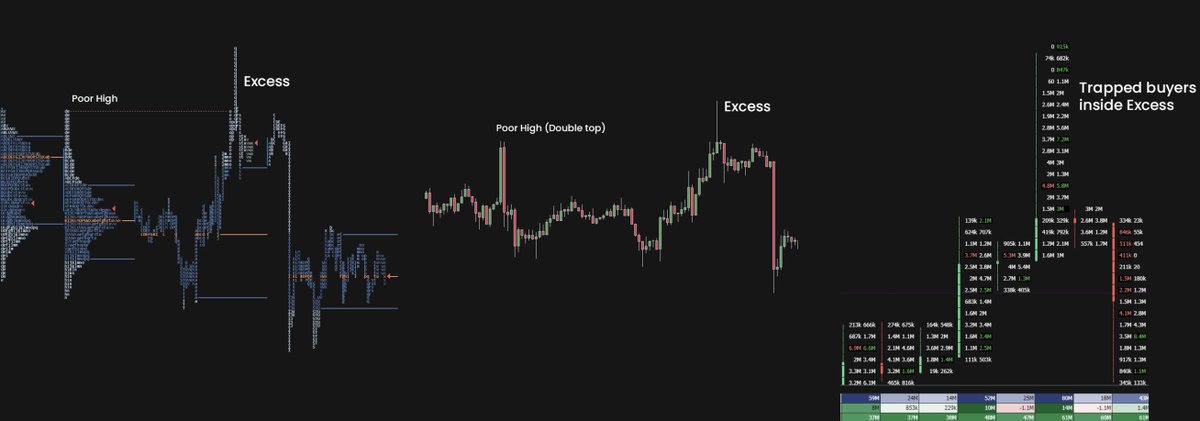
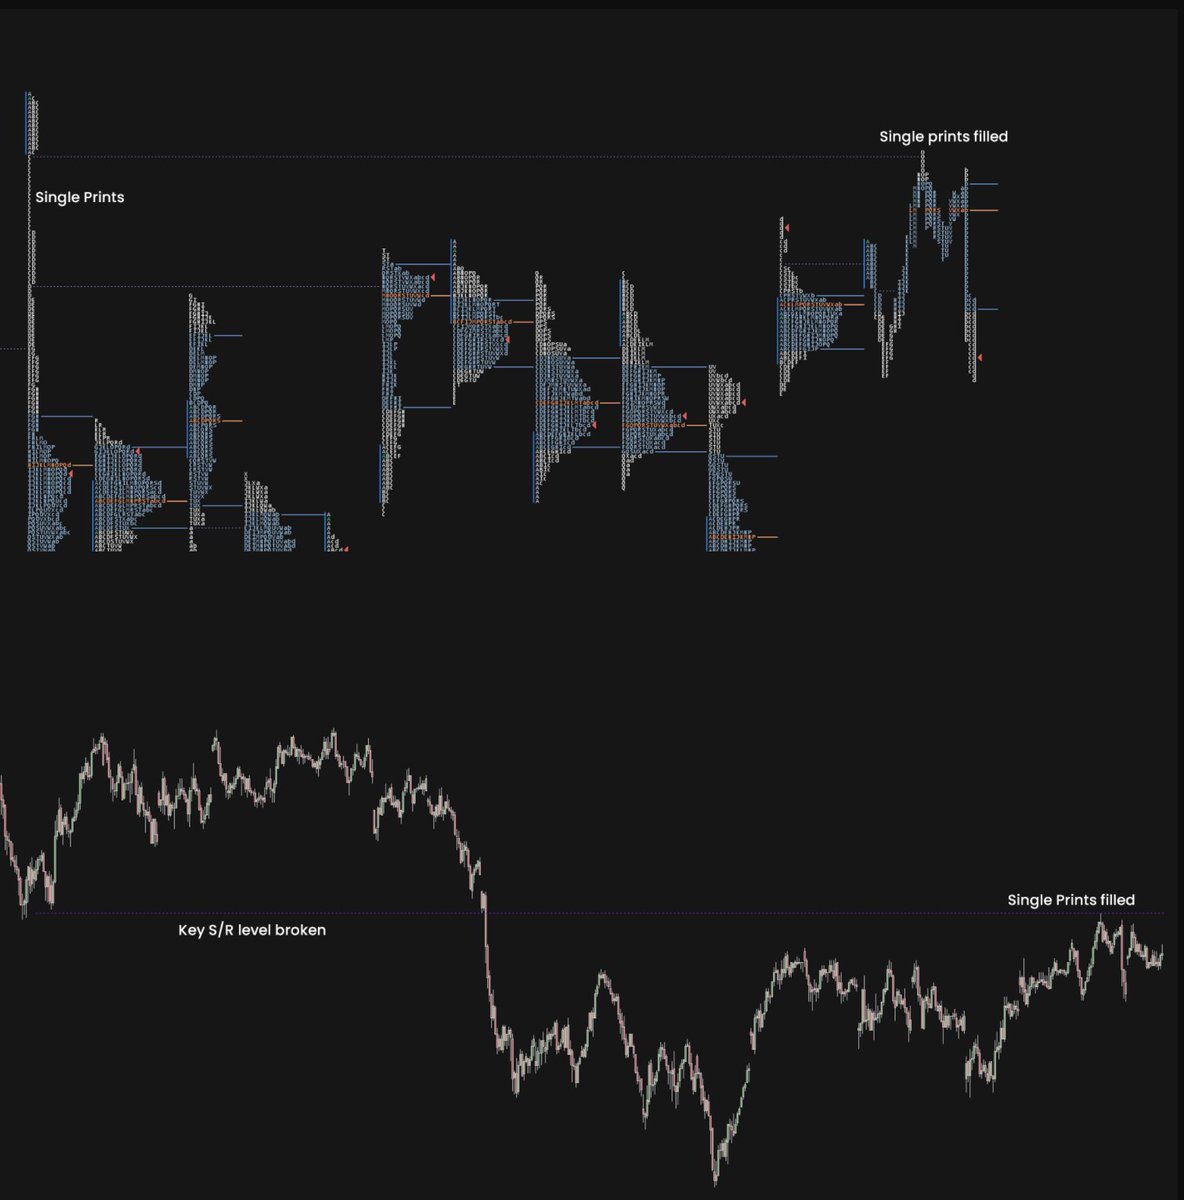
Single prints show where the market moved too fast throughout the area. These are also known as liquidity gaps and provide good levels for future support and resistance.
There are also other characteristics of market profile and also Market profile day types and opening types, because I don't want this thread to be too long, you will find them here - tradingriot.com

Market profile is a great tool for organizing data, although a lot of people are confused by profiles, they are very easy to understand and come extremely handy during the trading day as you get a clean view of the market is trying to do and how successful it is doing it.
To learn more make sure to read article about Market Profile on my blog and also articles about Volume profile and Auction market theory, once you understand it you will see it can be a great addition to most PA/indicator-based strategies.
If you are interested to see how I use market profile you can pick up the Trading Blueprint, make sure to use code "2022" for 20% off until end of the year tradingriot.com
Loading suggestions...