

#WeeklyIndexCheck CW52/2021
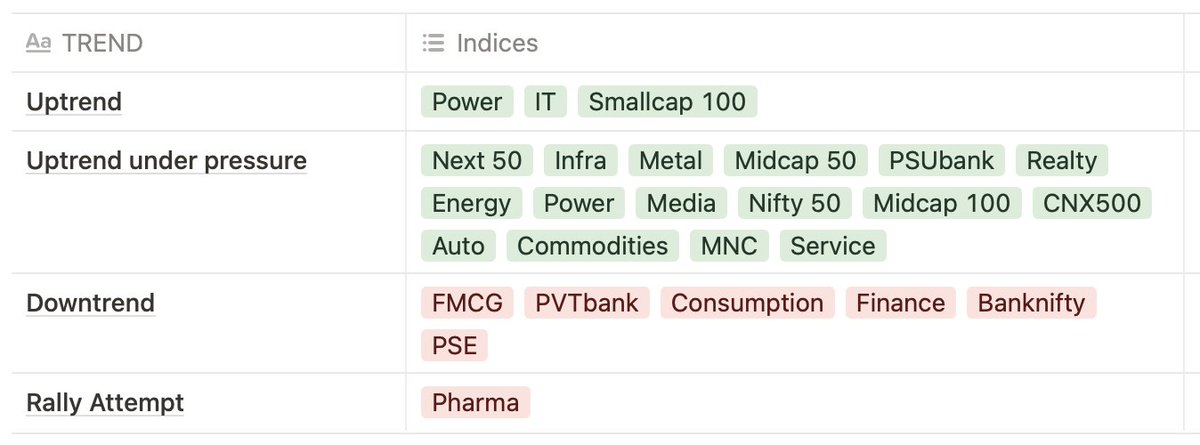
Uptrend under pressure. Momentum still negative but improving.
Smallcap index is back in confirmed uptrend. Pharma does a rally attempt. No index yet with positive momentum.
Market breadth improving on all timeframes. Fresh buy signal.
Uptrend under pressure. Momentum still negative but improving.
Smallcap index is back in confirmed uptrend. Pharma does a rally attempt. No index yet with positive momentum.
Market breadth improving on all timeframes. Fresh buy signal.
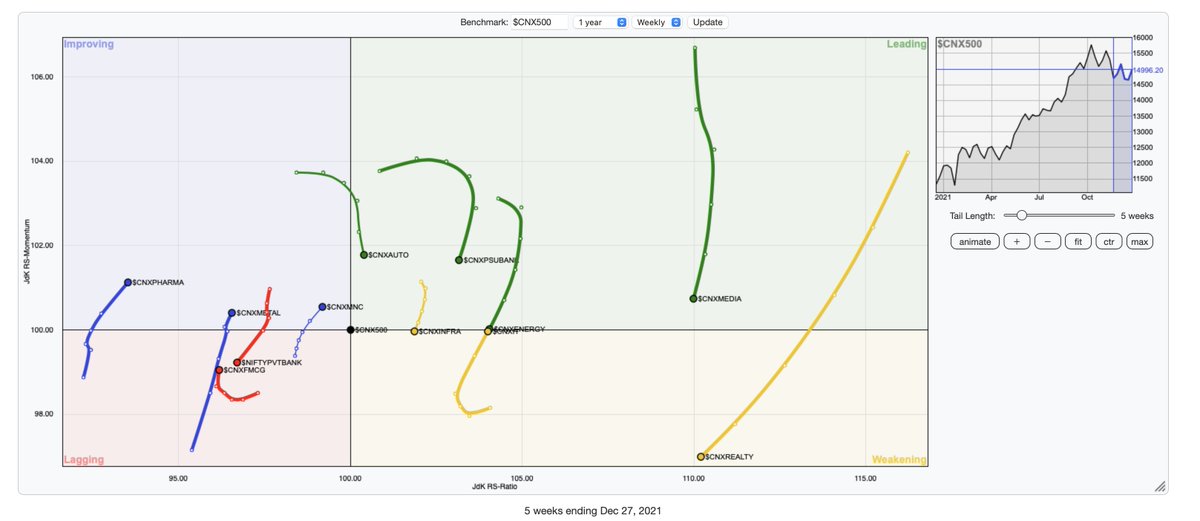
On Weekly RRG charts, compared to CNX500:
⦿ IT, Metals, Pharma & MNC gaining momentum.
⦿ PVTBANK going further south; may replace FMCG as the weakest index.
⦿ IT has been consistently regaining momentum & strength, & looks all set for an entry back into the leading quadrant.
⦿ IT, Metals, Pharma & MNC gaining momentum.
⦿ PVTBANK going further south; may replace FMCG as the weakest index.
⦿ IT has been consistently regaining momentum & strength, & looks all set for an entry back into the leading quadrant.
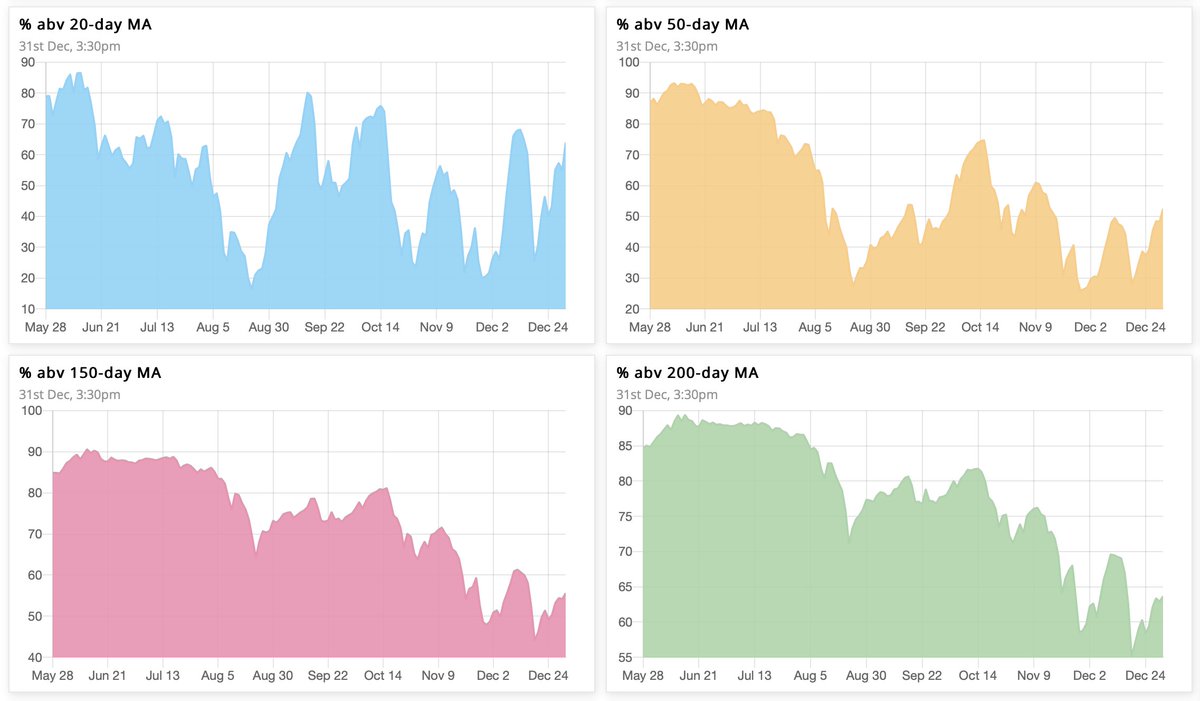
Market breadth improving on all timeframes. Higher timeframe back to bullish bias. Buy signal on short-term timeframes.
⦿ 40% → 63% above 20MA (buy signal)
⦿ 37% → 52% above 50MA (buy signal)
⦿ 49% → 55% above 150MA (bullish bias)
⦿ 58% → 64% above 200MA (bullish bias)
⦿ 40% → 63% above 20MA (buy signal)
⦿ 37% → 52% above 50MA (buy signal)
⦿ 49% → 55% above 150MA (bullish bias)
⦿ 58% → 64% above 200MA (bullish bias)
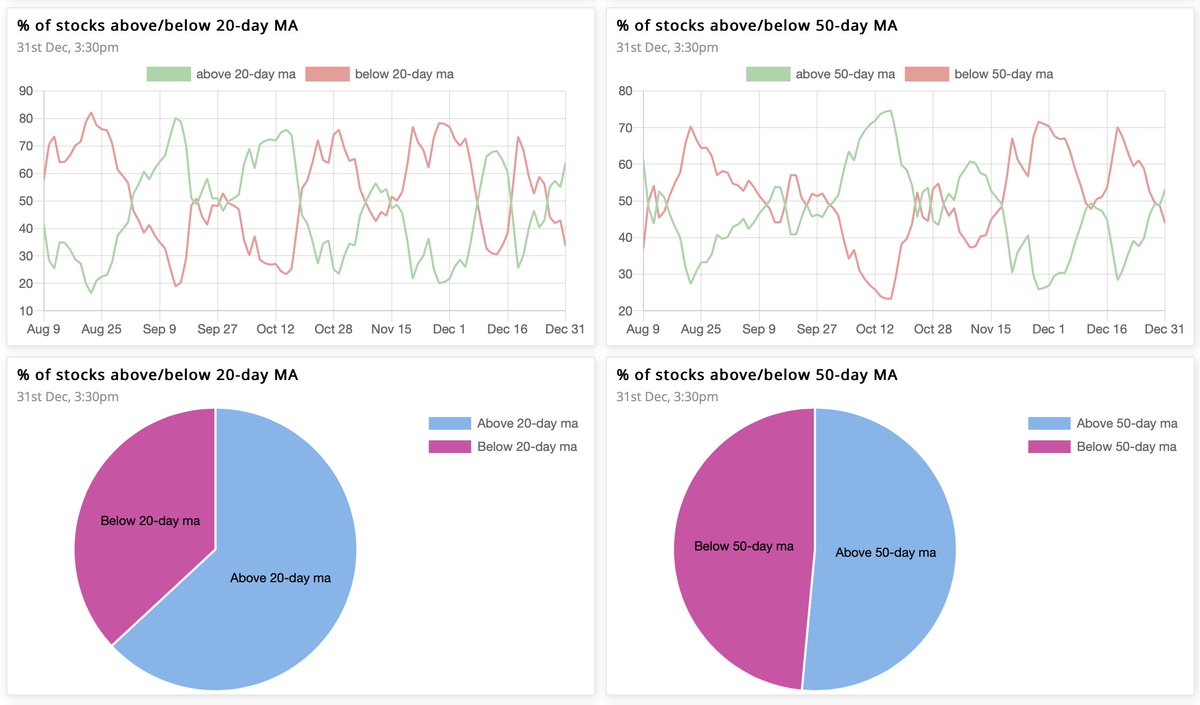
The Ratio between stocks above & below 50MA is 1.06, while that for 20MA is 1.7. The 10-day cumulative ratio for stocks above 50MA is 0.5.
A value >2 is good for swing trades on the long side.
A value >2 is good for swing trades on the long side.
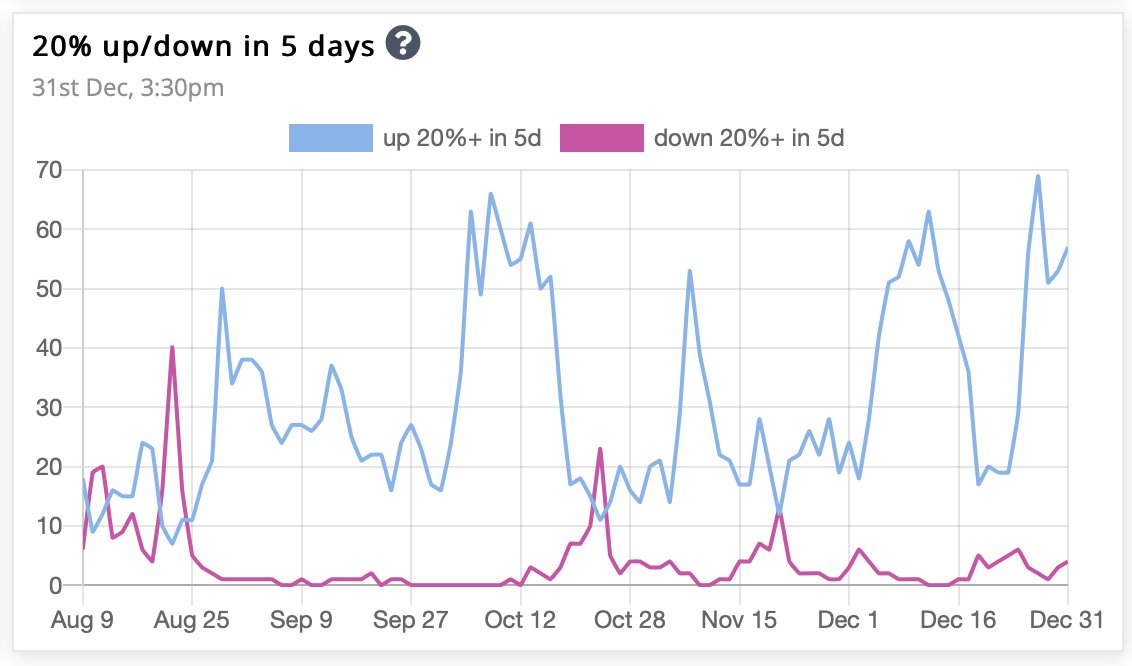
The number of stocks up 20% in past 5 days finally gave a strong bullish upthrust. Conducive environment for swing trades.
On a modified Stockbee market monitor, the 5-day cumulative ratio jumped up to 6.3 and the 10-DCR to 1.5. Value more than 2 makes it green.
Number of stocks up 13% in 34 days in back in green, which shows that the short-term bearish phase is over for now.
Number of stocks up 13% in 34 days in back in green, which shows that the short-term bearish phase is over for now.
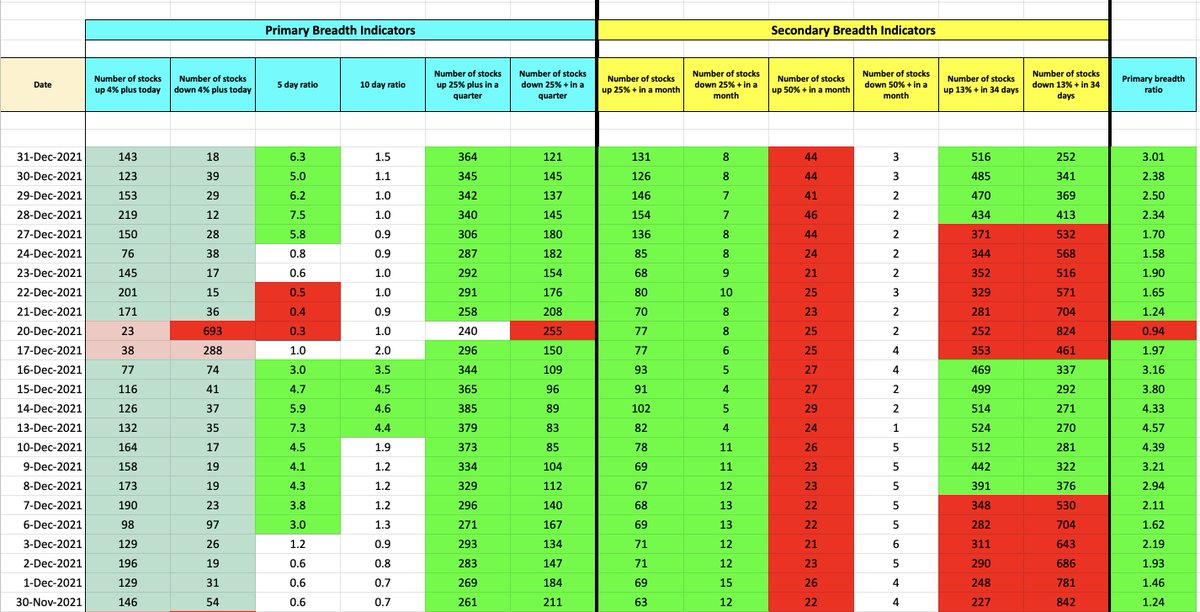
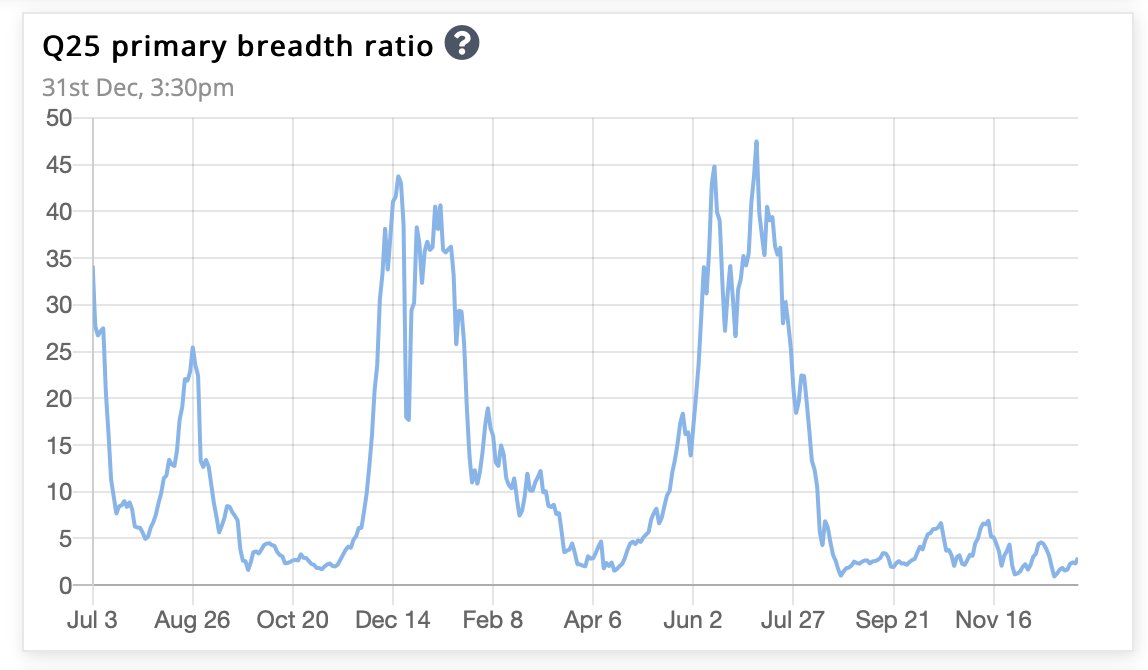
Overall, the market is bullish till the number of stocks up 25% plus in a quarter is more than that down 25% plus in a quarter. The ratio between the two is the primary breadth ratio, which is 3.01 now.
Loading suggestions...