

My thoughts on CPI
A THREAD
Here i've marked out each CPI event for the previous year.
I've noticed a bit of a pattern with CPI.
From Jan 21 - Mar 21 the actual was equal to the forecast. We then saw an increase in April and in May we saw 4x the forecast, then down we went.
A THREAD
Here i've marked out each CPI event for the previous year.
I've noticed a bit of a pattern with CPI.
From Jan 21 - Mar 21 the actual was equal to the forecast. We then saw an increase in April and in May we saw 4x the forecast, then down we went.
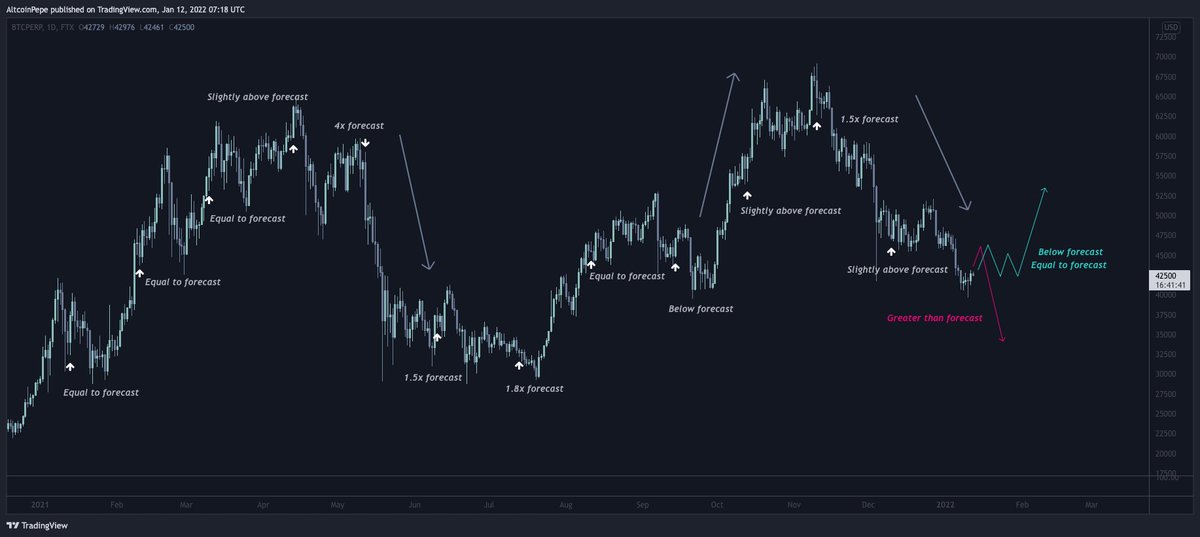
In June, although the actual was greater than the forecast, we only saw a difference of 1.5% compared to May numbers.
In July we saw a difference of 1.8% which was slightly higher than June however the market rallied higher. Hmm, stay with me i'll explain why I think this was..
In July we saw a difference of 1.8% which was slightly higher than June however the market rallied higher. Hmm, stay with me i'll explain why I think this was..
I believe the market was moving away from an area of demand to the next area of supply ahead of the next forecast and take it from there. The market doesn't just go down in a straight line. It'll move from one area of demand to the next area of supply and so on..
In August the actual was equal to the forecast. I believe that if the CPI numbers were worse (anything above 2x) the market would have likely dumped like we did in May.
We had a period of slow upward momentum into a huge supply zone, dumped then sideways into September CPI..
We had a period of slow upward momentum into a huge supply zone, dumped then sideways into September CPI..
Septembers numbers were released and they were below forecast for the first time that year. We sold off into 40k demand followed by a nice run back up towards 55k where price settled into the next CPI.
October was slightly above forecast and the market rallied to new ATH's.
October was slightly above forecast and the market rallied to new ATH's.
I believe the market at this point was positioning itself for the November CPI to be released and the fact that we had seen a steady increase in the CPI from September to November it sold off. The market clearly didn't like this as you can see on the chart.
December CPI was slightly above forecast but not as bad as November. However price initially went sideways and ultimately we find ourselves at 40k. Again, remember that 40k is a huge level.
So what's the pattern?
From Jan to May we had
Equal to - equal to - equal to - slightly above - 4x above - dump
From May to July we had
4x - 1.5x - 1.8x - move higher towards a key supply area Another increase in CPI read would have likely sold off back towards 30k
From Jan to May we had
Equal to - equal to - equal to - slightly above - 4x above - dump
From May to July we had
4x - 1.5x - 1.8x - move higher towards a key supply area Another increase in CPI read would have likely sold off back towards 30k
From July to September we had
1.8x - equal to - below for the first time that year - market rallied higher
From September to November we had
Below forecast - slightly above - 1.5x - market dumped
1.8x - equal to - below for the first time that year - market rallied higher
From September to November we had
Below forecast - slightly above - 1.5x - market dumped
So what's the pattern that i'm seeing now?
From November to Now we have
1.5x - slightly above - ???
A reading of below or equal to would be positive for the market
A reading higher would imo see us rally into supply but eventually head lower.
From November to Now we have
1.5x - slightly above - ???
A reading of below or equal to would be positive for the market
A reading higher would imo see us rally into supply but eventually head lower.
From my observations, the market likes to position itself ahead of CPI at key levels in the market. 40k is a key level.
Given that inflation is a hot topic right now, these numbers matter and I think it's quite clear what sort of reading we'd like to see today.
Given that inflation is a hot topic right now, these numbers matter and I think it's quite clear what sort of reading we'd like to see today.
Loading suggestions...