


30D returns were diminishing last month. Post-December drop, the metric has seen a steady rise as the price kept bleeding, forming a strong bullish divergence. It's now back in the threshold, and closing in on the 0% line. Once cleared, we foresee a few good performance weeks.

The accumulation trend scores on a 30D basis show that retail has confidence in accumulating on the bottoms whilst the whales are more reluctant to do so. Scores on a 7D basis indicate the same behavior in contrast to the divergence we saw in December.

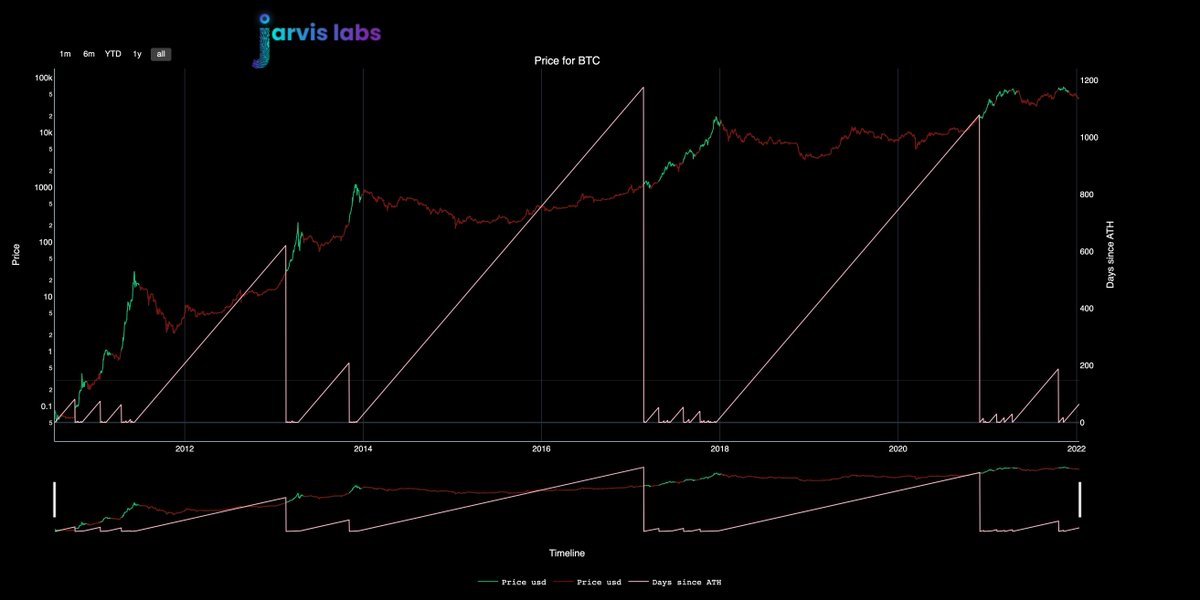
It has been 65 days since the last BTC ATH
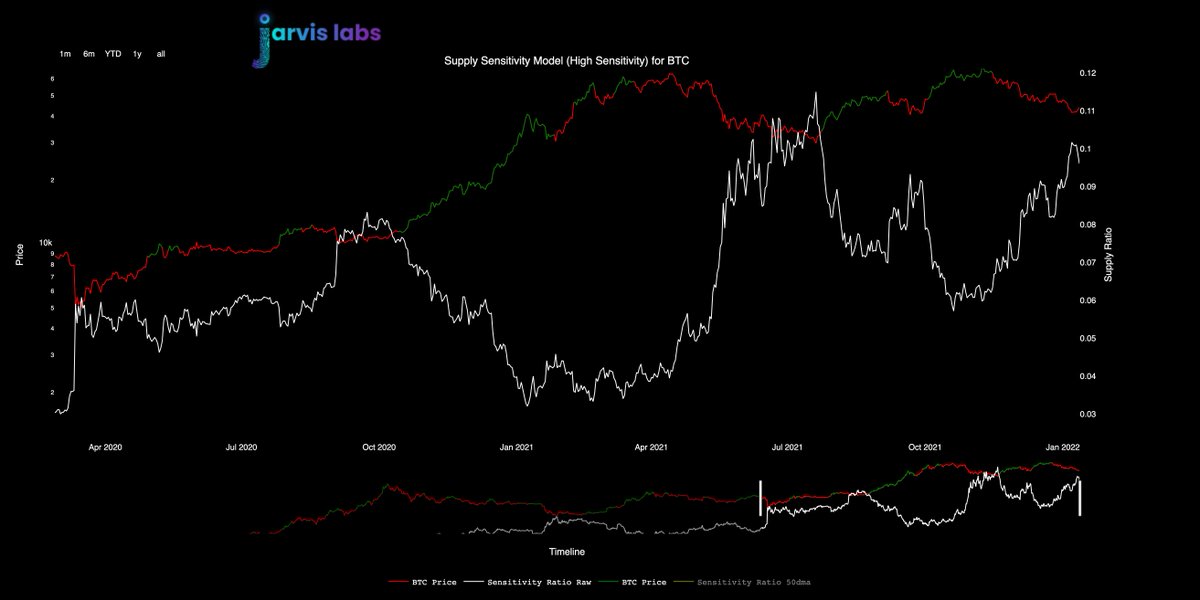
The supply sensitivity ratio is based on both the stablecoin and BTC dominance within the supply. This is a mid-term trend identification metric that is still in red and has to flip to the green if we hope to see multiple weeks of the rally.
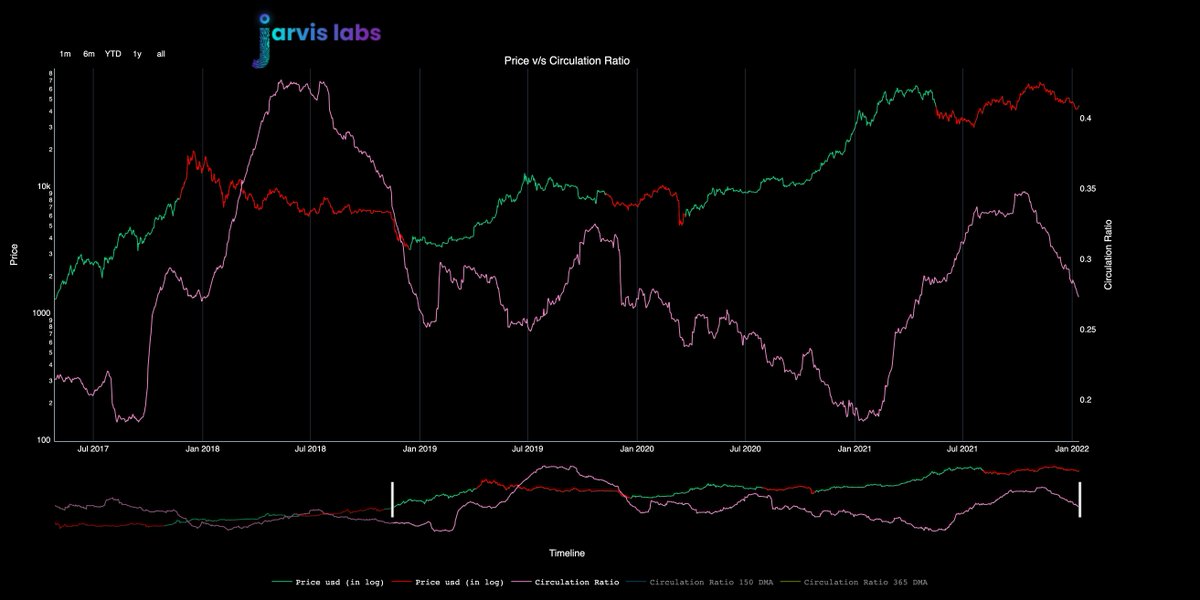
The circulation ratio is derived based on the number of unique coins moving around during a singular time period. The trend model based on this metric indicates bearishness right now and again, has to flip green to support a multi-week rally.
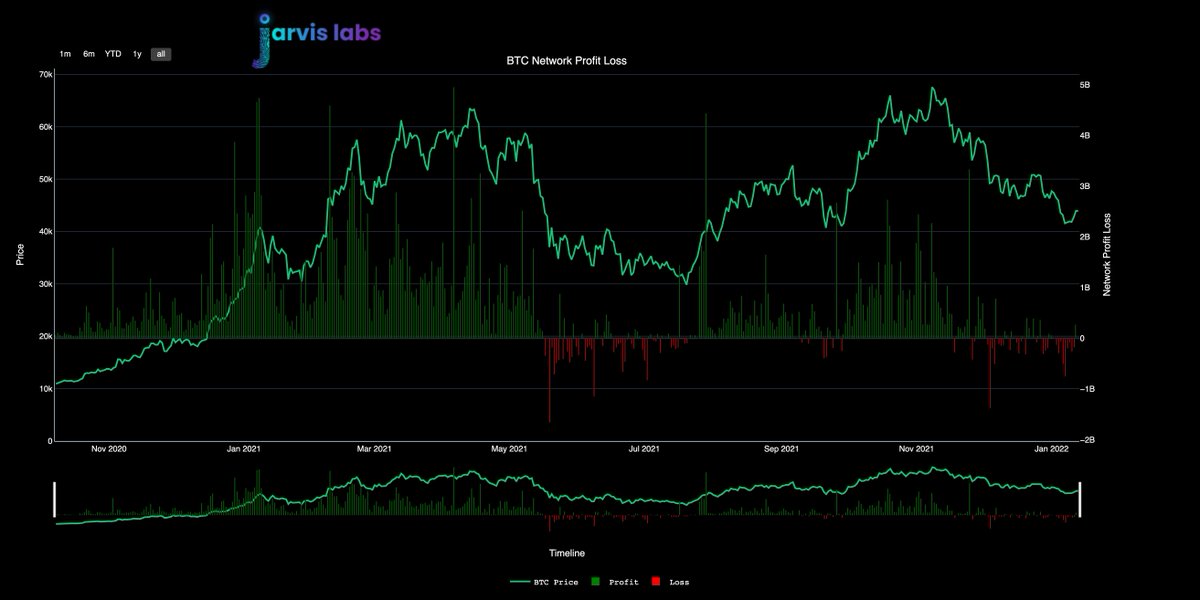
Net P/L recorded nearly 3 weeks of losses with many short-term holders selling their coins at a loss. In the past few days, we are starting to see some green bars, which also indicate a bit of profit-taking at 44k levels.
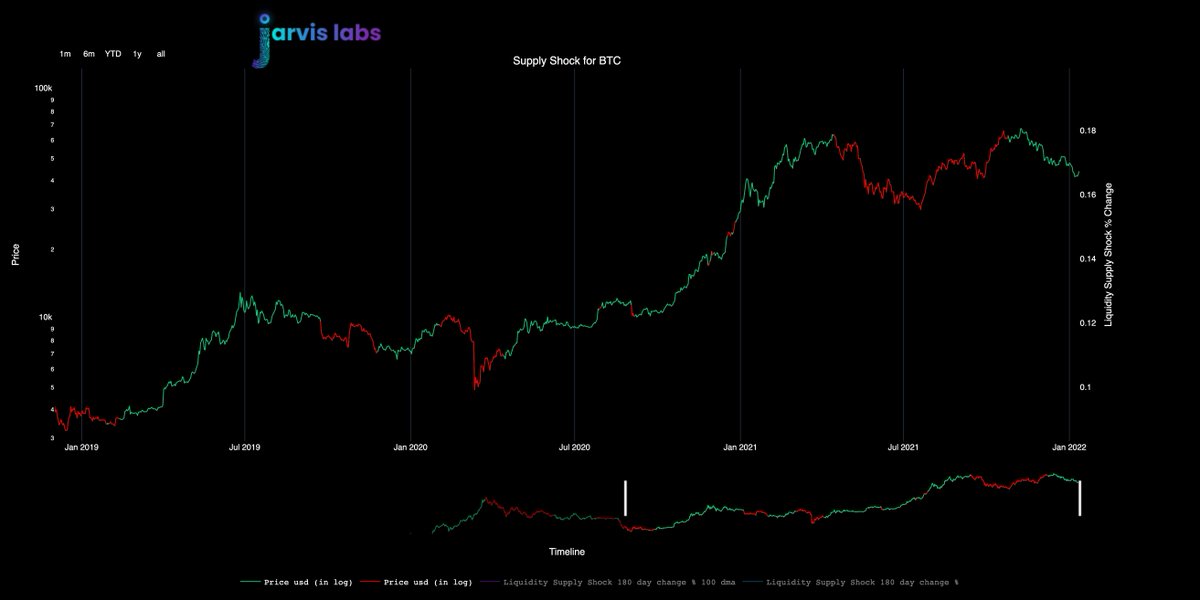
This trend model is based on the liquid supply shock theory and it remains green. This is indicating to us that long-term holders are not yet panic dumping their holdings. It is imperative to us that this model stays green and does not flip to become red.
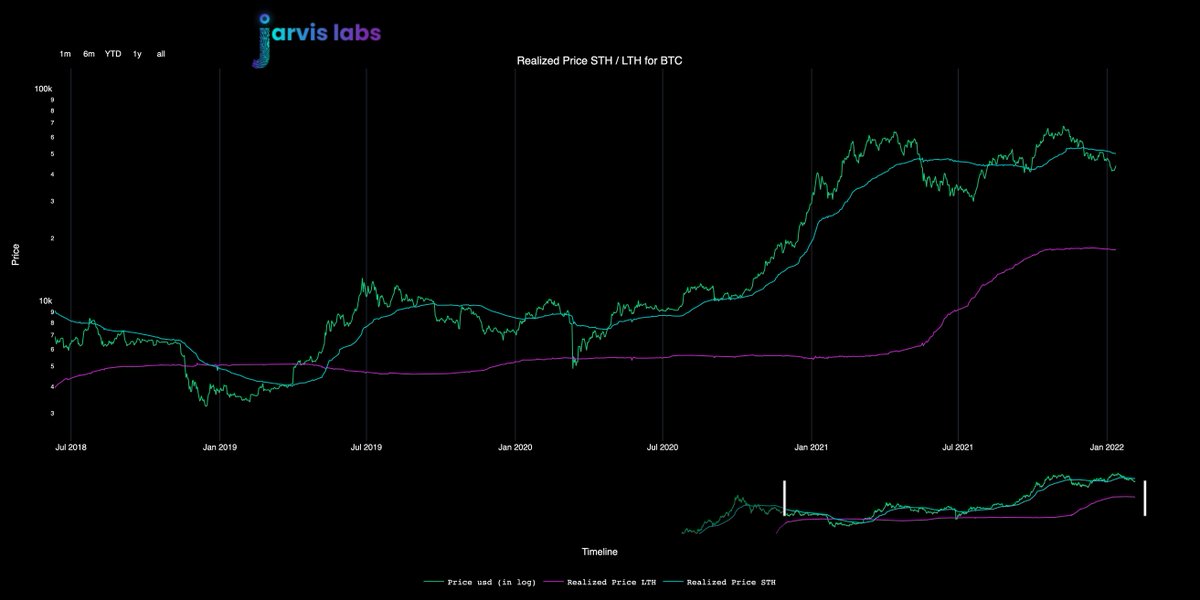
Short-term holder realized price has dropped to 50.9k from the 53k level it held in December, with the price still trending below this level. As long as this level remains reclaimed, the threat of further price corrections continues to stay valid even if not immediate.
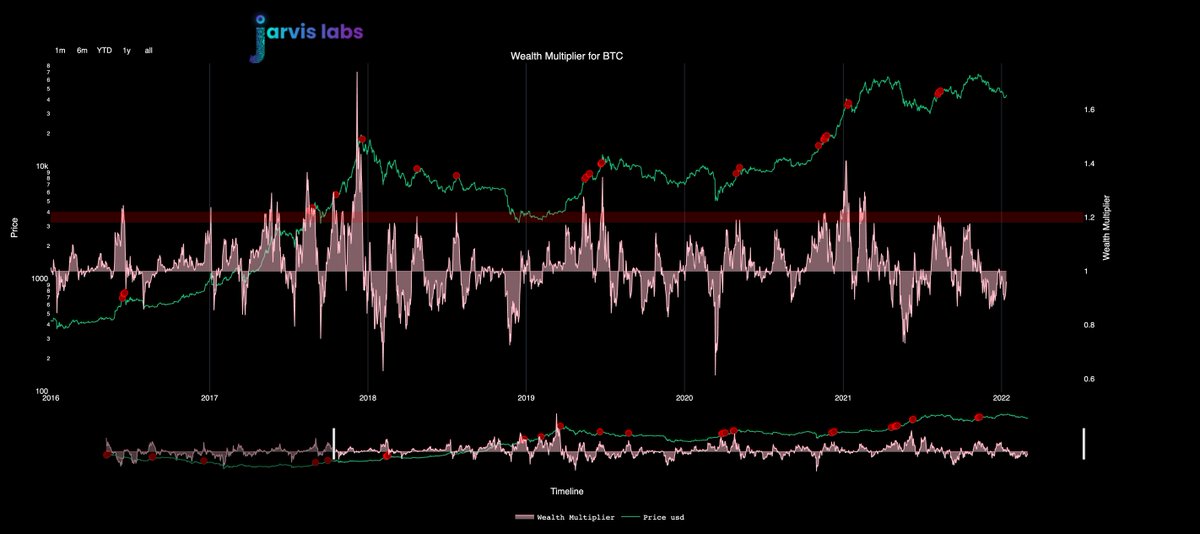
A strong bullish divergence is present in the Wealth Multiplier metric. The short-term price stability may be setting shop here for now. We can expect this metric to trend above the threshold for the weeks to come.
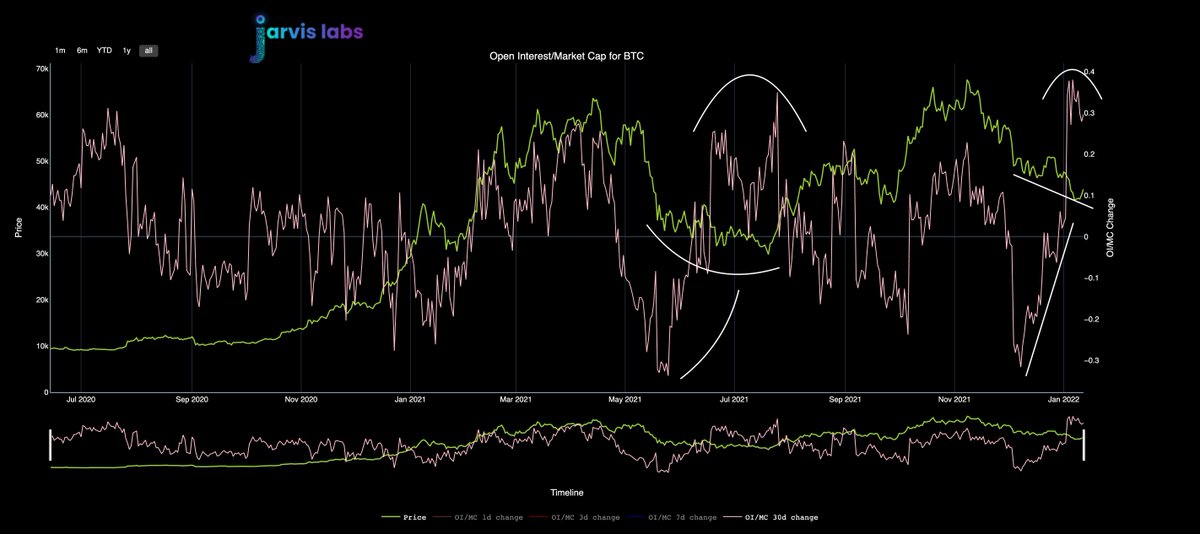
Open interest/market cap change has been rising up to match the summer highs of 2021. As the price begins to rise now, this metric is starting to drop, indicating that a further short squeeze is possible.
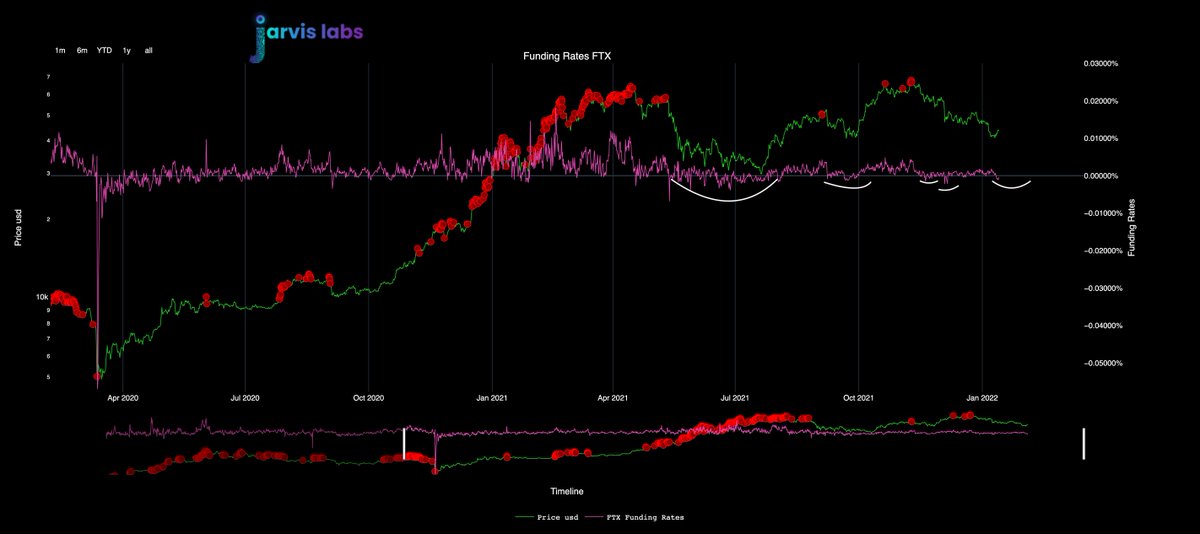
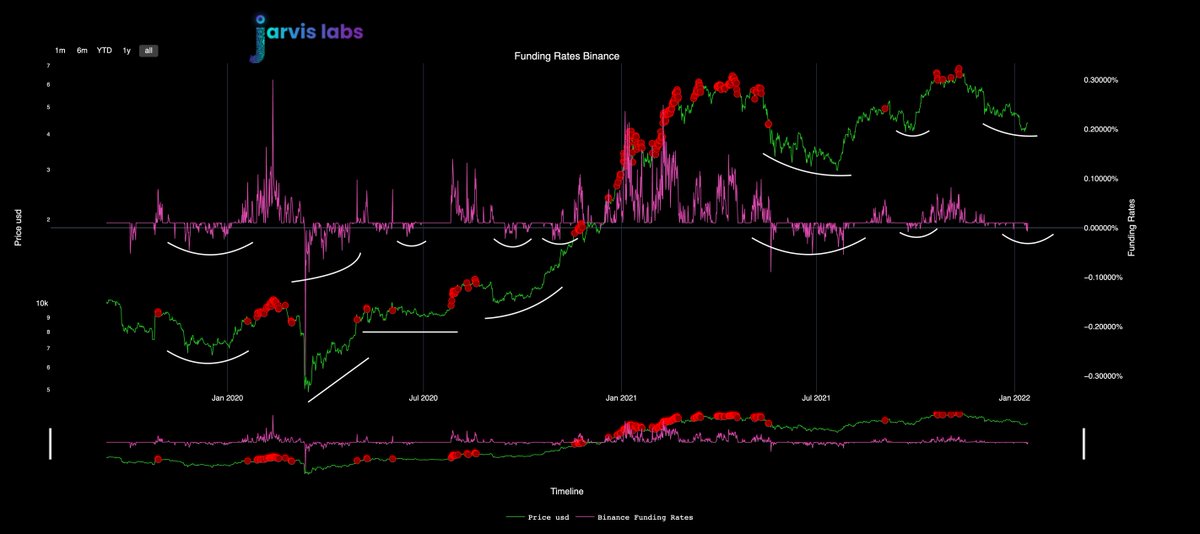
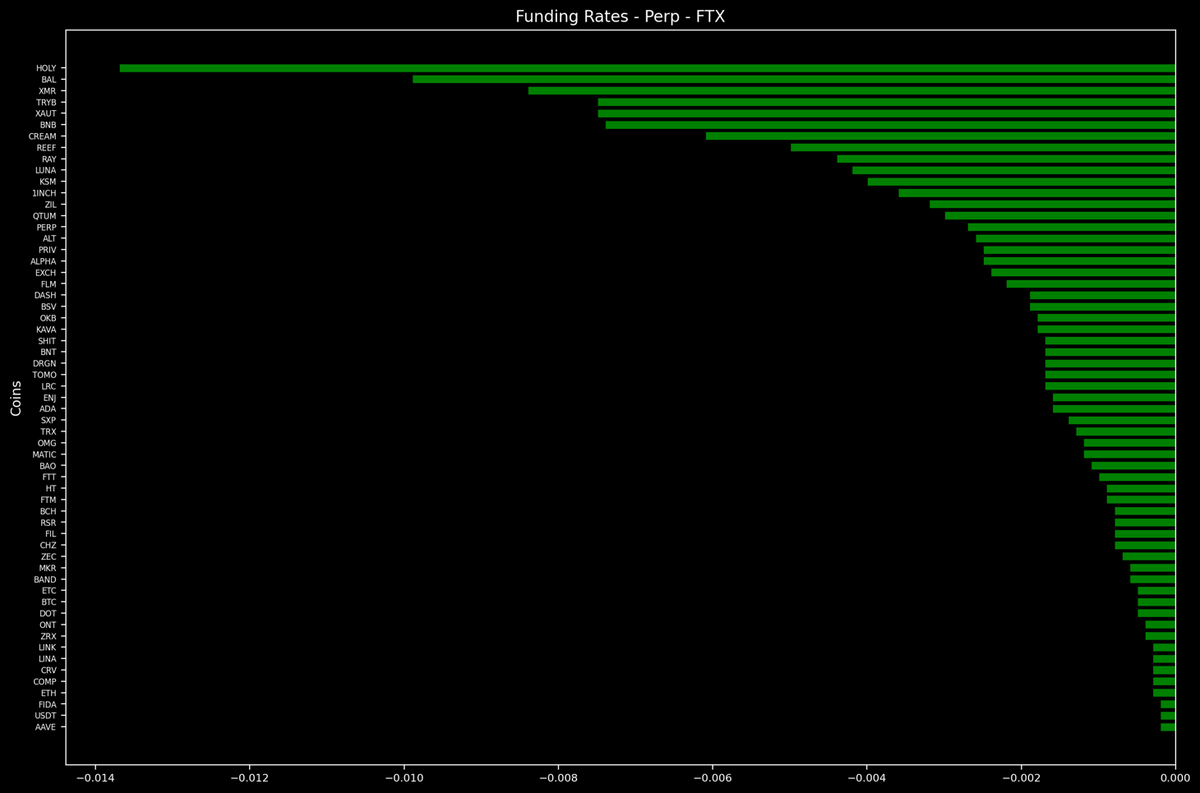
The funding rates have finally turned negative on both FTX and Binance USDT perpetual futures. Should the price continue to rise and funding stay negative, there is a strong bullish sign for a healthy rally, as it tells us that the spot buyers are in the lead.

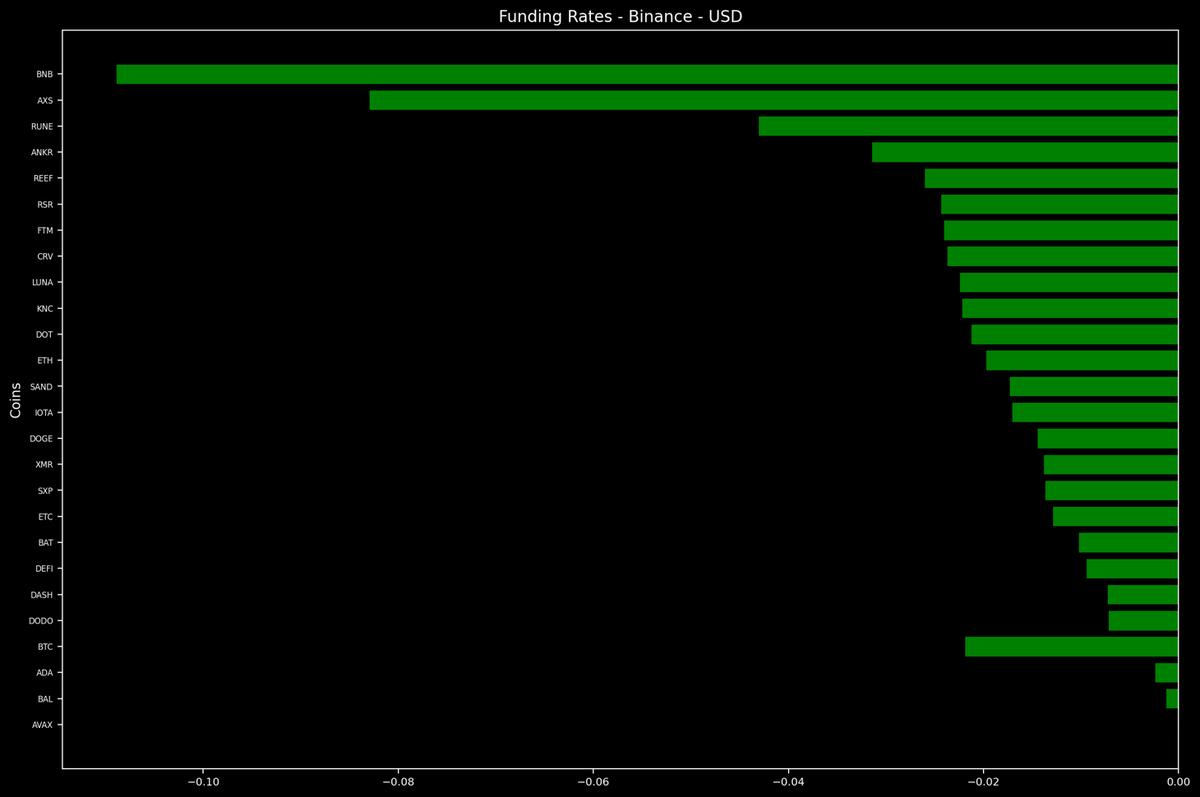
More than 20 pairs have negative funding on Binance. Another great sign for bulls.

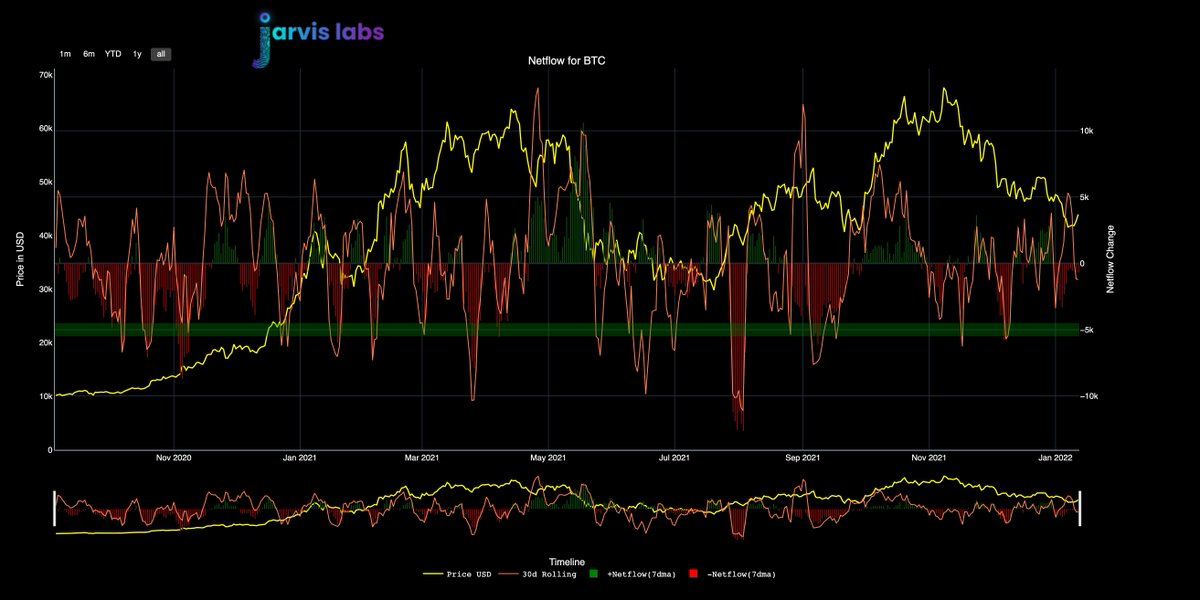
Netflows are currently in the negative territory though not in large values.
Takeaways (1) :
- ROSI Bottom alerts in both December at 42k and Jan at 42.5k are continuing to be the local bottoms for now.
- Funding rates are negative on Binance and most other exchanges as the price rises. This is a bullish sign.
- ROSI Bottom alerts in both December at 42k and Jan at 42.5k are continuing to be the local bottoms for now.
- Funding rates are negative on Binance and most other exchanges as the price rises. This is a bullish sign.
Takeaways (2):
- Netflows are negative.
- Bears have a hand in the price action until STH acquisition price level of 50.9k is reclaimed.
- Implied volatility is still being compressed despite the recent action indicating to trade with caution.
- LT holders are holding strong.
- Netflows are negative.
- Bears have a hand in the price action until STH acquisition price level of 50.9k is reclaimed.
- Implied volatility is still being compressed despite the recent action indicating to trade with caution.
- LT holders are holding strong.
Takeaways (3):
- Oculus drop alerts for BTC (43900) and ETH (3370) levels will likely lead BTC to consolidation before rising to 46-48k resistance levels.
- Q1 rally would be a profit-taking period for most investors, as many VC unlocks and Fed activities are to come in Q2.
- Oculus drop alerts for BTC (43900) and ETH (3370) levels will likely lead BTC to consolidation before rising to 46-48k resistance levels.
- Q1 rally would be a profit-taking period for most investors, as many VC unlocks and Fed activities are to come in Q2.
Loading suggestions...