

This is a compilation of all #Bitcoin long-term bearish analyses that I noticed since January 6, 2021.
In this thread, you can find the original tweet with a little bit of explanation. Please note that this is not 100% going to happen and definitely not financial advice.
👇
In this thread, you can find the original tweet with a little bit of explanation. Please note that this is not 100% going to happen and definitely not financial advice.
👇
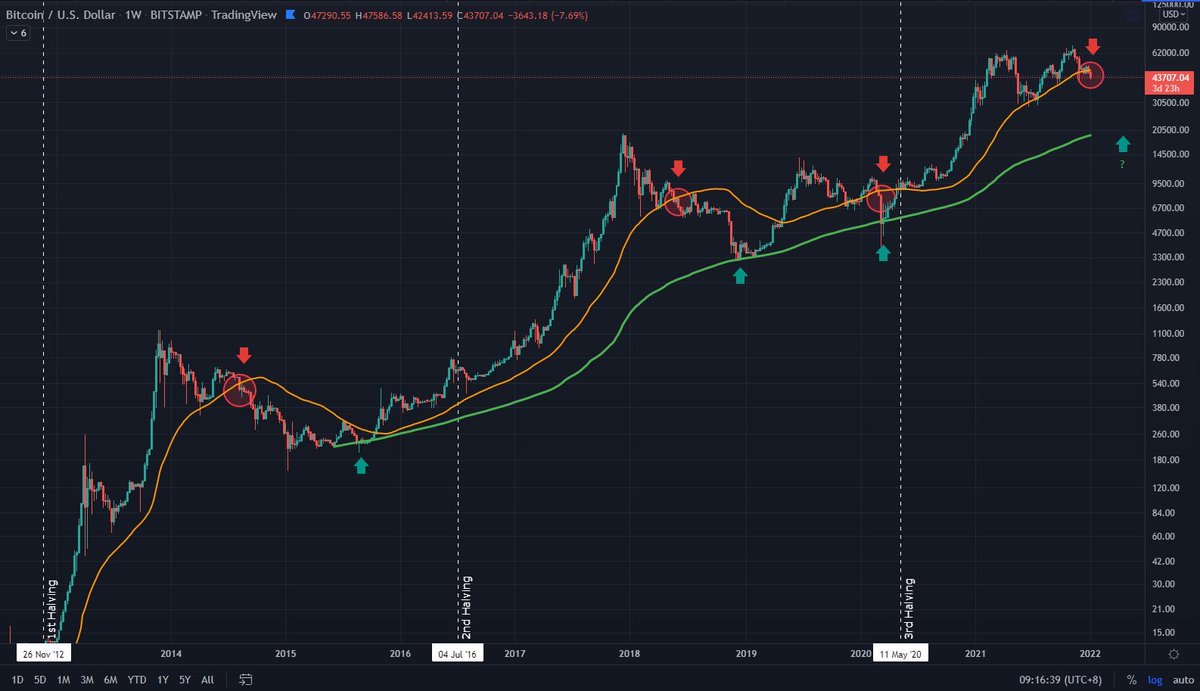
1/ This was the first time I noticed that we are breaking down the 50 week moving average. This happened 3 times before and this is the 4th time.
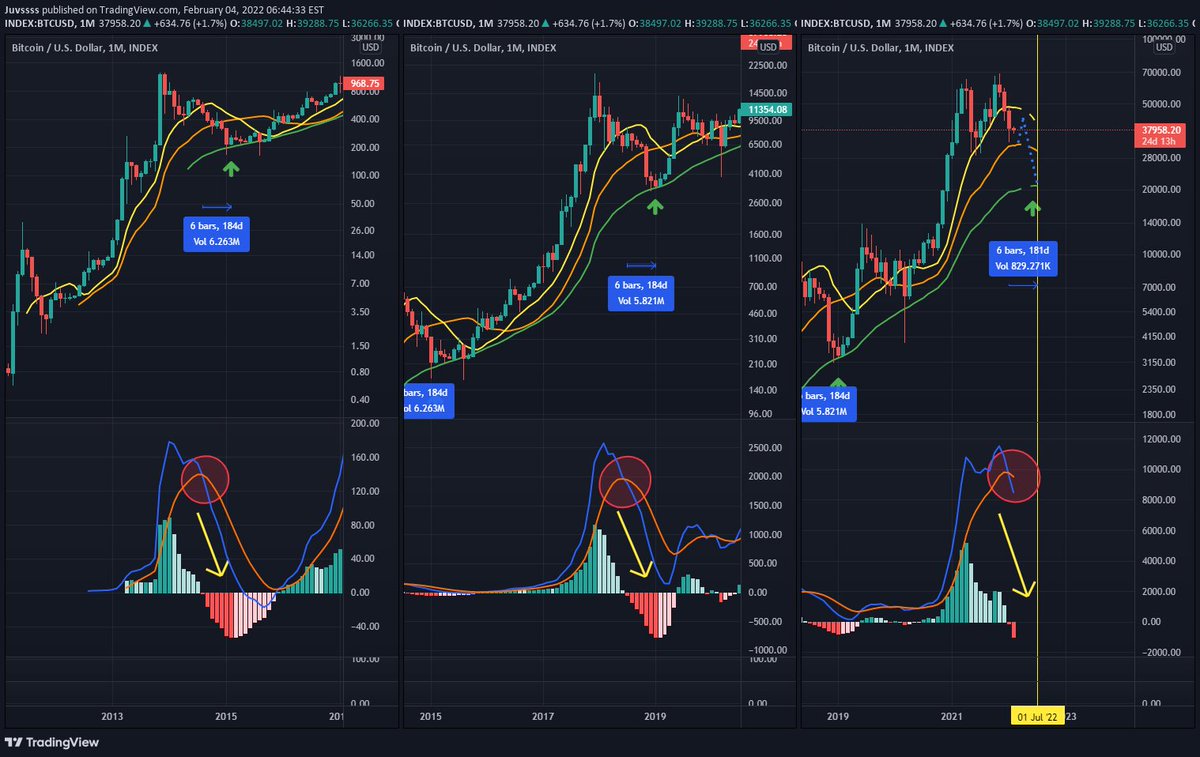
2/ Tried to look at MACD in monthly timeframe and we recently flipped bearish
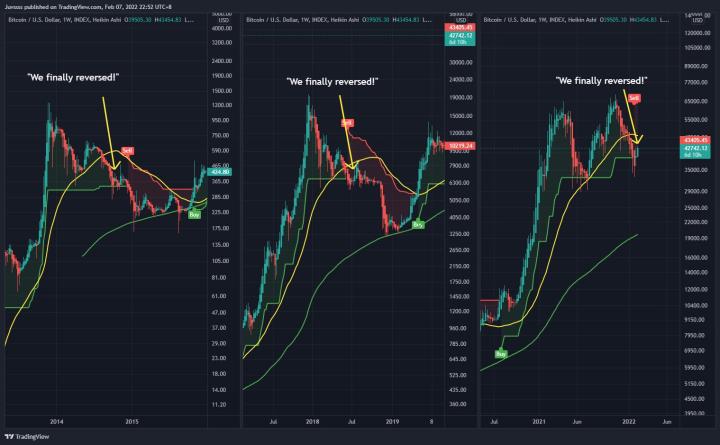
3/ Using heikin ashi candles + weekly SuperTrend indicator, there was a sell signal. This happened 3 times before and last month was the 4th time.
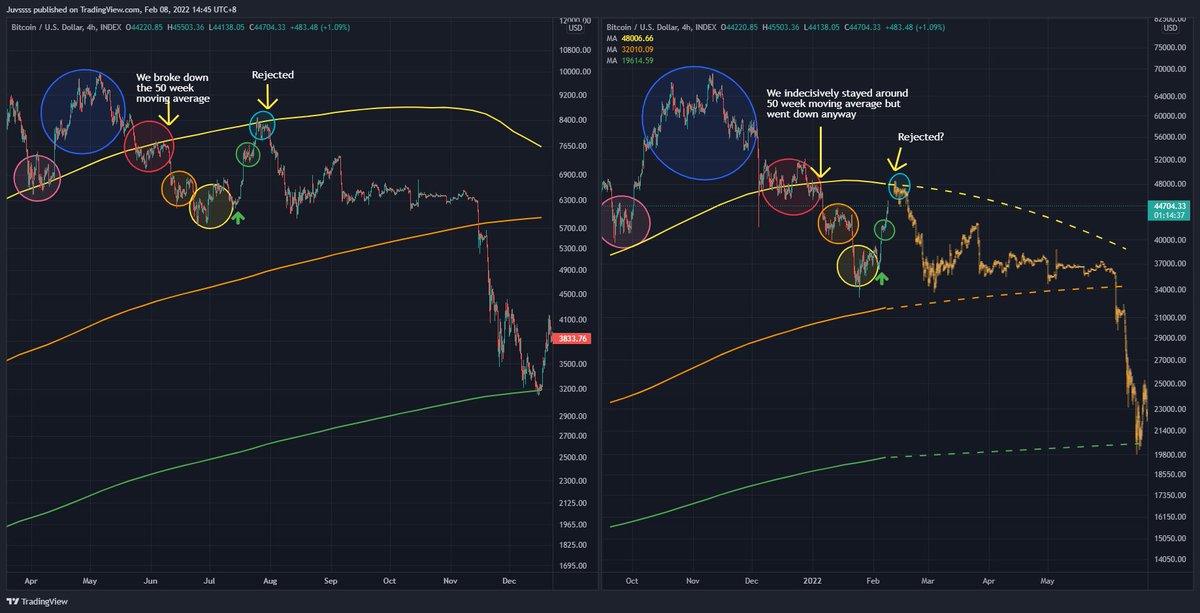
4/ From weekly charts, I zoomed in on 4h chart to see what happened before in 2018. Unfortunately, there is no 4h data back in 2014 for me to compare.
5/ As much as I want #Bitcoin to return to 60k and make new all time high, it is also important to consider worst case scenario. I am not recommending anyone what actions to take but it's up to you given this data/analyses.
6/ Lastly, how do we invalidate these patterns and be bullish?
- A decisive break above 50 week moving average, currently at $47k-48k
- Monthly MACD to reverse
- Weekly SuperTrend to show Buy signal
Happy trading and good luck!
- A decisive break above 50 week moving average, currently at $47k-48k
- Monthly MACD to reverse
- Weekly SuperTrend to show Buy signal
Happy trading and good luck!
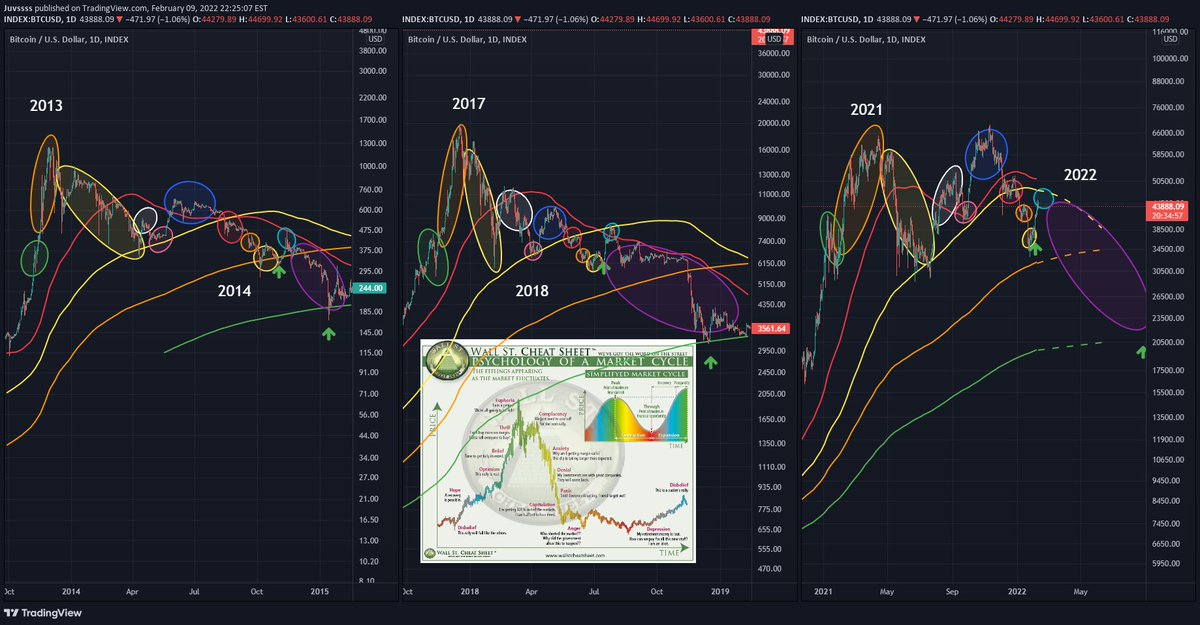
7/ The analysis on TradingView was removed by the moderator and I got banned for 1 week. Here's the chart anyway and unfortunately I won't be including the description as it is tooooo long.
8/ Hey look at that! I have more bearish analysis to add up on this thread. Looks like the patterns are all connected to each other. See thread 👇
More patterns!
Loading suggestions...