


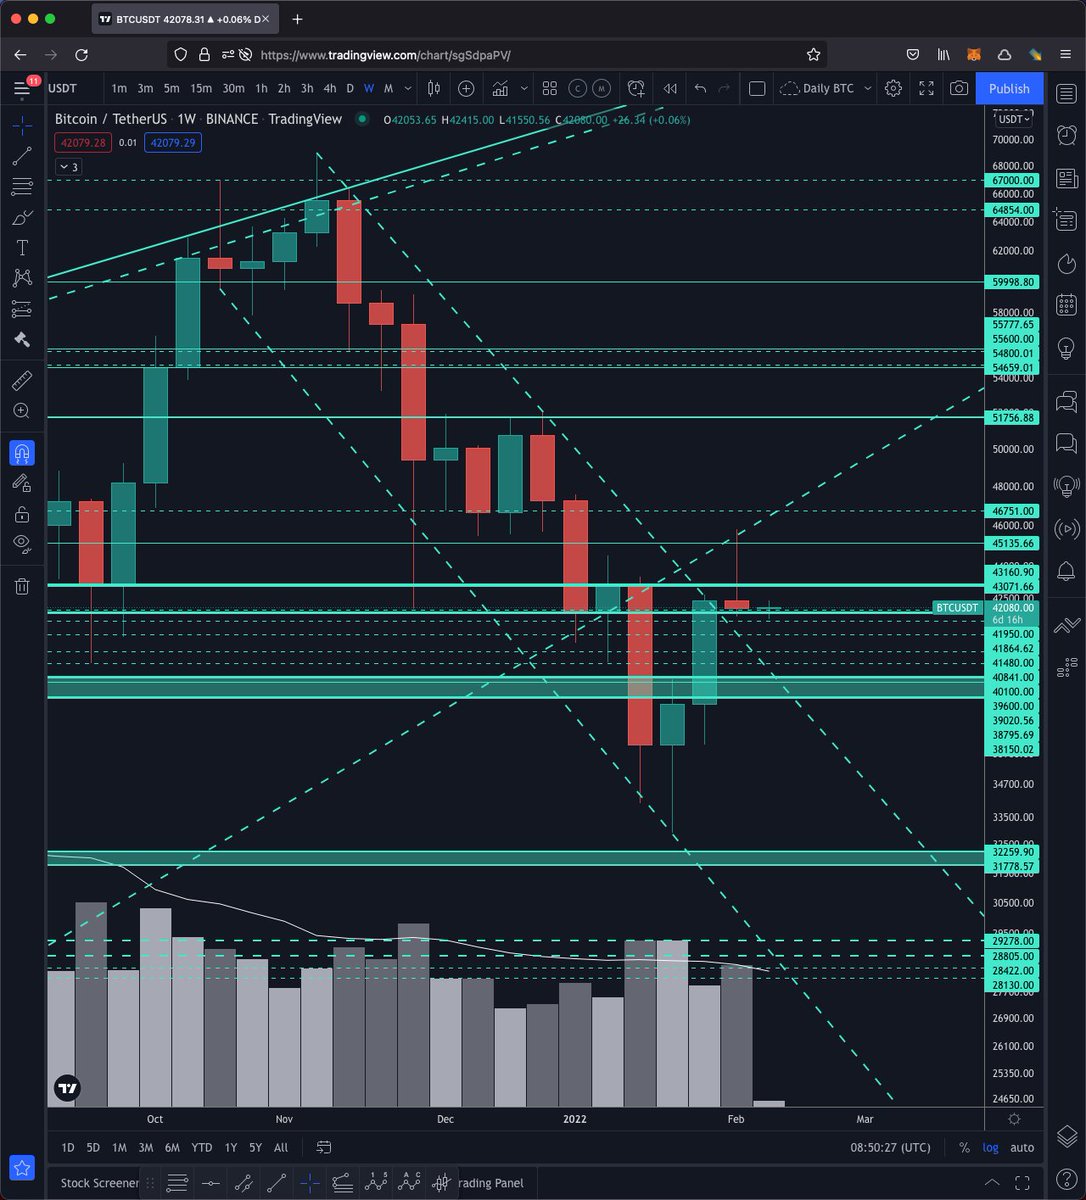
2) ribbon last week. As you can see, in July, price did not open and close a week under the ribbon (it had not yet turned to resistance) whereas this time there have been 5 weeks of open/close underneath the ribbon.
3) Also on the weekly chart for #Bitcoin we can see that although there has been a bullish breakout from the channel, price is struggling to continue higher. Still strong support around the 40/41k range.
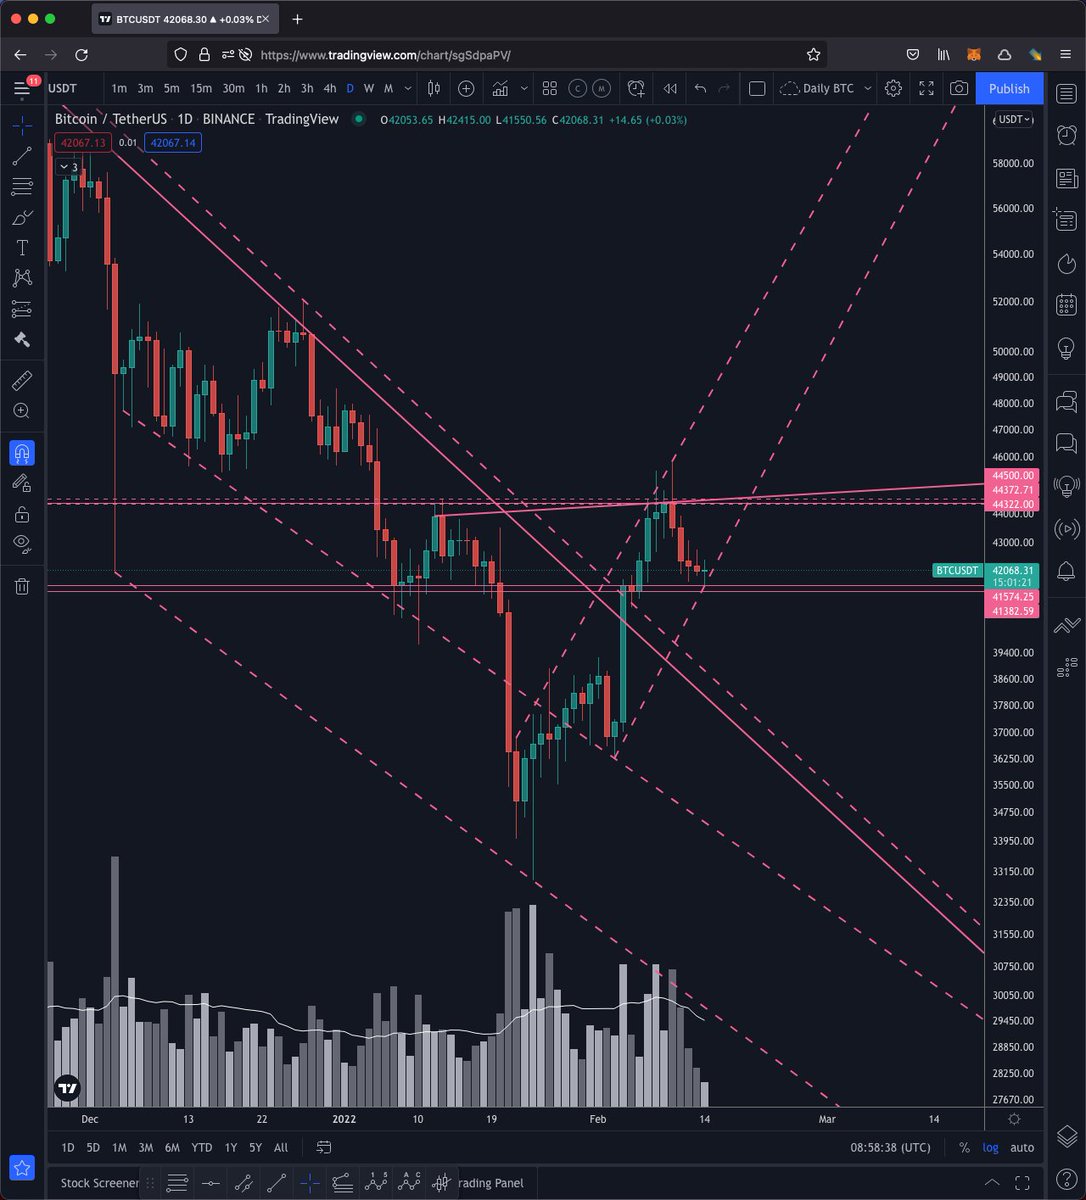
4) The #Bitcoin daily chart is bouncing off the very bottom of the ribbon and trying desperately to hold it as support.

5) Probably the most bullish chart for #Bitcoin structure wise, we can see price is getting support from the horizontal and over the last 3 days the size of the bearish candles have been getting smaller.
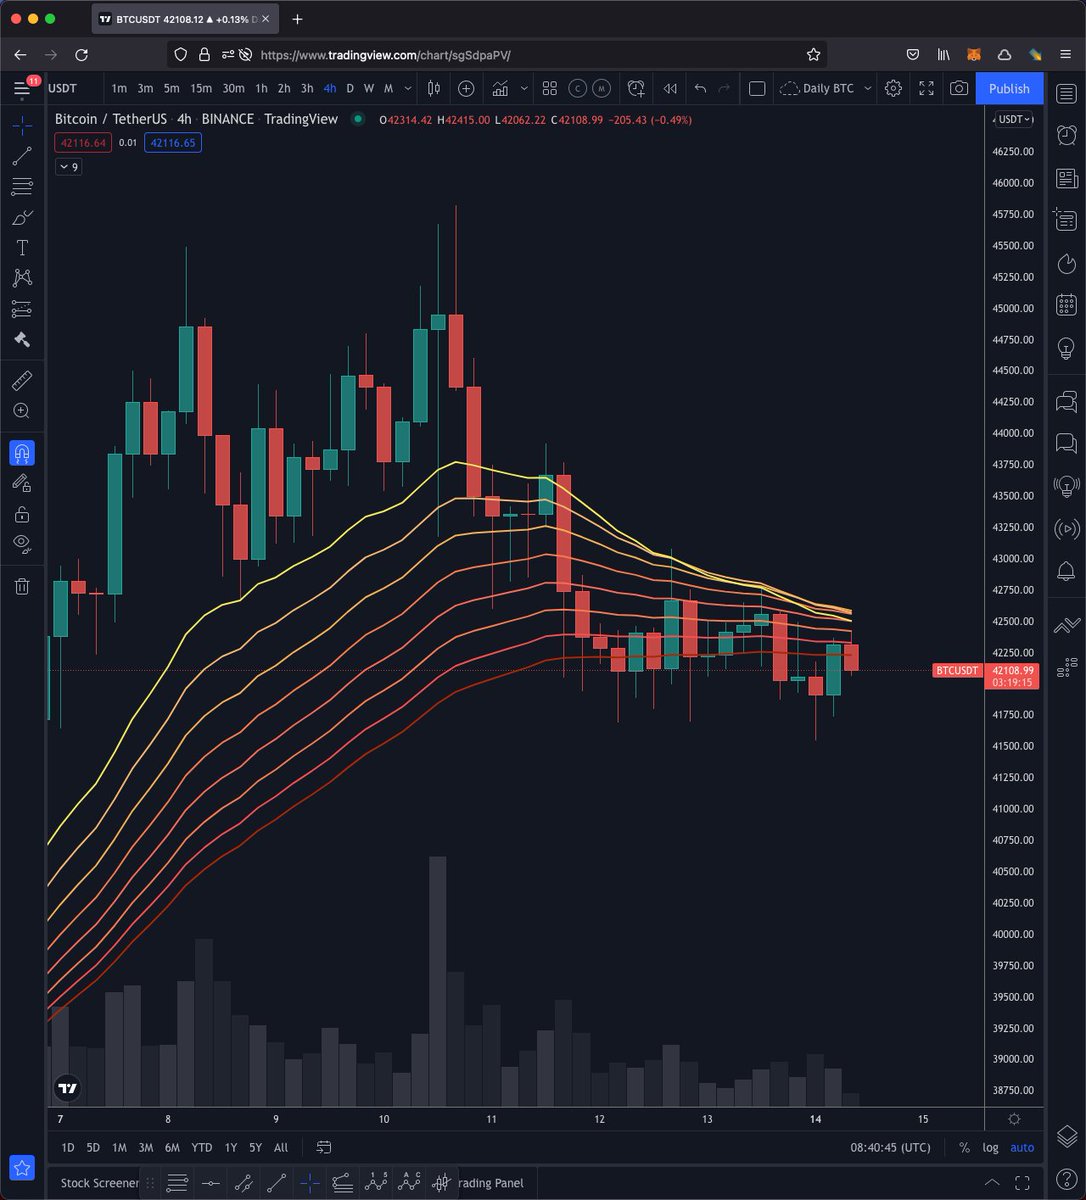
6) #Bitcoin 4 hour.
Price is back in the middle of the ribbon after failing to hold on top. It would seem the yellow line of the ribbon is slowly pushing price back down towards the bottom.
Price is back in the middle of the ribbon after failing to hold on top. It would seem the yellow line of the ribbon is slowly pushing price back down towards the bottom.
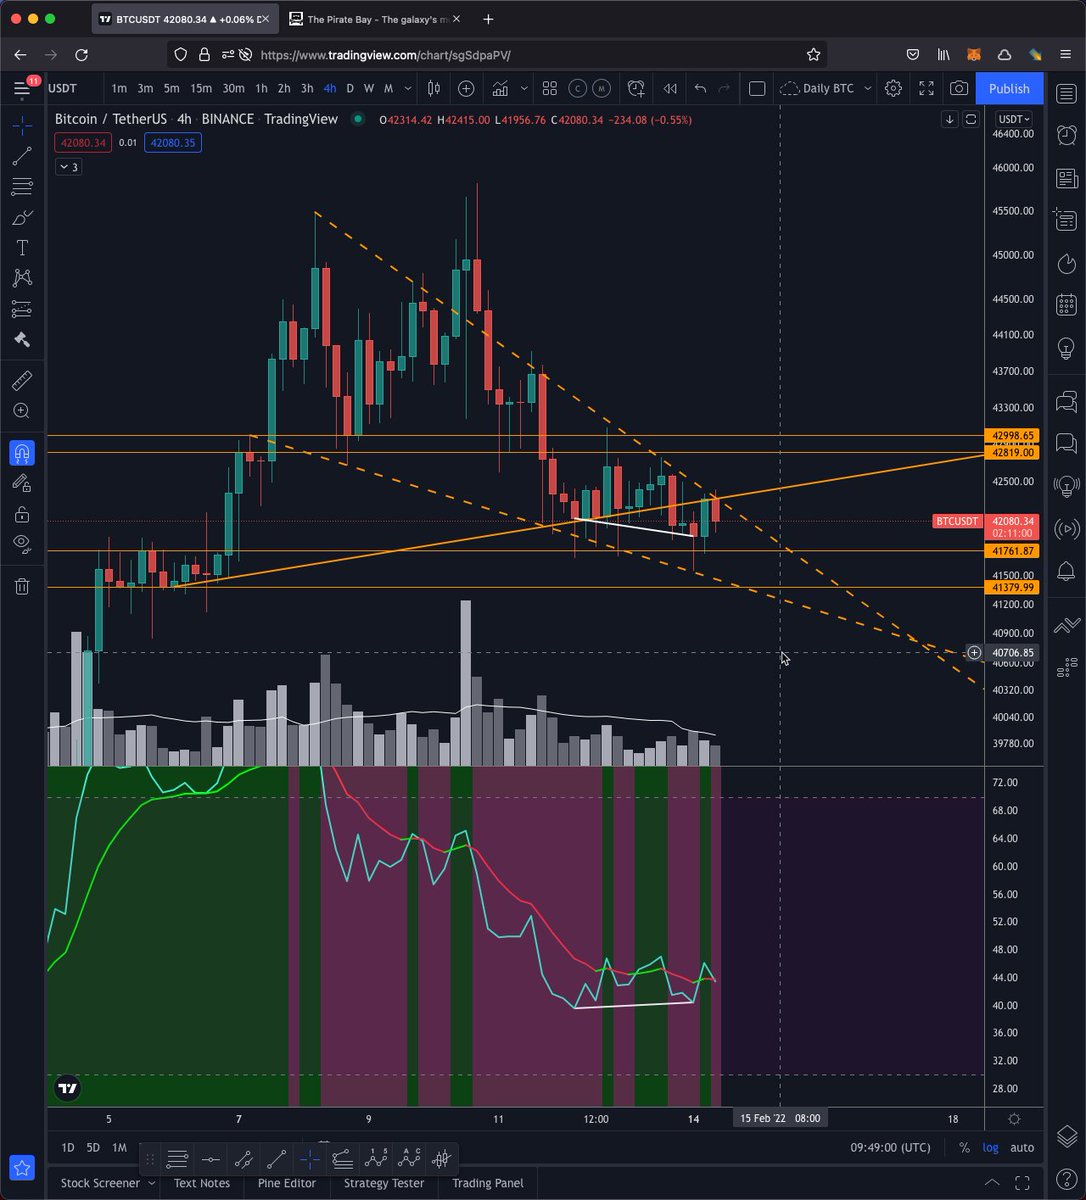
7) #Bitcoin H4
Price is in a falling wedge (bullish) with momentum slowing to the downside (bullish) alongside bullish divergence. However bulls have a very limited time left to break up and price is getting closer and closer to the area where it will take another leg down.
Price is in a falling wedge (bullish) with momentum slowing to the downside (bullish) alongside bullish divergence. However bulls have a very limited time left to break up and price is getting closer and closer to the area where it will take another leg down.
8) Colour code for my charts:
Monthly - Purple
Daily - Pink
Orange - 4 Hour
Yellow - 1 Hour and below
Moving Averages:
10 - Red
21- Yellow
50 - Green
100 - Blue
200 - White
Solid - SMA
Broken - EMA
Monthly - Purple
Daily - Pink
Orange - 4 Hour
Yellow - 1 Hour and below
Moving Averages:
10 - Red
21- Yellow
50 - Green
100 - Blue
200 - White
Solid - SMA
Broken - EMA
9) Have a great day and trade safely... More lower Timeframe analysis to come throughout the day. If you enjoyed this #Bitcoin Morning TA report, please follow, like and retweet!
Loading suggestions...