

#CCI is an indicator which is used in the #stockmarket
This learning thread would be on
"𝙐𝙨𝙚𝙨 𝙤𝙛 𝘾𝘾𝙄"
Also, an investment strategy and trading strategy is shared
If you appreciate this, a Like & Retweet will go a long way in maximizing the reach of this tweet♥️
1/19
This learning thread would be on
"𝙐𝙨𝙚𝙨 𝙤𝙛 𝘾𝘾𝙄"
Also, an investment strategy and trading strategy is shared
If you appreciate this, a Like & Retweet will go a long way in maximizing the reach of this tweet♥️
1/19
Before we start with various strategies, just a brief about Commodity Channel Index (CCI) which is a momentum-based oscillator used to help determine when an investment vehicle is reaching a condition of being overbought or oversold.
2/19
investopedia.com.
2/19
investopedia.com.

#CCI is freely available indicator on all charting platforms. I have added CCI indicator on @tradingview.
There are three important numbers in CCI which are -100, 0 and +100.
Shaded region marks range from -100 to +100.
3/19
There are three important numbers in CCI which are -100, 0 and +100.
Shaded region marks range from -100 to +100.
3/19

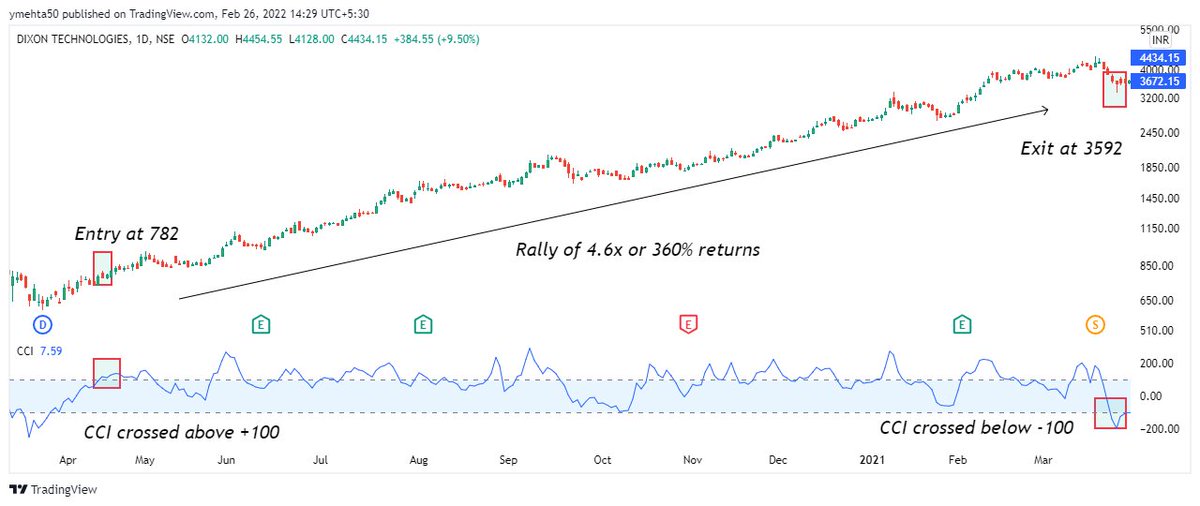
✅Using CCI for short-term trading
This is the simple strategy, which is explained theoretically .
1⃣ Buy stock if CCI crosses above +100
2⃣ Exit if CCI crosses below -100
Sharing a chart of Dixon which satisfied above criteria and stock has given 360% returns.
4/19
This is the simple strategy, which is explained theoretically .
1⃣ Buy stock if CCI crosses above +100
2⃣ Exit if CCI crosses below -100
Sharing a chart of Dixon which satisfied above criteria and stock has given 360% returns.
4/19
There is a major flaw in above setup. As the stock gave one sided upmove because of which returns are high. Such situation occurs rarely.
In Reliance, stock was in consolidation and CCI gave a lot of buying and selling signal which would lead to loss and frustration.
5/19
In Reliance, stock was in consolidation and CCI gave a lot of buying and selling signal which would lead to loss and frustration.
5/19

Is there anyway to use CCI to avoid such whipsaw?
Use CCI as a supportive indicator and not a primary tool to decide.
Add price action strategies such as breakouts to make sure that you get fewer entries signal.
6/19
Use CCI as a supportive indicator and not a primary tool to decide.
Add price action strategies such as breakouts to make sure that you get fewer entries signal.
6/19
Using CCI on higher time frame can increase your accuracy and can give fewer entry signals.
Daily time is for short term, weekly or monthly time frame can be used for positional trading or investment.
7/19
Daily time is for short term, weekly or monthly time frame can be used for positional trading or investment.
7/19
Sharing Pidilite chart on weekly time frame where price rallied from 289 to 540.
Profit of 87% in 2 years.
In case of higher time frame, risk will be slightly higher and reward will also be higher.
8/19
Profit of 87% in 2 years.
In case of higher time frame, risk will be slightly higher and reward will also be higher.
8/19

Now, let's continue with our strategy.
Starting with short-term trading strategy.
Earlier I told to remember three numbers: -100, 0, +100.
We will use same strategy as above only thing we will change is the numbers.
9/19
Starting with short-term trading strategy.
Earlier I told to remember three numbers: -100, 0, +100.
We will use same strategy as above only thing we will change is the numbers.
9/19
Swing #Trading Strategy:
1⃣ Buy if CCI crosses above -100
2⃣ Our Stoploss would be exit if CCI crosses below -100
3⃣ If CCI crosses above +100 after our buying, then Trailing Stoploss would be exit if CCI crosses below +100
4⃣ Daily Time Frame
Let's look at this in charts
10/19
1⃣ Buy if CCI crosses above -100
2⃣ Our Stoploss would be exit if CCI crosses below -100
3⃣ If CCI crosses above +100 after our buying, then Trailing Stoploss would be exit if CCI crosses below +100
4⃣ Daily Time Frame
Let's look at this in charts
10/19
HINDUNILVR chart on daily time frame is shared.
Once CCI crosses above -100, entry is triggered at 2380. CCI crossed above +100 and our TSL was CCI below -100.
This got hit and the exit was triggered at 2780.
Almost 400 points profit or 17% rally in 1 month.
11/19
Once CCI crosses above -100, entry is triggered at 2380. CCI crossed above +100 and our TSL was CCI below -100.
This got hit and the exit was triggered at 2780.
Almost 400 points profit or 17% rally in 1 month.
11/19

In above strategy, after our entry, if CCI again crosses below -100, then we can exit and loss would also be less. But if stock rally then reward will be big.
So basically this can be low risk high reward trade.
12/19
So basically this can be low risk high reward trade.
12/19
Also, tracking all the stocks is not possible, so create a basket of 10-20 stocks and track them daily.
How to create basket of stocks for watchlist. Just check and backtest how well the strategy had worked for the stocks in the past and then add it in the watchlist.
13/19
How to create basket of stocks for watchlist. Just check and backtest how well the strategy had worked for the stocks in the past and then add it in the watchlist.
13/19
Now let's see #investment strategy.
Frankly rules remain same for investment as well, the only thing which changes is the time frame.
For investment or positional trading, use weekly or monthly time frame.
14/19
Frankly rules remain same for investment as well, the only thing which changes is the time frame.
For investment or positional trading, use weekly or monthly time frame.
14/19
#Investment Strategy:
1⃣ Buy if CCI crosses above -100
2⃣ Our Stoploss would be exit if CCI crosses below -100
3⃣ If CCI crosses above +100 after our buying, then TSL would be exit if CCI crosses below +100
4⃣ Weekly/Monthly TF
5⃣ Pyramid if CCI crosses above 0 and +100.
15/19
1⃣ Buy if CCI crosses above -100
2⃣ Our Stoploss would be exit if CCI crosses below -100
3⃣ If CCI crosses above +100 after our buying, then TSL would be exit if CCI crosses below +100
4⃣ Weekly/Monthly TF
5⃣ Pyramid if CCI crosses above 0 and +100.
15/19
Let's see some charts.
#Nestle monthly chart is shared.
it gave entry at 5700 when CCI crossed above -100.
Exit triggered when CCI crossed below +100.
It gave a profit of 70% in 2 years.
16/19
#Nestle monthly chart is shared.
it gave entry at 5700 when CCI crossed above -100.
Exit triggered when CCI crossed below +100.
It gave a profit of 70% in 2 years.
16/19

FYI: Nestle was in controversy because of Maggi and stock price crashed badly. So this strategy would have caught the bottom of the Nestle.
This strategy can help in identifying bottom and picking stock just before reversal starts.
This is how #investment strategy works.
17/19
This strategy can help in identifying bottom and picking stock just before reversal starts.
This is how #investment strategy works.
17/19
All the strategies that are shared is easy only if one follows all the rules.
Key point is to sit with the patience for the returns, trail stoploss and exit if you are wrong.
As quoted by Jesse #Livermore: "Sit tight when you are Right"
18/19
Key point is to sit with the patience for the returns, trail stoploss and exit if you are wrong.
As quoted by Jesse #Livermore: "Sit tight when you are Right"
18/19
I hope everyone understood of how #CCI can be used.
These are not a universal rules one must follow. One can create their rule or follow someone else rules.
Only important thing is one must follow a fix rule instead of tweaking or changing setup frequently.
19/19
These are not a universal rules one must follow. One can create their rule or follow someone else rules.
Only important thing is one must follow a fix rule instead of tweaking or changing setup frequently.
19/19
Loading suggestions...