

In my free weekly note to investors, the macroeconomic analysis discussed commodity prices & the tailwinds from inflationary pressures.
This week, we're seeing continued momentum in commodities across the board: energy, metals, food inputs, etc.
calebfranzen.substack.com
This week, we're seeing continued momentum in commodities across the board: energy, metals, food inputs, etc.
calebfranzen.substack.com
The Bloomberg Commodity Index, $BCOM, has been relentless. It's shattered every major potential resistance level & continues to trend higher.
This weekly chart since 2014 speaks for itself. So far in 2022, it's gained +19%! Only 1 down week in 2022.
This weekly chart since 2014 speaks for itself. So far in 2022, it's gained +19%! Only 1 down week in 2022.
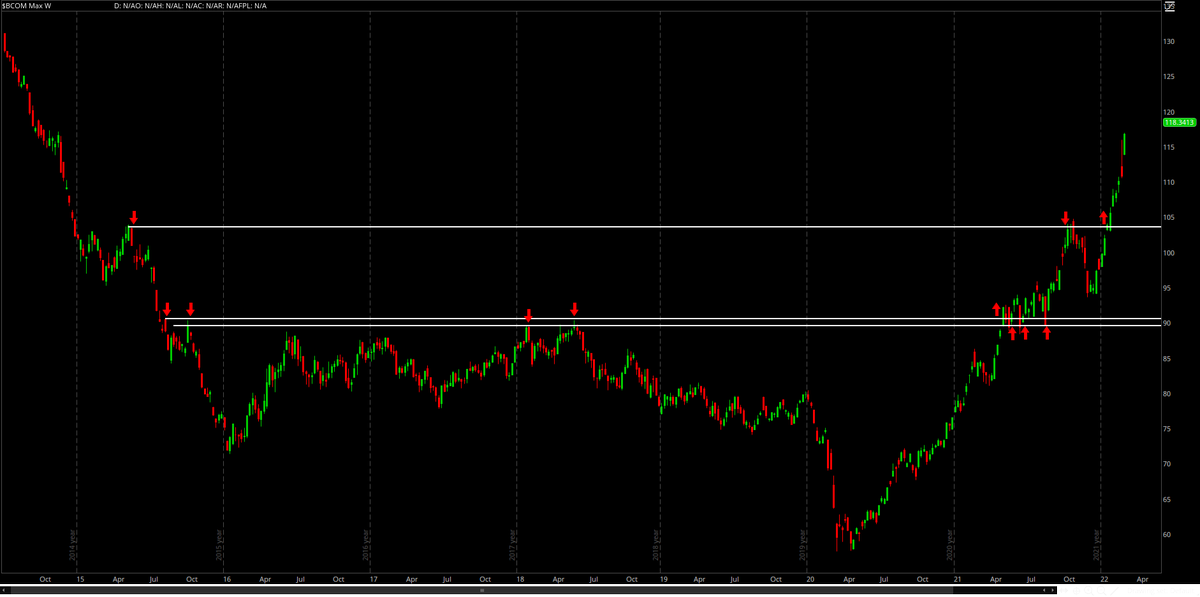
The Index has a 33% weighting to energy-related commodities, specifically oil & gas.
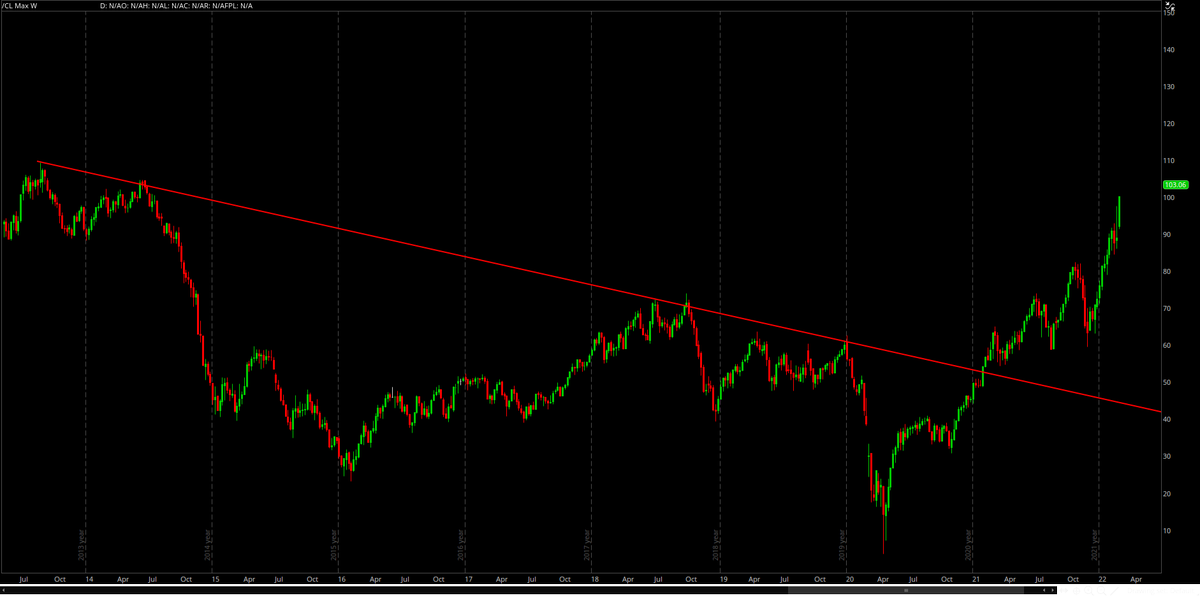
To no surprise, oil has been on fire.
If we look at the weekly chart since 2013, this wedge breakout has provided a launch-pad to extend higher.
To no surprise, oil has been on fire.
If we look at the weekly chart since 2013, this wedge breakout has provided a launch-pad to extend higher.
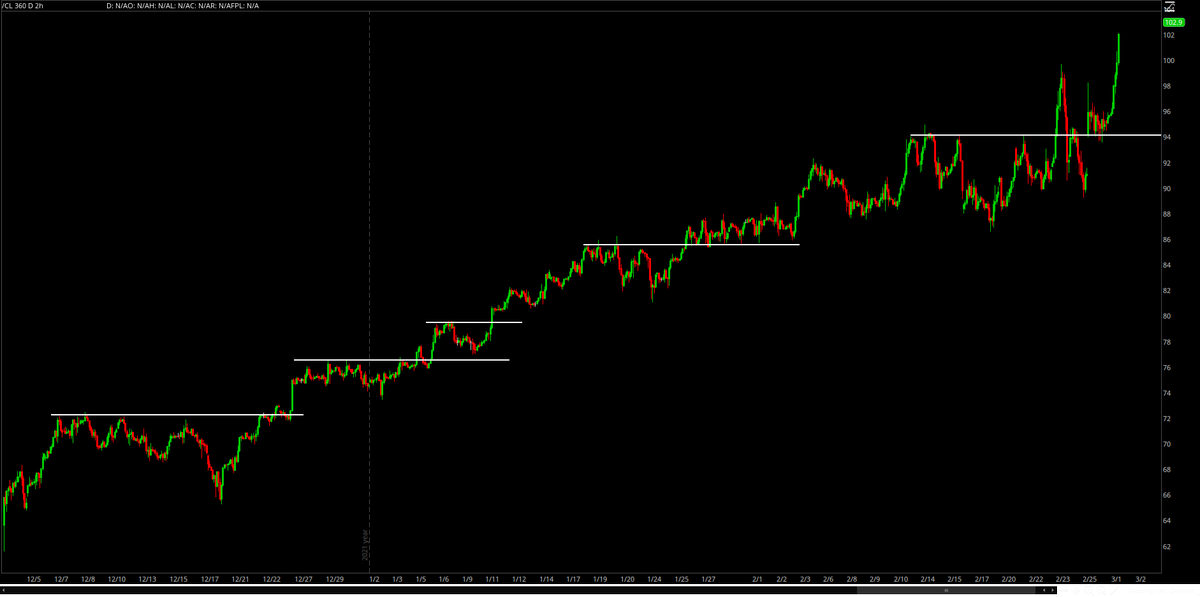
Staying on crude oil, here's a short-term view w/ 2hr candles.
Breakout, extension, consolidation, repeat.
Crude oil futures are +7.7% today.
Breakout, extension, consolidation, repeat.
Crude oil futures are +7.7% today.
Natural gas has an interesting long-term chart also.
We retested the multi-year highs from 2013 at the end of 2021, but got rejected.
Price of natural gas futures fell -45% in less than 3 months, but have now gained +27% from the December 2021 lows.
The red wedge is key.
We retested the multi-year highs from 2013 at the end of 2021, but got rejected.
Price of natural gas futures fell -45% in less than 3 months, but have now gained +27% from the December 2021 lows.
The red wedge is key.

As I look at these charts & the macro environment, it almost feels too obvious that the tailwinds are strong.
Is it too consensus? Perhaps.
We're seeing clear momentum across the board in commodities markets. Some even make the case that #Bitcoin falls into this group.
Is it too consensus? Perhaps.
We're seeing clear momentum across the board in commodities markets. Some even make the case that #Bitcoin falls into this group.
$BTC's acceleration dwarfs everything else, up +495% since January 2020 and up +1,025% since the COVID lows.
In linear scale, the price action over the past 14 months is unquestionably volatile.
In linear scale, the price action over the past 14 months is unquestionably volatile.
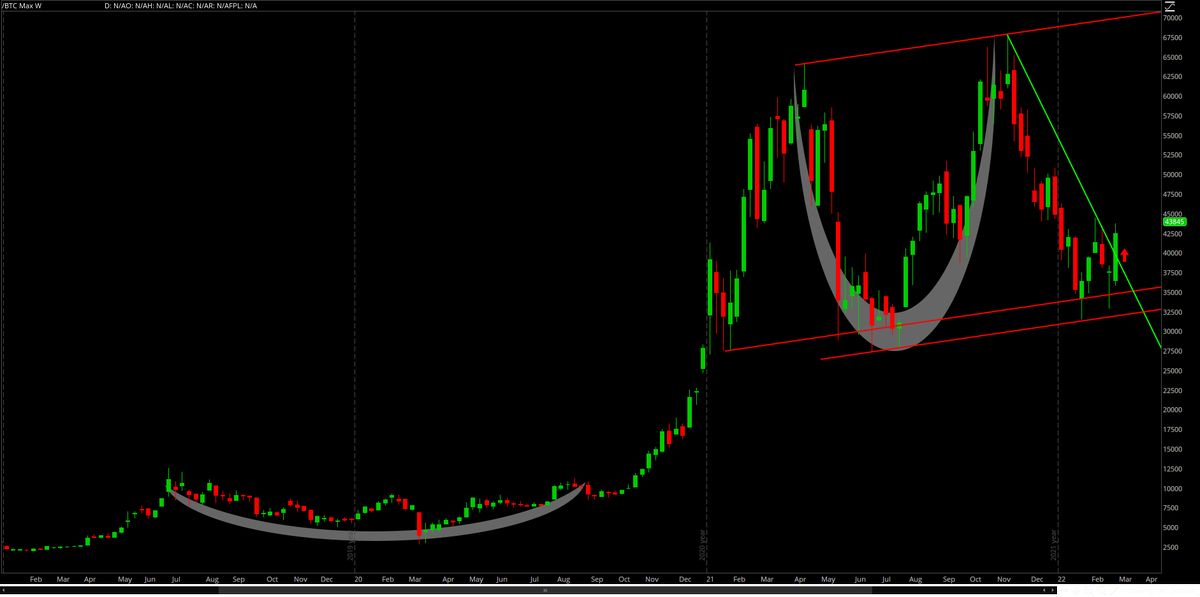
In logarithmic scale, #Bitcoin price action becomes much more digestible.
Higher highs & higher lows.
Does Bitcoin benefit from the same tailwinds as traditional commodities? I believe so, as they all benefit from an inflationary environment, among other things.
I'm bullish.
Higher highs & higher lows.
Does Bitcoin benefit from the same tailwinds as traditional commodities? I believe so, as they all benefit from an inflationary environment, among other things.
I'm bullish.

Loading suggestions...