

🚨 PATTERNS EVERY TRADER SHOULD KNOW 🚨
THREAD 👇
♥️ AND RT IF THIS HELPS YOU!
THREAD 👇
♥️ AND RT IF THIS HELPS YOU!
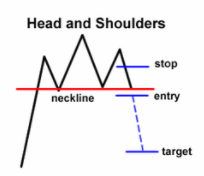
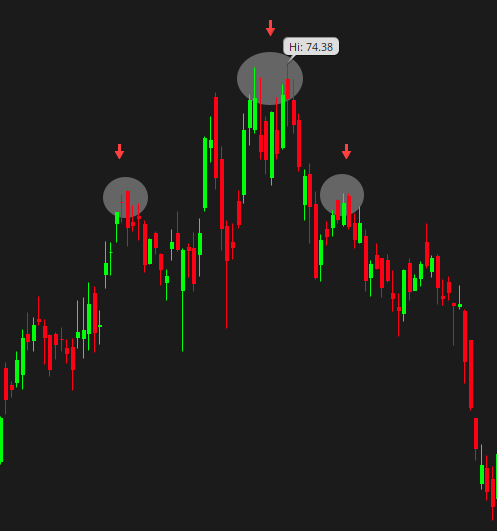
1) Head and Shoulders
One of the best "top" patterns, has varying accuracy but works extremely well. Predicts a bullish to bearish trend reversal. Fails to make highs on the third shoulder, usually stops at the level of first shoulder before a sharp decline
One of the best "top" patterns, has varying accuracy but works extremely well. Predicts a bullish to bearish trend reversal. Fails to make highs on the third shoulder, usually stops at the level of first shoulder before a sharp decline
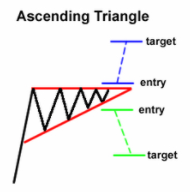
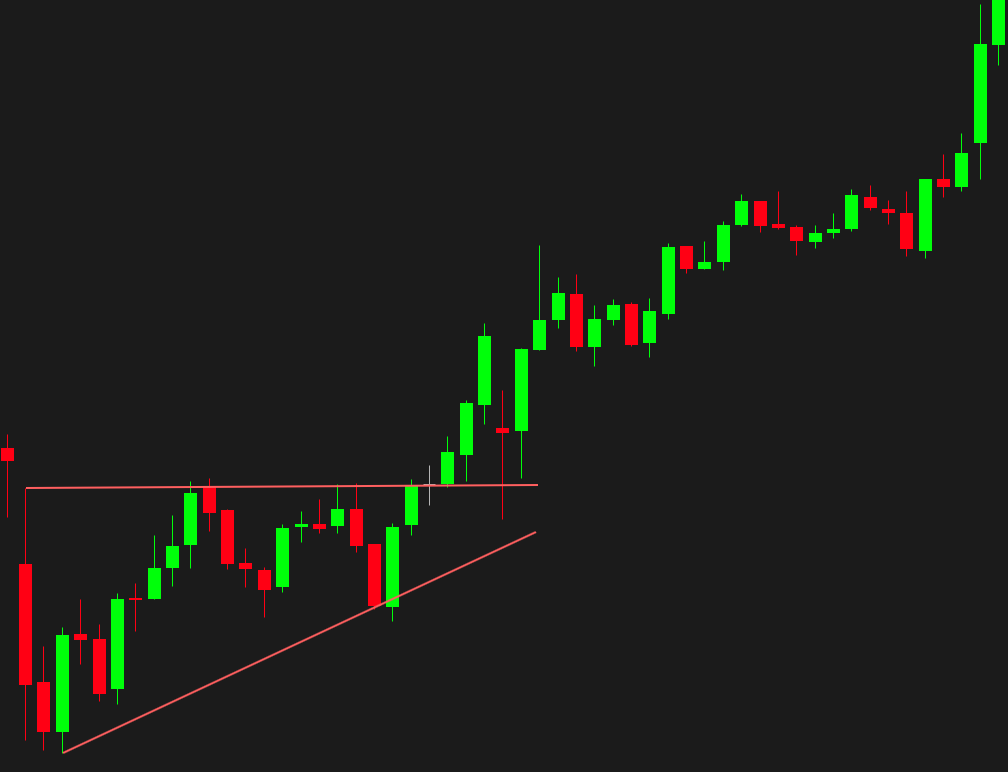
2) Ascending Triangle
A continuation patterns used by traders to gauge a breakout. Two lines (flat highs and higher lows) create a triangle pattern that usually follows a big breakout after price action tightens in this range.
A continuation patterns used by traders to gauge a breakout. Two lines (flat highs and higher lows) create a triangle pattern that usually follows a big breakout after price action tightens in this range.
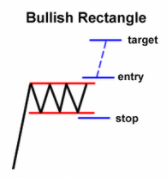
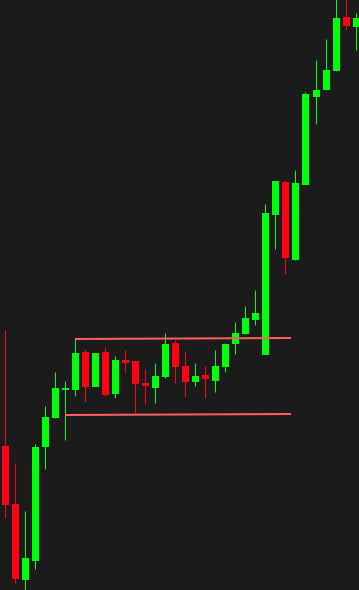
3) Bull flag / Rectangle
Bullish continuation pattern, resembling a flag on a pole. Can be a rectangle, or angled down. After a strong rally, the stock refuses to drop, lots of buying pressure in the consolidation range leads to an explosive move to the upside once broken.
Bullish continuation pattern, resembling a flag on a pole. Can be a rectangle, or angled down. After a strong rally, the stock refuses to drop, lots of buying pressure in the consolidation range leads to an explosive move to the upside once broken.
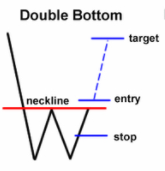
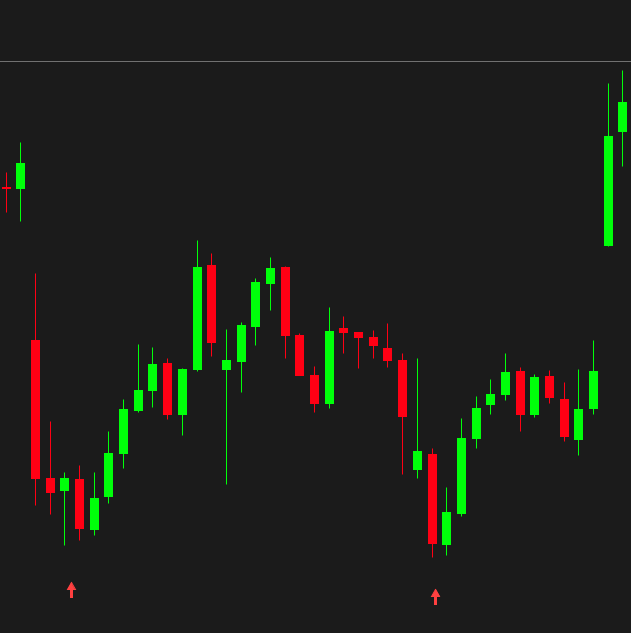
4) Double Bottom
Underlying bounces from a level and retraces down to the same level. Lots of buyers are waiting at these levels to drive price right back up. This is shaped like a "W". always follows a downtrend, and signals the beginning of a potential uptrend.
Underlying bounces from a level and retraces down to the same level. Lots of buyers are waiting at these levels to drive price right back up. This is shaped like a "W". always follows a downtrend, and signals the beginning of a potential uptrend.
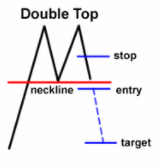
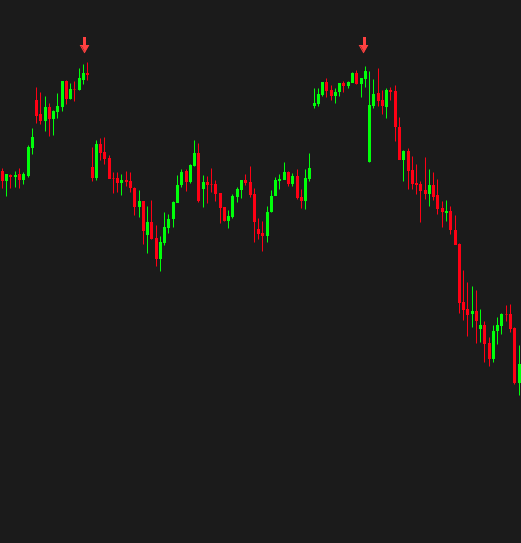
5) Double Top
The exact opposite of a double bottom pattern. Shaped like an "M" and is followed by an uptrend, with sellers waiting at the top waiting to drive price right back down. Bullish to bearish reversal pattern
The exact opposite of a double bottom pattern. Shaped like an "M" and is followed by an uptrend, with sellers waiting at the top waiting to drive price right back down. Bullish to bearish reversal pattern
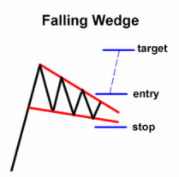
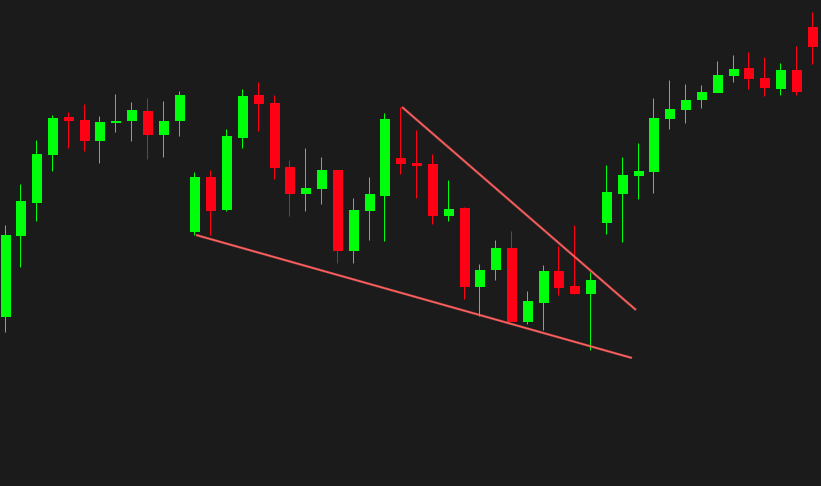
6) Falling Wedge
Always marked by converging trend lines on a price chart. When the underlying has been in a downtrend, wedges are often formed with declining volume, signaling a final lower low before we break out and make new highs. Bearish to bullish reversal pattern
Always marked by converging trend lines on a price chart. When the underlying has been in a downtrend, wedges are often formed with declining volume, signaling a final lower low before we break out and make new highs. Bearish to bullish reversal pattern
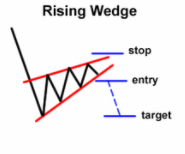
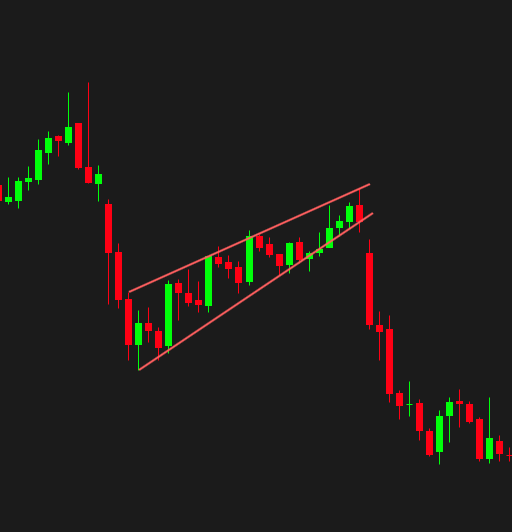
7) Rising Wedge
Opposite of a falling wedge, is used a bullish to bearish trend reversal sign. Stock makes higher highs on lower volume, which is usually followed by a big leg down
Opposite of a falling wedge, is used a bullish to bearish trend reversal sign. Stock makes higher highs on lower volume, which is usually followed by a big leg down
Loading suggestions...