


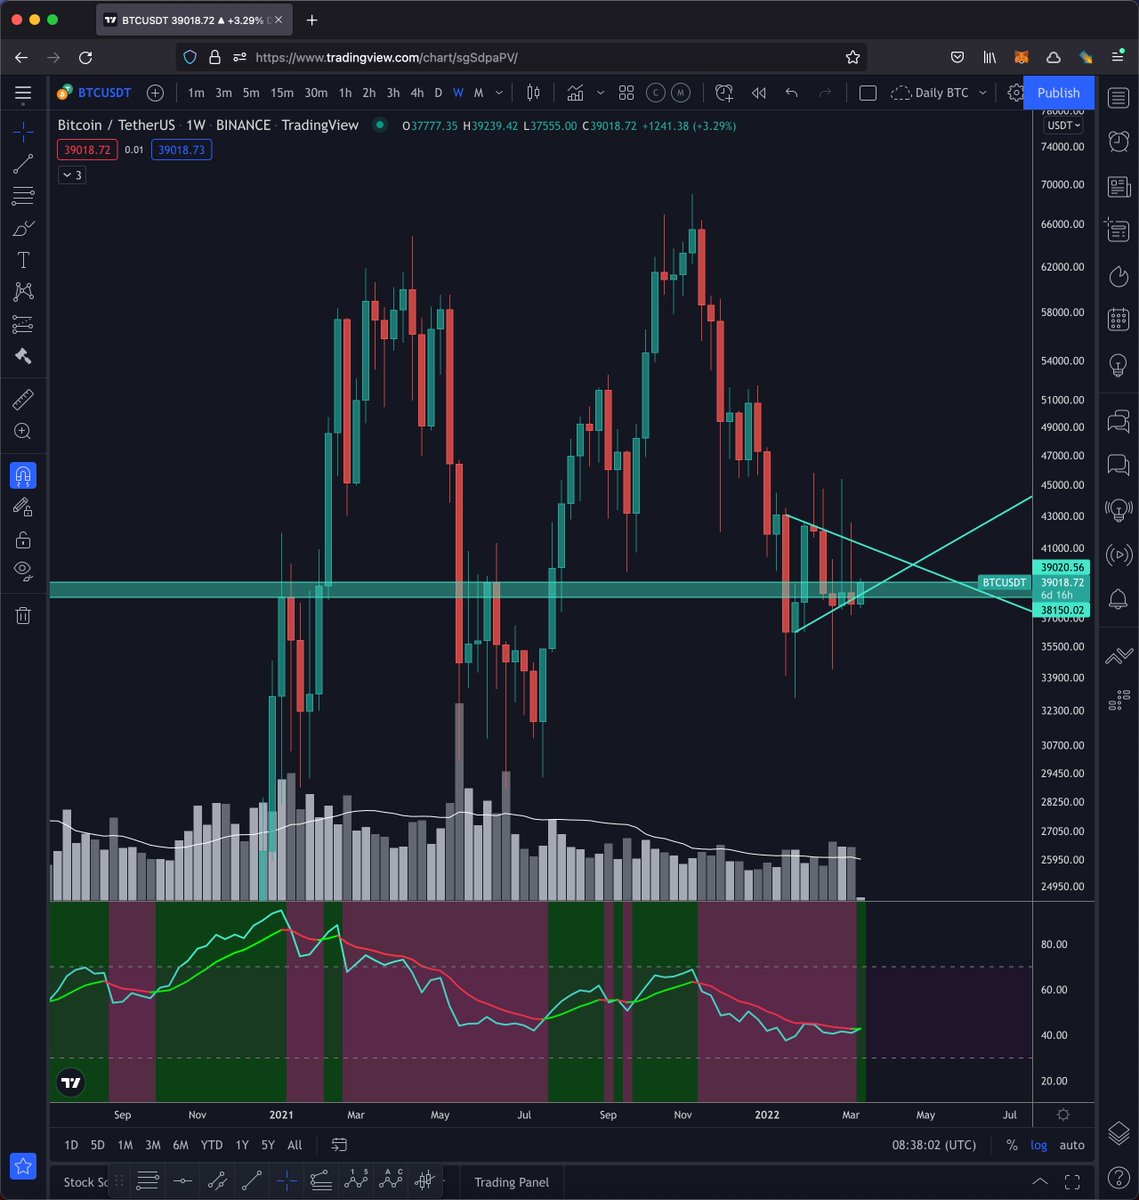
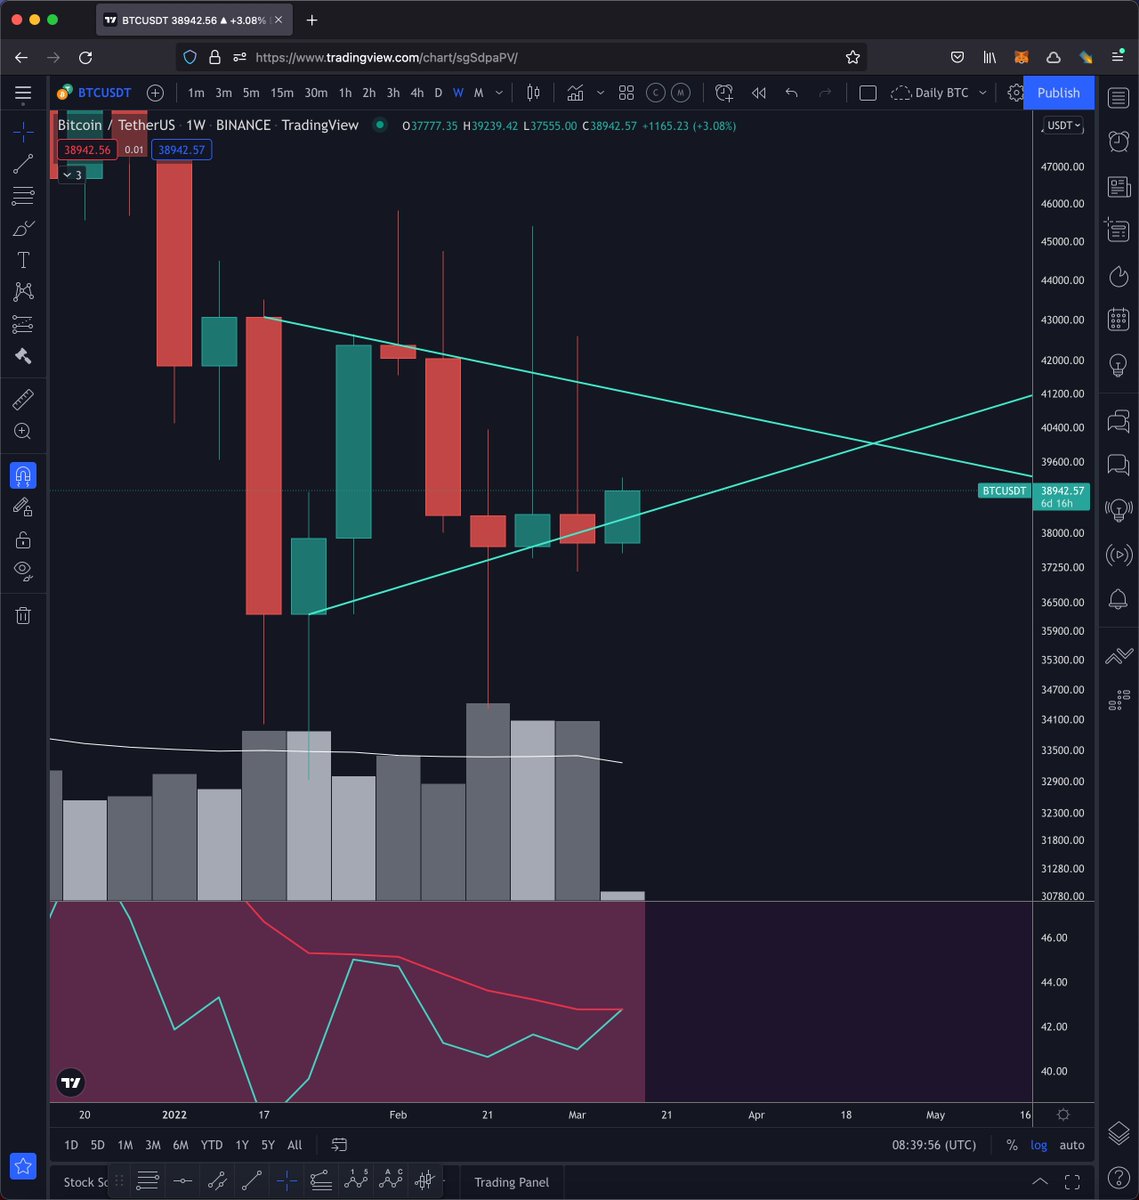
2) #Bitcoin Weekly Chart
Bitcoin had a poor close on the weekly chart - breaking the triangle structure that had formed and at the same time closing under the cyan band of historical support / resistance. Additionally, the weekly RSI closed underneath the mean RSI line.
Bitcoin had a poor close on the weekly chart - breaking the triangle structure that had formed and at the same time closing under the cyan band of historical support / resistance. Additionally, the weekly RSI closed underneath the mean RSI line.
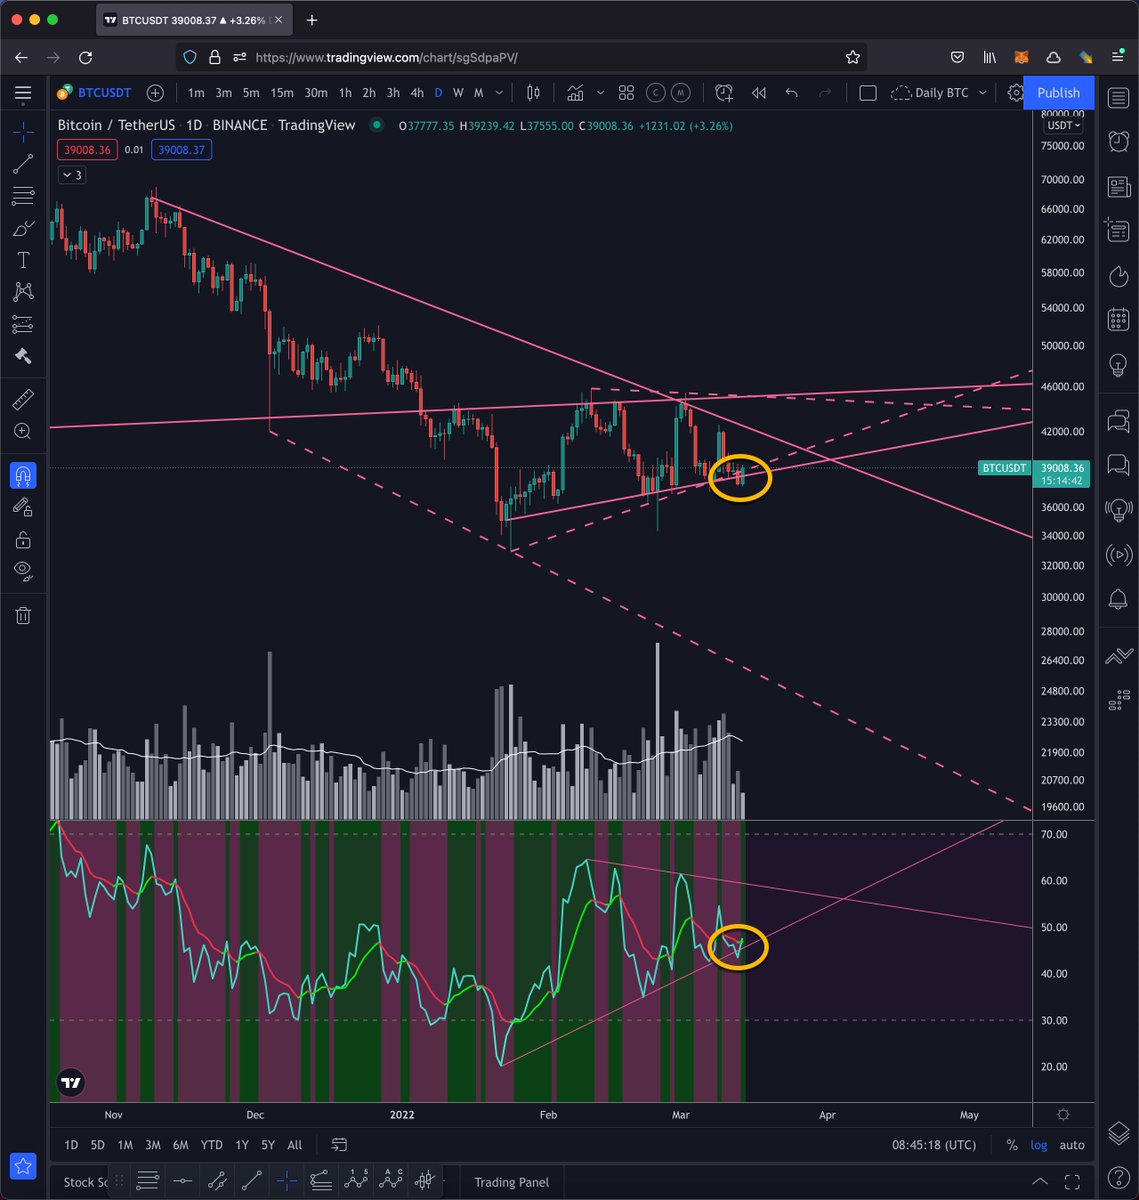
3) #Bitcoin Daily Chart
Similar on the daily, the close was not good. Price closed under that daily trend line that has been forming since the 24th January, and there was also a break of structure on the daily RSI.
Similar on the daily, the close was not good. Price closed under that daily trend line that has been forming since the 24th January, and there was also a break of structure on the daily RSI.
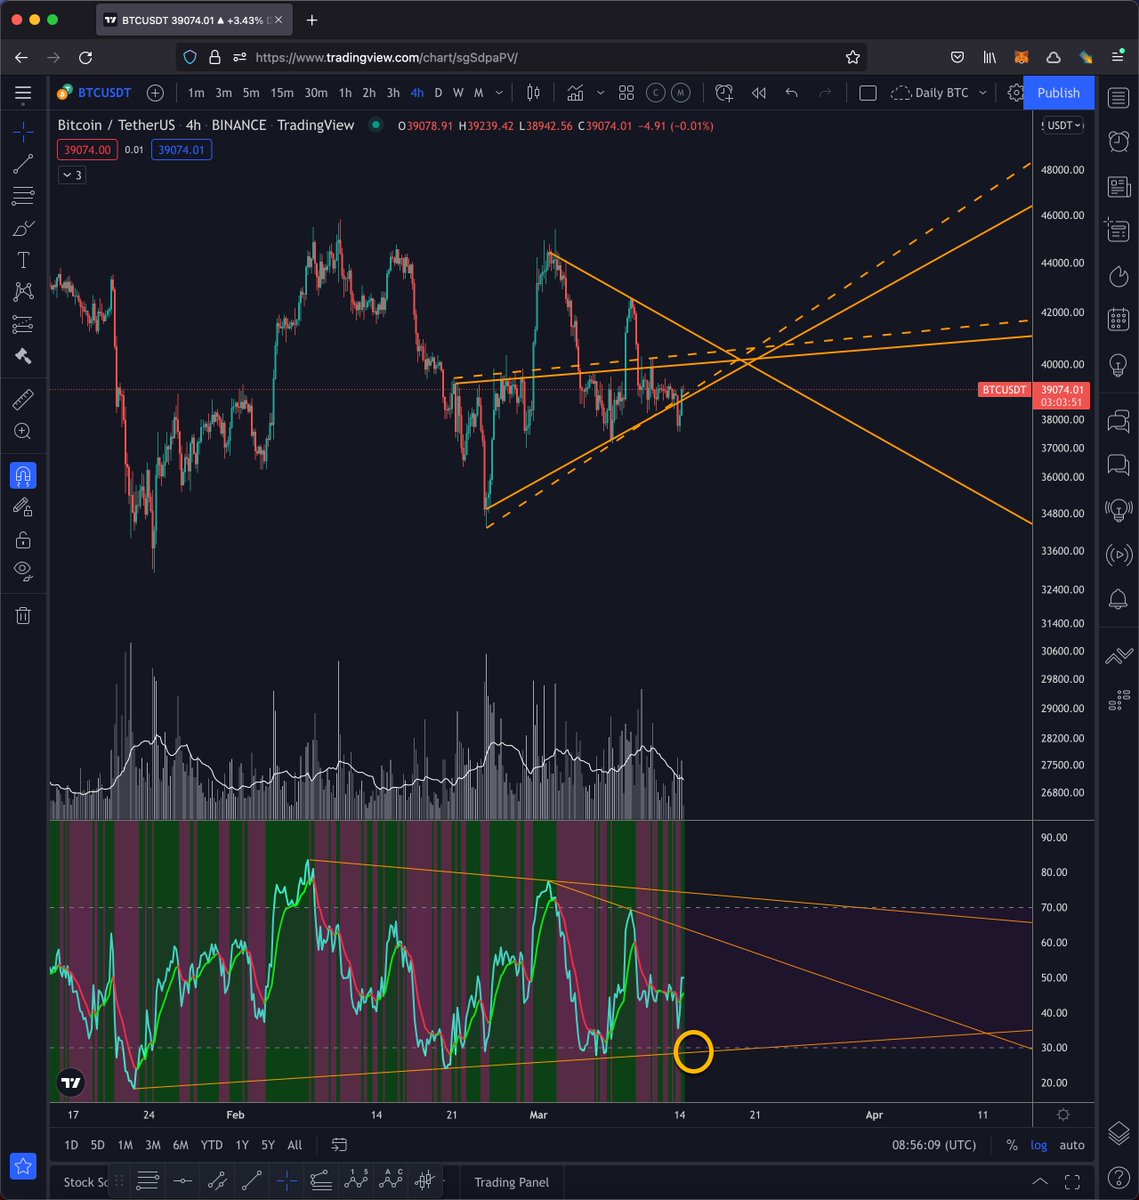
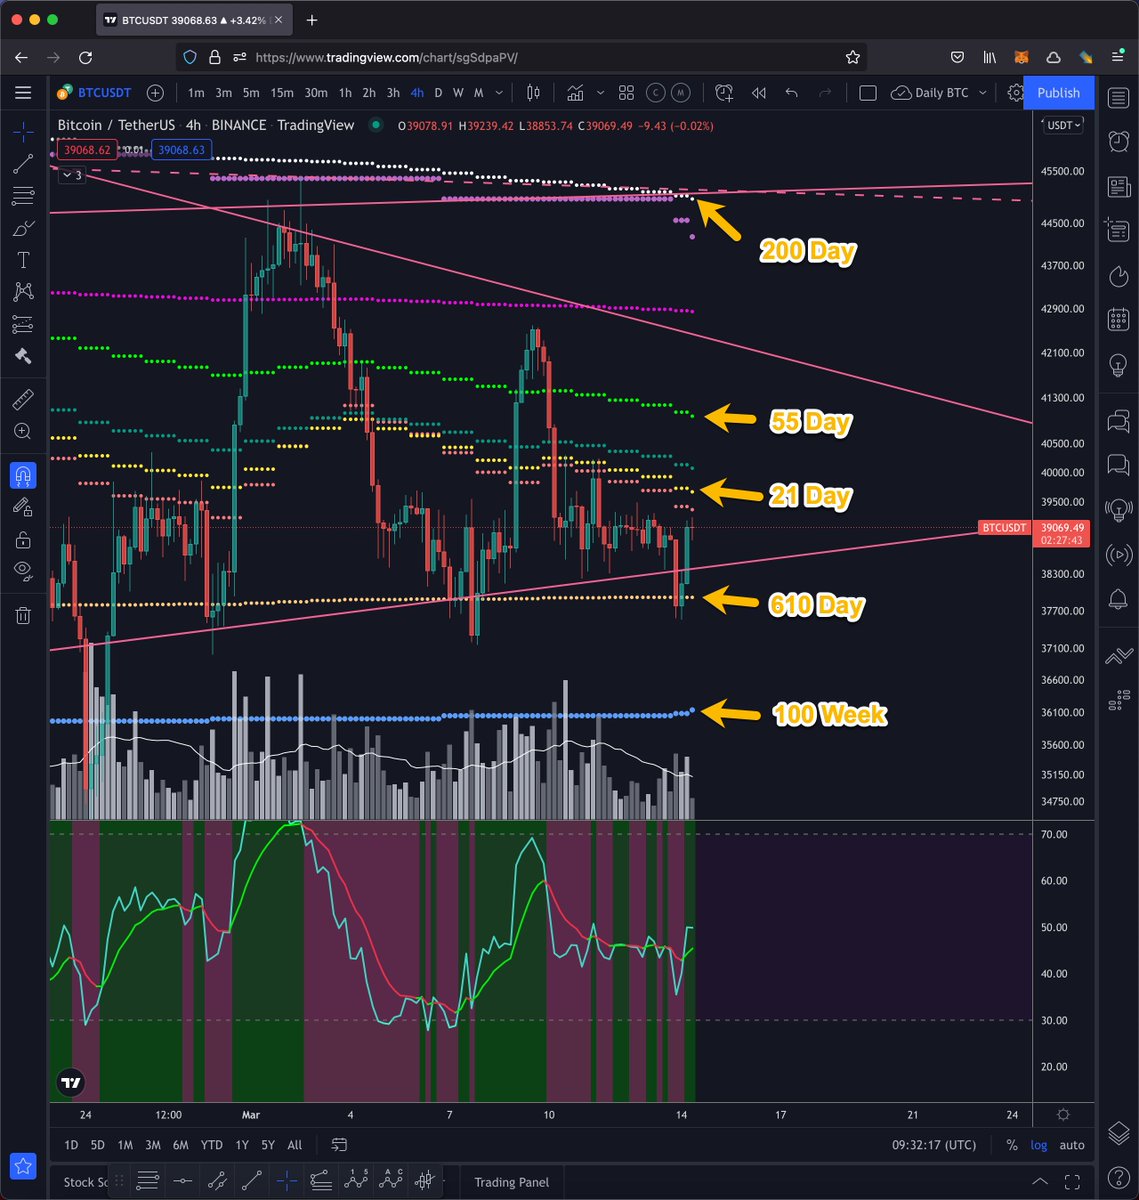
5) Multi Timeframe EMAs
Here are some important support and resistance EMAs for the current range.
Here are some important support and resistance EMAs for the current range.
Colour code for my charts:
Monthly - Purple
Daily - Pink
Orange - 4 Hour
Yellow - 1 Hour and below
Moving Averages:
10 - Red
21- Yellow
50 - Green
100 - Blue
200 - White
Solid - SMA
Broken - EMA
Monthly - Purple
Daily - Pink
Orange - 4 Hour
Yellow - 1 Hour and below
Moving Averages:
10 - Red
21- Yellow
50 - Green
100 - Blue
200 - White
Solid - SMA
Broken - EMA
Have a great day and trade safely... More lower Timeframe analysis to come throughout the day. If you enjoyed this #Bitcoin Morning TA report, please follow, like and retweet!
Loading suggestions...