


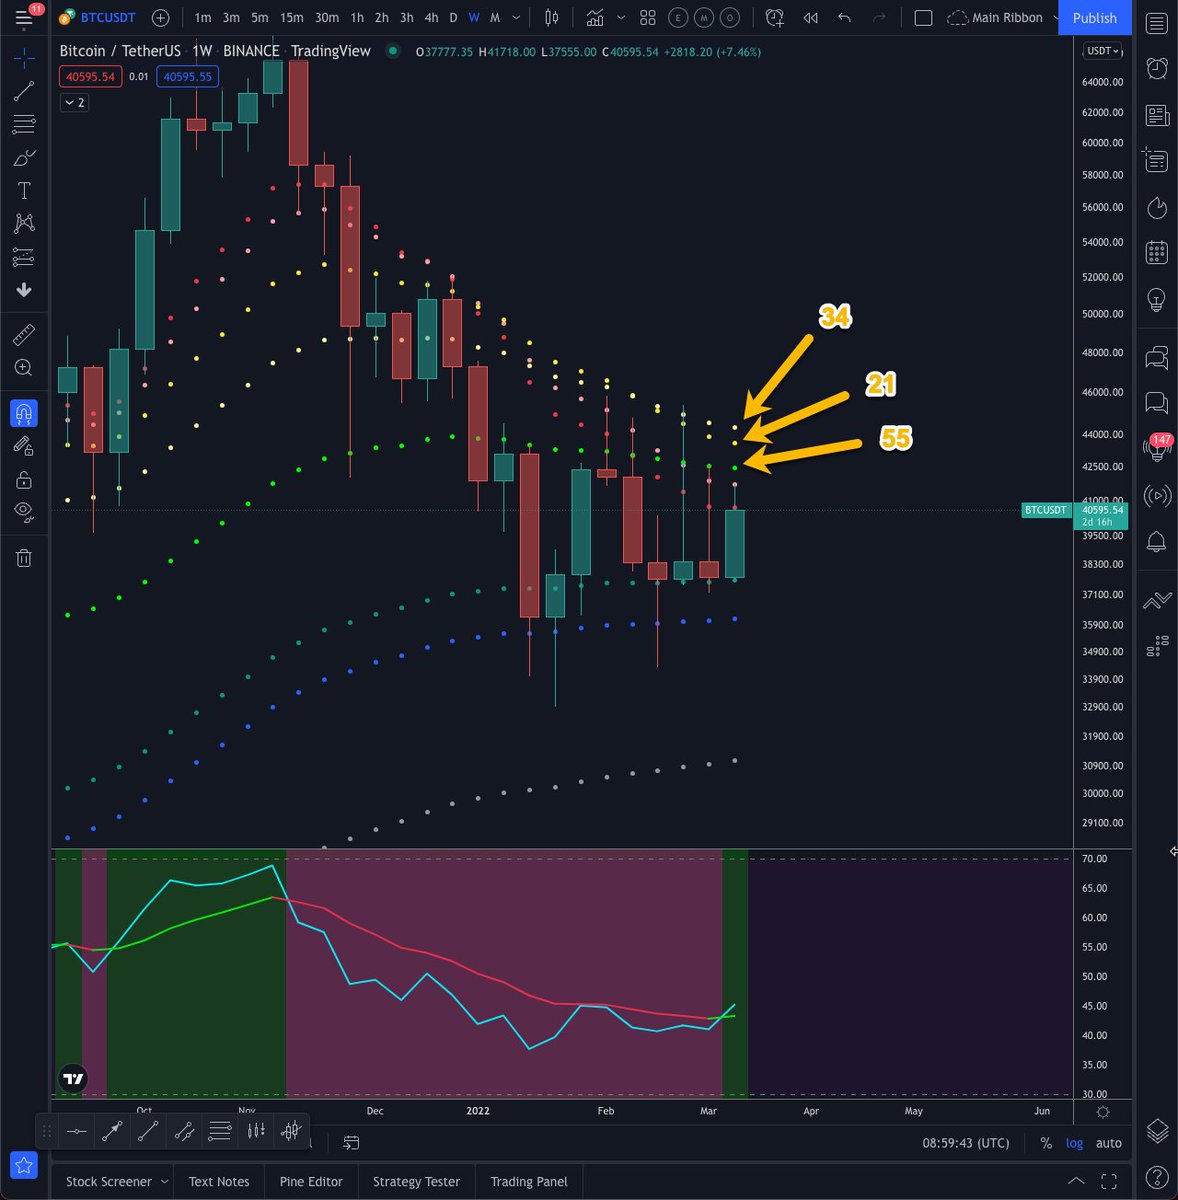
2) #Bitcoin Weekly Chart
Here we can see the main weekly EMA resistances
- 55 week EMA (42450)
- 21 week EMA (43585)
- 34 week EMA (44322)
Here we can see the main weekly EMA resistances
- 55 week EMA (42450)
- 21 week EMA (43585)
- 34 week EMA (44322)
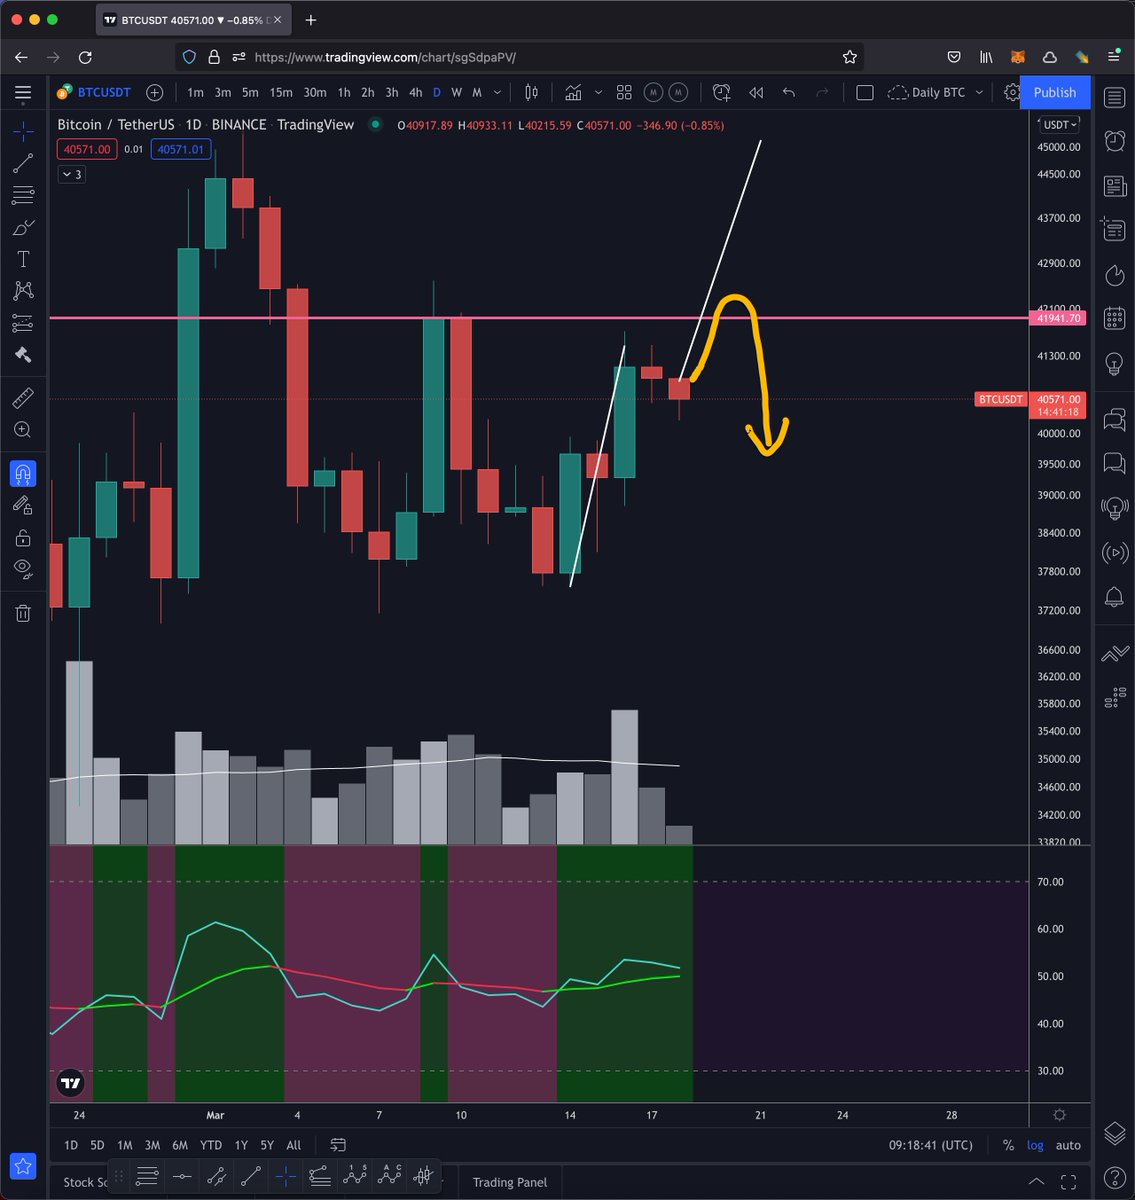
3) #Bitcoin Daily Chart
On the daily, we are in the middle of the range with a very real possibility of revisiting the top. We have had a 2 day consolidation here - I think bulls are aware of the intense resistance above (see weekly chart above). Lower high if we drop from here
On the daily, we are in the middle of the range with a very real possibility of revisiting the top. We have had a 2 day consolidation here - I think bulls are aware of the intense resistance above (see weekly chart above). Lower high if we drop from here

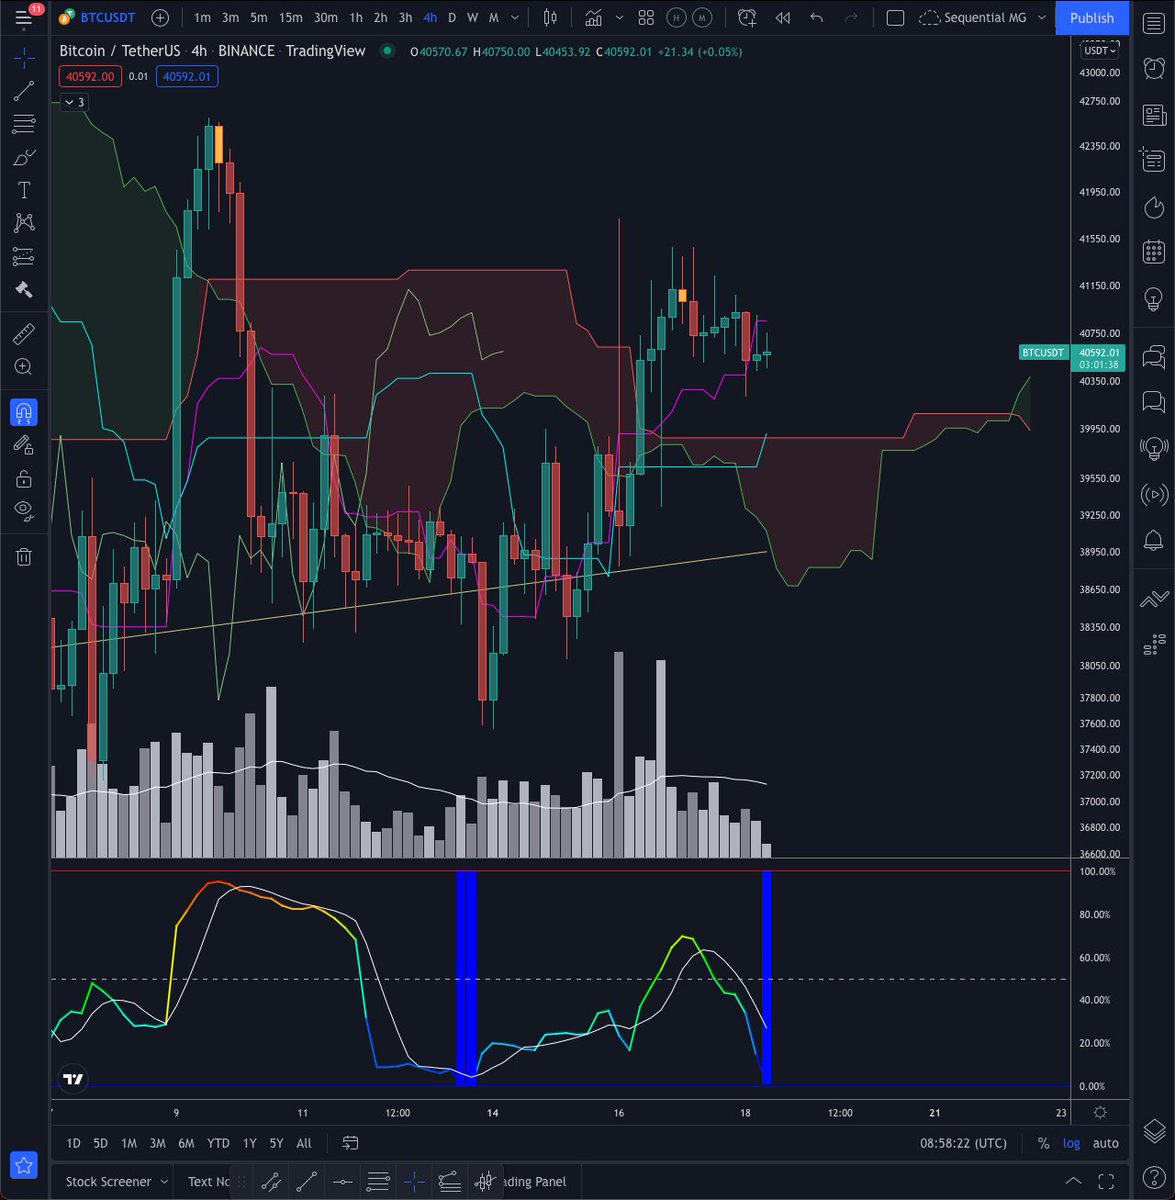
4) #Bitcoin 4 Hour Chart
Price is holding above the 4 hour Ichimoko cloud. We have a blue bar printing on the 4 hour BBWP (Bollinger Band Width Percentile) and this is indicating that the Bollinger bands have contracted and we are likely gearing up for a move!
Price is holding above the 4 hour Ichimoko cloud. We have a blue bar printing on the 4 hour BBWP (Bollinger Band Width Percentile) and this is indicating that the Bollinger bands have contracted and we are likely gearing up for a move!
5) #Bitcoin 4 Hour Chart
Here we see a bull flag with a projected technical target of the flag pole.
Target it gives: 45k
Wouldn't you know? That matches with our daily top trend line - have a look back at number 3) in this trend!
Here we see a bull flag with a projected technical target of the flag pole.
Target it gives: 45k
Wouldn't you know? That matches with our daily top trend line - have a look back at number 3) in this trend!

6) My thoughts:
We are at a key decision point in this move. Do we put in a lower high and continue back down from here, or is this a bull flag and we make a move towards the top of the range (45k)?
We are at a key decision point in this move. Do we put in a lower high and continue back down from here, or is this a bull flag and we make a move towards the top of the range (45k)?
7) A final possibility is an attempted move higher and get a strong rejection in the 42 - 42.6k area - in other words, we still make that lower high and continue back down. I'm keeping aware of all these possibilities and only conducting short term trades for now.
8) Colour code for my charts:
Monthly - Purple
Daily - Pink
Orange - 4 Hour
Yellow - 1 Hour and below
EMA Moving Averages:
10 - Red
13 - Salmon
21- Yellow
34 - Lt Yellow
55 - Green
89 - Olive
100 - Blue
144 - Grey
200 - White
233 - Purple
377 - Pink
610 - Mustard
Monthly - Purple
Daily - Pink
Orange - 4 Hour
Yellow - 1 Hour and below
EMA Moving Averages:
10 - Red
13 - Salmon
21- Yellow
34 - Lt Yellow
55 - Green
89 - Olive
100 - Blue
144 - Grey
200 - White
233 - Purple
377 - Pink
610 - Mustard
9) Have a great day and trade safely... More lower Timeframe analysis to come throughout the day. If you enjoyed this #Bitcoin Morning TA report, please follow, like and retweet!
Loading suggestions...