

Here's a $MATIC trade I took and the breakdown behind it
1. Identifying Points of Interest
2. Setting Alerts
3. Liquidity Purge
4. MSB
5. Imbalance Target
6. Pulling the Trigger
7. Results
8. Conclusion
These take a little while to make, so I hope it helps you!
1. Identifying Points of Interest
2. Setting Alerts
3. Liquidity Purge
4. MSB
5. Imbalance Target
6. Pulling the Trigger
7. Results
8. Conclusion
These take a little while to make, so I hope it helps you!

1. Identifying Points of Interest
I mark up my chart, focusing on orderblocks that have NOT yet been traded through / exhausted
I'm focusing here on 1H and 15M OB's / supply & demand zones
Remember: They're the last orderblocks before an impulse move down that causes imbalance
I mark up my chart, focusing on orderblocks that have NOT yet been traded through / exhausted
I'm focusing here on 1H and 15M OB's / supply & demand zones
Remember: They're the last orderblocks before an impulse move down that causes imbalance


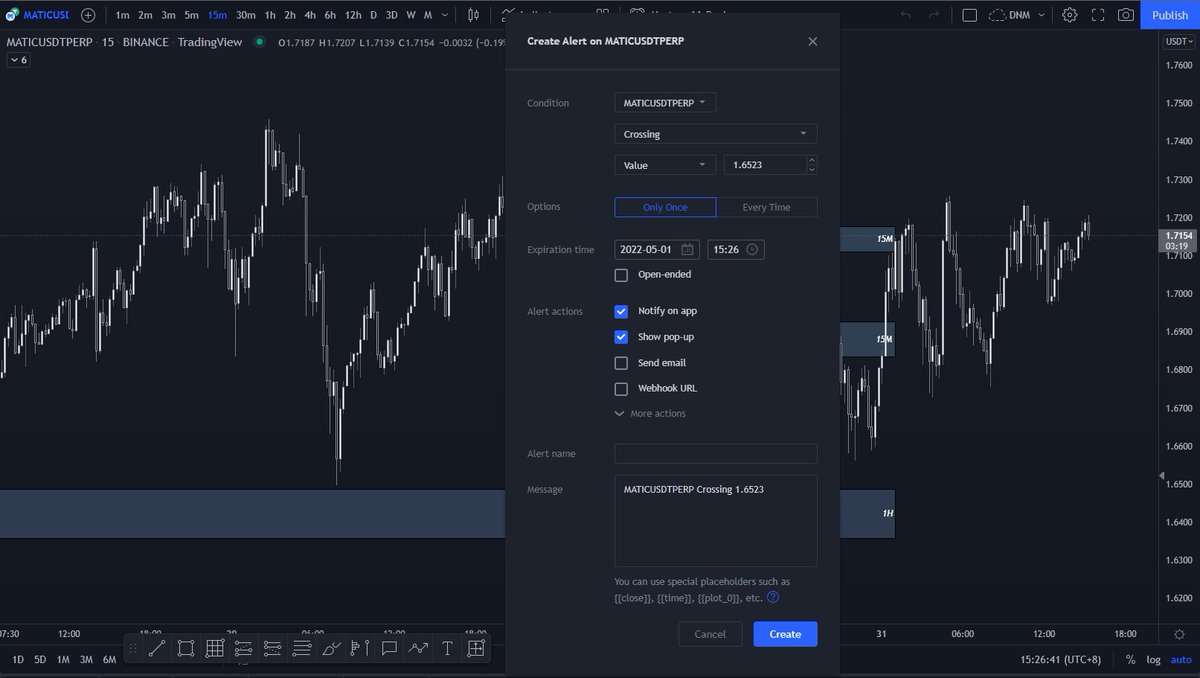
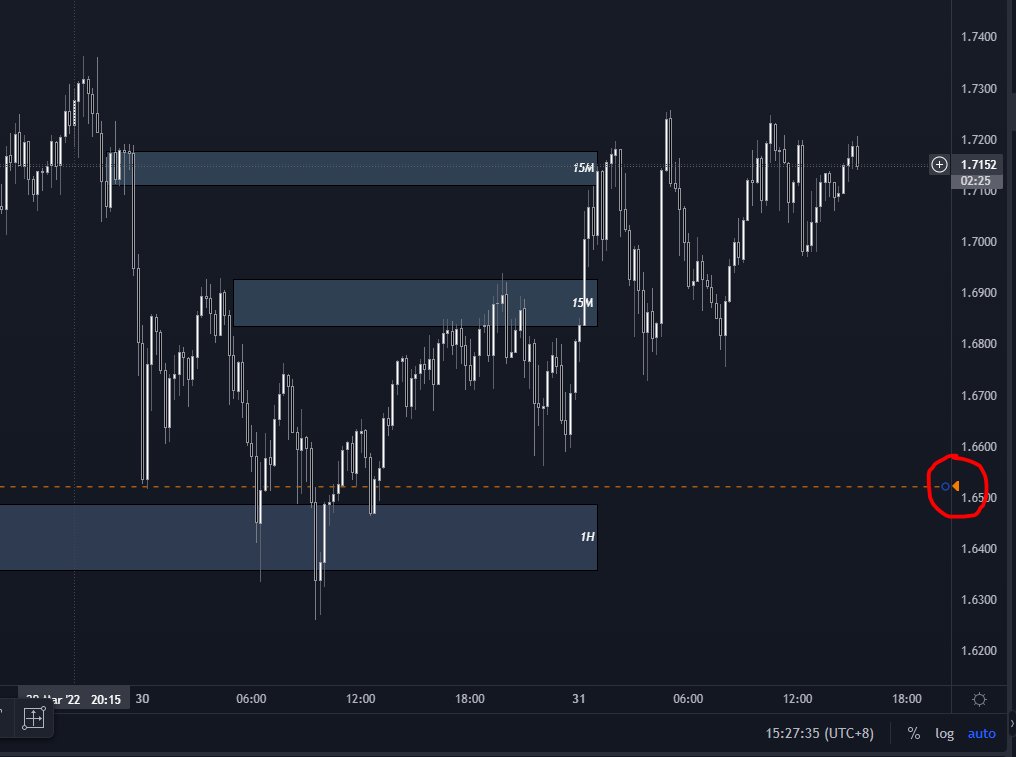
2. Setting Alerts
Set some alerts around the area that you're interested in and then make call based on PA from there
How?
Right click the screen and enter your desired level in.
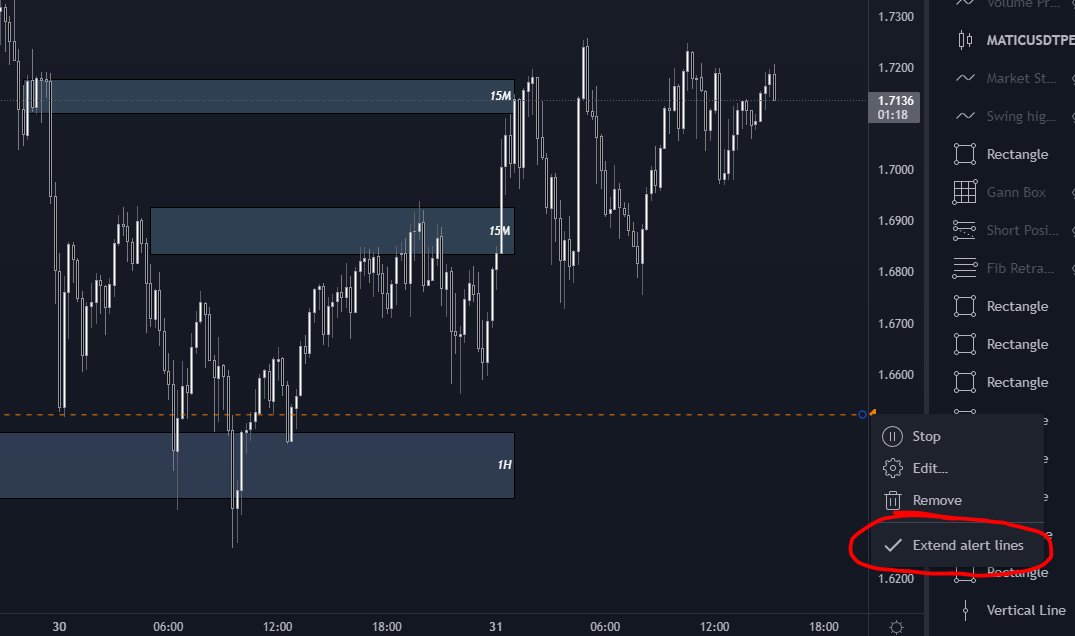
I don't like the extended alert lines, so I hide them (see 3rd pic to hide them)
Set some alerts around the area that you're interested in and then make call based on PA from there
How?
Right click the screen and enter your desired level in.
I don't like the extended alert lines, so I hide them (see 3rd pic to hide them)
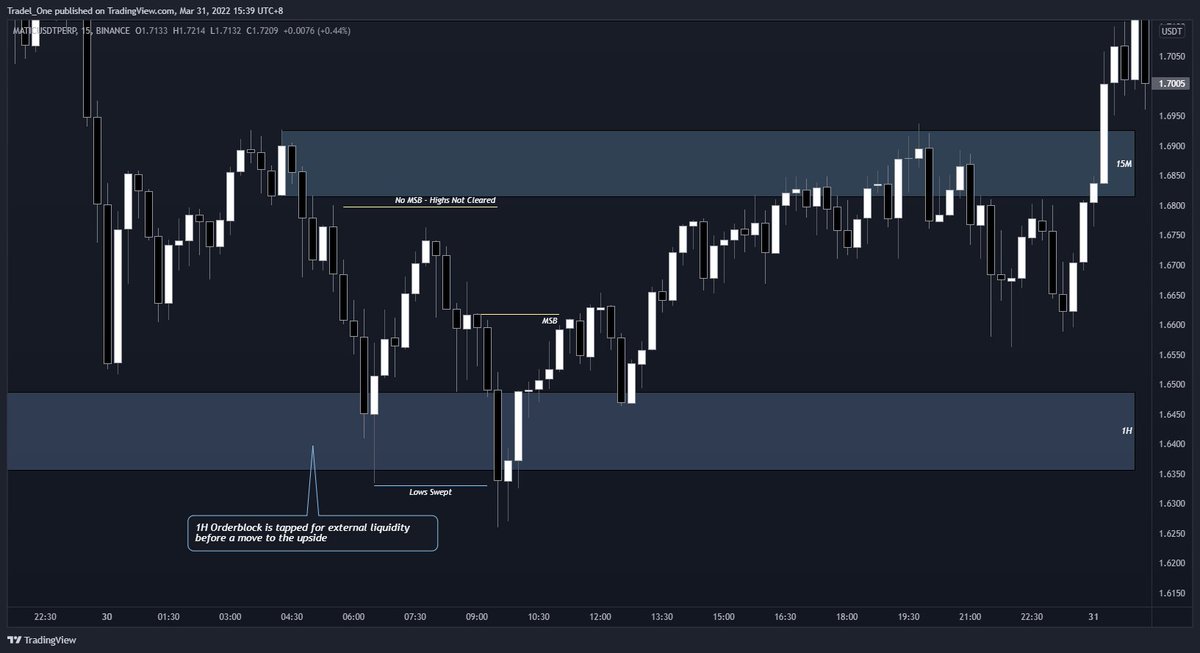
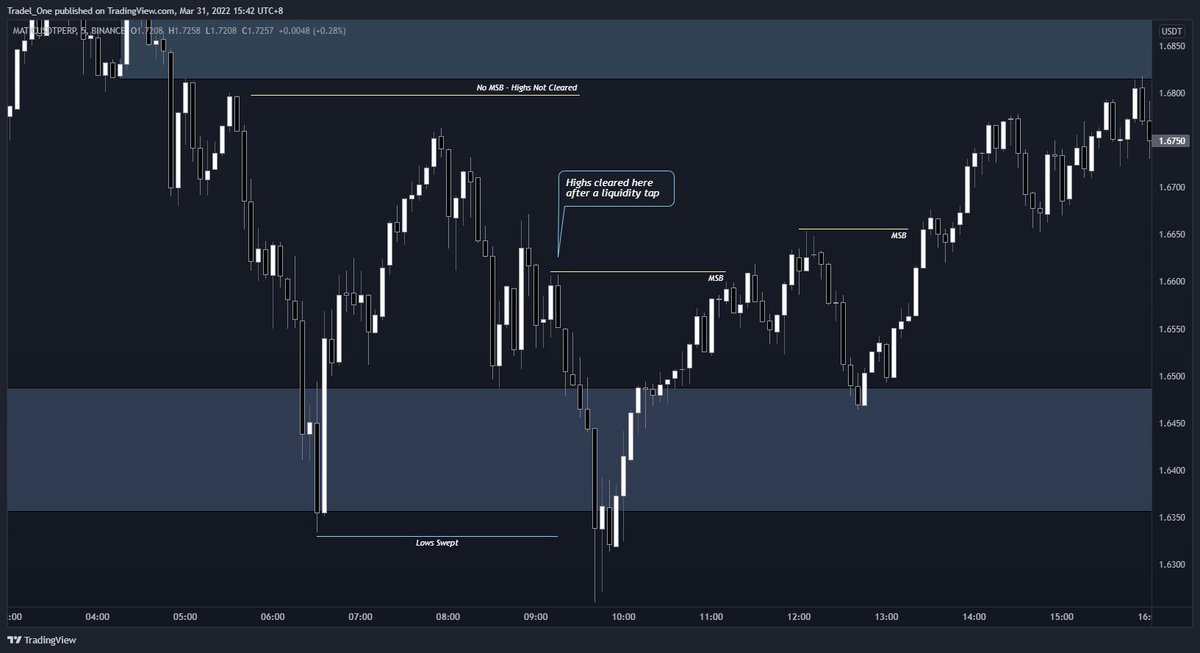
3. Liquidity Purge
So once you've identified your Points of Interest (OB / Supply Demand), you then want to wait for price to trade to these levels
I like to see price trade down, through, and then bounce before seeing an Market Structure Break (MSB) for a retest entry
So once you've identified your Points of Interest (OB / Supply Demand), you then want to wait for price to trade to these levels
I like to see price trade down, through, and then bounce before seeing an Market Structure Break (MSB) for a retest entry
3a.
It's worth noting that I didn't get this long trade up to my next area of interest, but nevertheless, this is all about building you up to have an understanding
It's worth noting that I didn't get this long trade up to my next area of interest, but nevertheless, this is all about building you up to have an understanding
4. MSB's
An MSB, for me, is where price trades up and through a singular, or series of previous highs.
Here's an example.
I'm looking for this break in structure after a liquidity event if I'm either short or long in a trade
(we'll get to the trade set up in a sec)
An MSB, for me, is where price trades up and through a singular, or series of previous highs.
Here's an example.
I'm looking for this break in structure after a liquidity event if I'm either short or long in a trade
(we'll get to the trade set up in a sec)
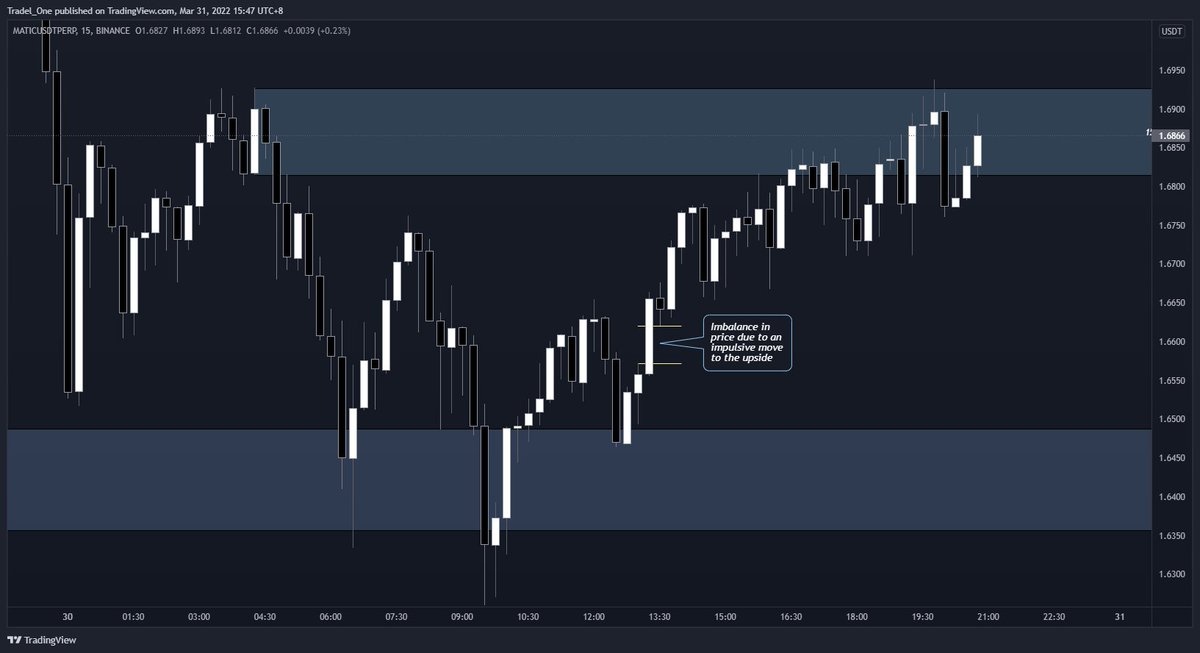
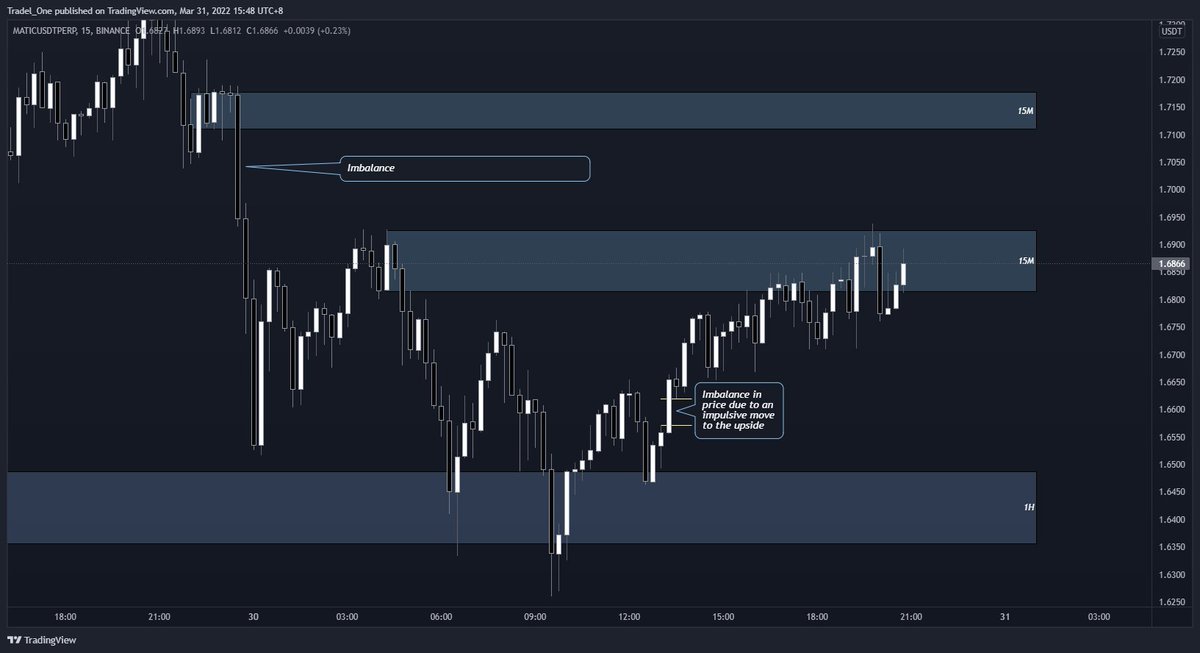
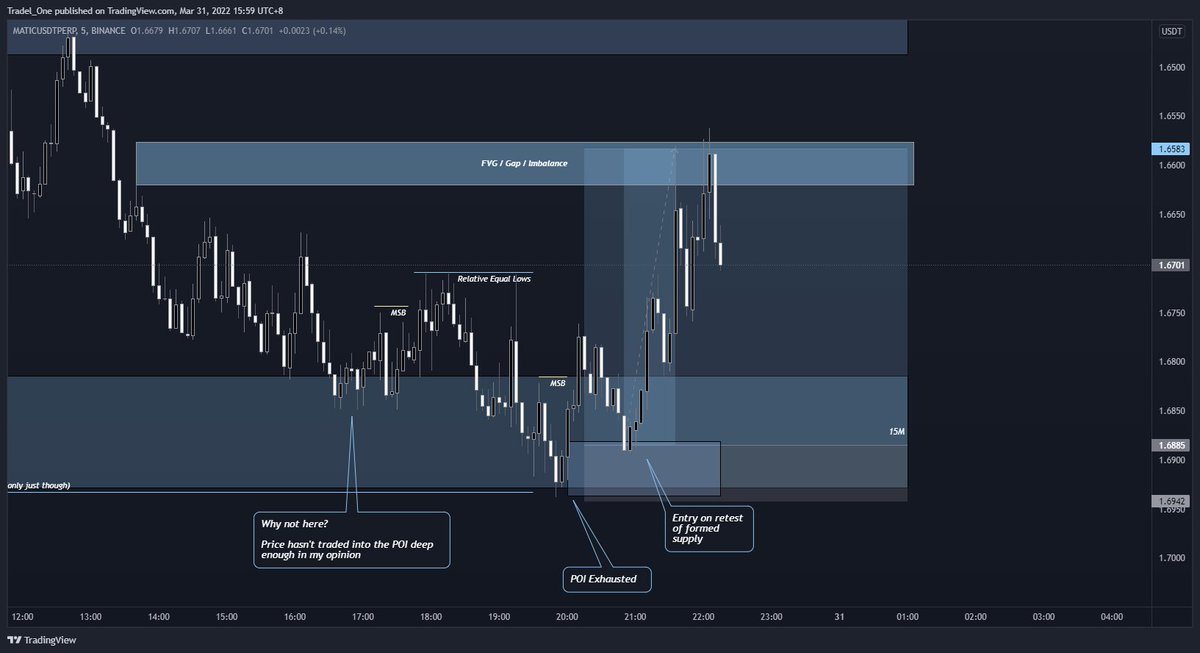
5. Imbalance Target
We talked about imbalance already to the down side, well, for this trade I was targeting imbalance brought about by the move to the upside
Shown below
We talked about imbalance already to the down side, well, for this trade I was targeting imbalance brought about by the move to the upside
Shown below
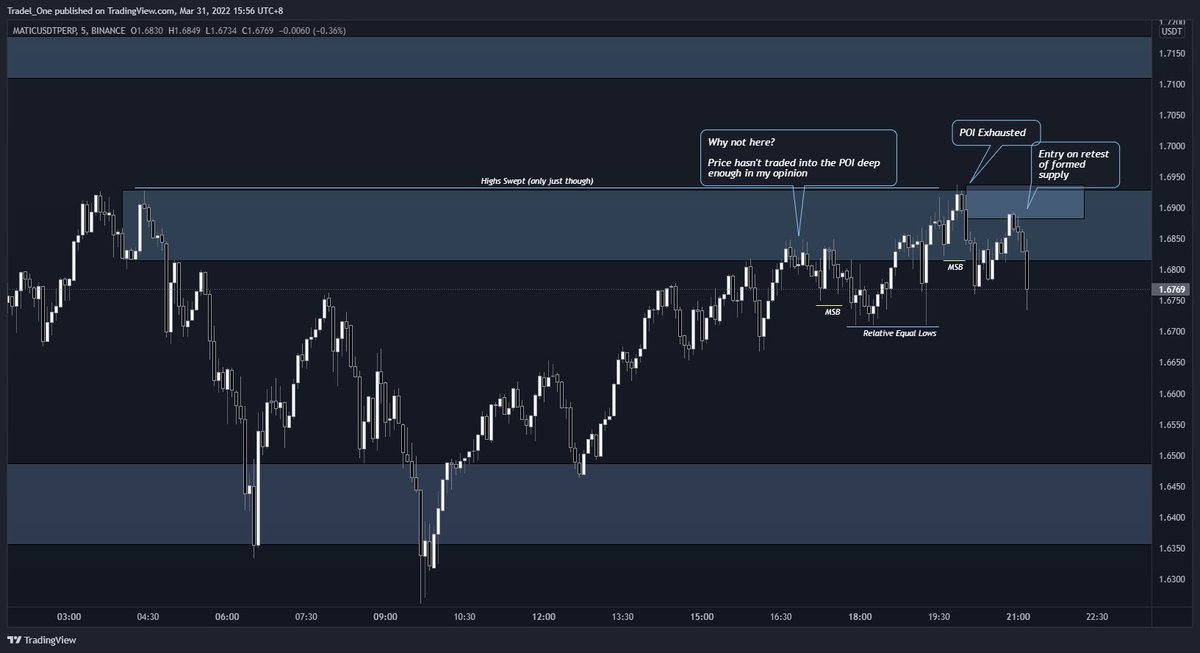
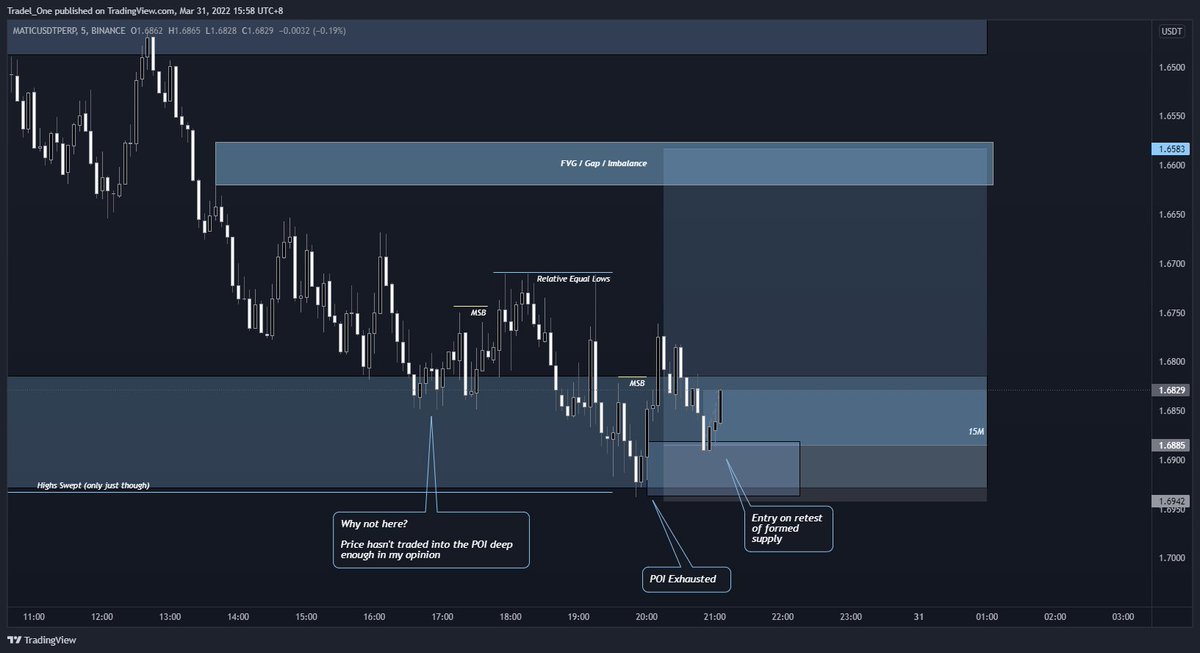
6. Pulling the Trigger
So my POI after this run to the highs was the next 15M Supply zone.
Why did I enter and not chase the imbalance to the upside though?
Simple. I saw that the 15M POI was exhausted, and that we'd likely balance price before heading back up there
So my POI after this run to the highs was the next 15M Supply zone.
Why did I enter and not chase the imbalance to the upside though?
Simple. I saw that the 15M POI was exhausted, and that we'd likely balance price before heading back up there
6a. Pulling the Trigger
How did I know it was exhausted?
The same thing at the lows occurs at the highs
1. Liquidity tap
2. MSB
3. Entry
4. Target
How did I know it was exhausted?
The same thing at the lows occurs at the highs
1. Liquidity tap
2. MSB
3. Entry
4. Target
6b. Pulling the Trigger
If it doesn't make sense to you yet, let's invert the chart
I find this easier to enter trades on as I find I have a better bias when looking for a long setup
If it doesn't make sense to you yet, let's invert the chart
I find this easier to enter trades on as I find I have a better bias when looking for a long setup
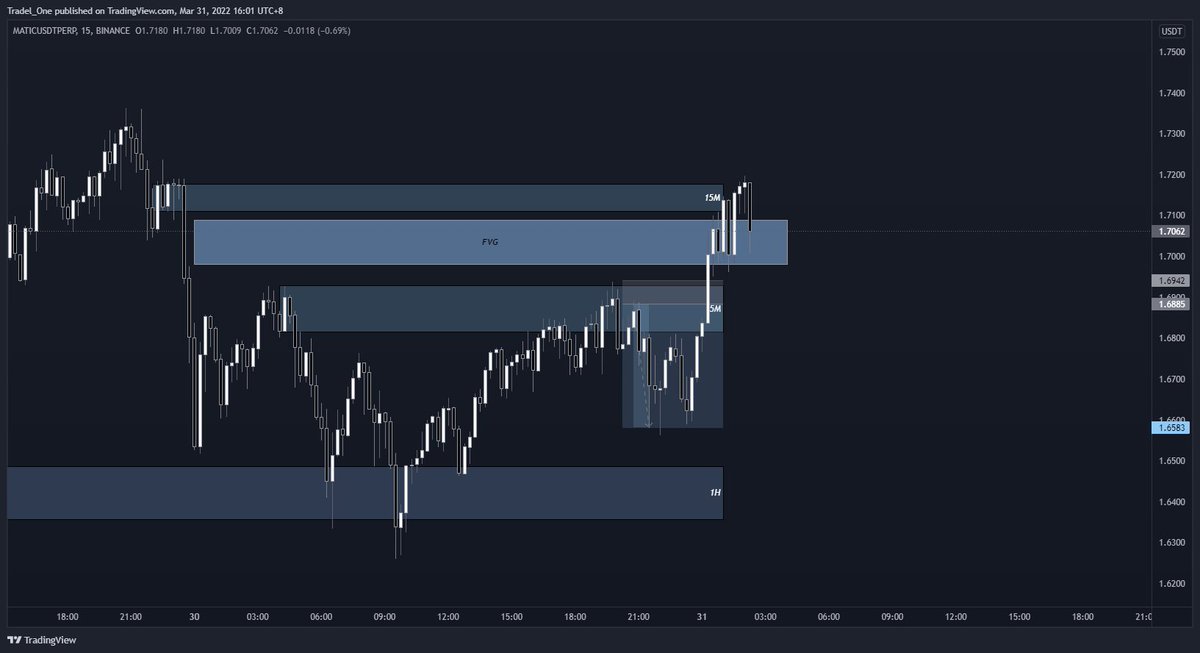
7. Results
8. Conclusion
Notice how the imbalance that was shown previously is now run, as well as the 15M OB?
Did I trade this? No.
Why? Settle down mate, it was 3am my time! haha
But just goes to show how a structured method can yield results based on an "If, then" approach
Notice how the imbalance that was shown previously is now run, as well as the 15M OB?
Did I trade this? No.
Why? Settle down mate, it was 3am my time! haha
But just goes to show how a structured method can yield results based on an "If, then" approach
If you're keen to learn more, come and join us, ask questions, whatever, over in Telegram, Discord, and on YT. They're all free
Chat soon guys
TG
t.me
Discord
discord.gg
YT
youtube.com
Chat soon guys
TG
t.me
Discord
discord.gg
YT
youtube.com

youtube.com/c/MindJacked
MindJacked
Check out all the free crypto trading content that Mindset BTC & Johnnie Jacks share as both themsel...
discord.gg/yFdcmbd8yt
Discord - A New Way to Chat with Friends & Communities
Discord is the easiest way to communicate over voice, video, and text. Chat, hang out, and stay clos...
t.me/Mindset_BTC
MindJacked
Free Educational Trading Content from Mindset & Johnnie Jacks Discord - discord.gg/yFdcmbd8yt Youtub...
Loading suggestions...