

1/15: Ever looked at an order book and been mesmerised by how it moves? Just me? A short thread about how displaying order books in a different way gives you a glance at what lies beneath.

2/15: First of all, you need to know what an order book is. I'm guessing you do, but if you don't, check out the introductory article which covers it: machow.ski

3/15: Order books are the ultimate arbiter of what happens (publicly) in the market, every quote and trade must go through one to have any impact. When viewed at a high level, they look like chaos!
4/15: Though they look chaotic, they are really just a superposition of hundreds or thousands of different trader's orders layered one on top of the other:

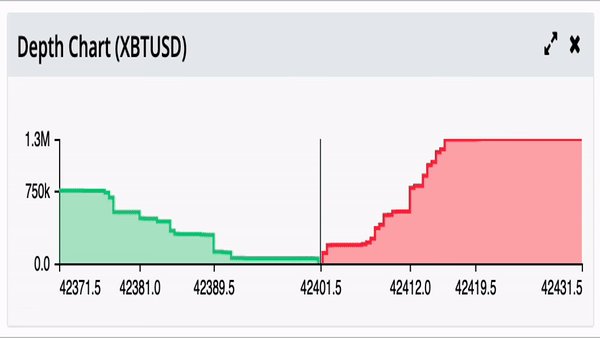
5/15: Most people are used to seeing regular order book diagrams or maybe depth charts, but these visualisations miss an important dimension: time!
6/15: 2D order book diagrams are a way of seeing what happened to liquidity at different price levels. Imagine that every column of pixels is a price level, and the colour intensity is how much liquidity is at that level. Right to left is time!
8/15: 2D is great, but WebGL lets us scale this concept into 3D. I've spent my weekend building an example crypto 3D order book. Behold, the valley of liquidity! You can check it out at 3dorderbook.com.
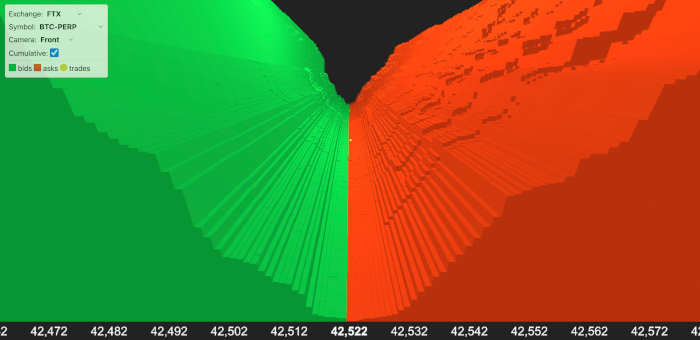
9/15: It's not great for trading, but it does let you spot some interesting patterns. Keep an eye out for some of these, and others that can show up.
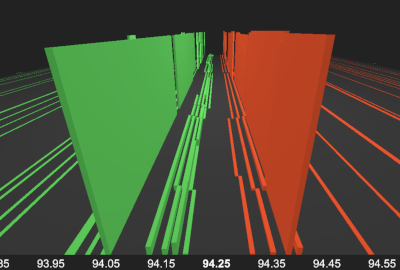
10/15: Market makers will often place "ladders" of orders on both the bid and ask sides. Check out two market makers with different strategies quoting on @mangomarkets.

11/15: Buy and sell walls are crypto conspiracy that whales place extremely large limit orders on one side to manipulate the price into moving in a certain direction. These can be tricky to definitively identify due to the anonymity of the L2 order book. Check out this candidate:

12/15: Different symbols have different distributions of liquidity. Some are tight (close to the mid) some are wide (far from the mid), and some appear to have tight spreads but actually the majority of the liquidity is wide. Watch out with those market orders!
13/15: If you want to know more, check out the blog post. It covers these topics in more depth: machow.ski.
14/15: Finally, if you do see something interesting, take a screenshot/video and post it here or DM me!
15/15: I write about technical topics in crypto. Check out my blog for more articles, and follow me on twitter for updates! machow.ski
Loading suggestions...