

May Month Marathon Chart Thread 🧵
A to Z F&O Charts 🧵
A to Z F&O Charts 🧵
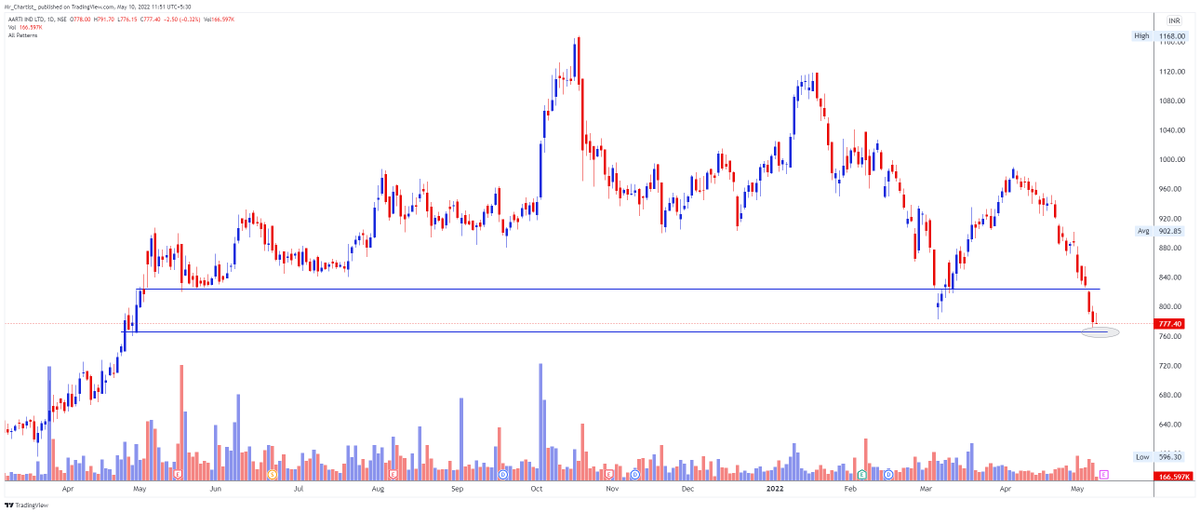
1. AARTIIND 777
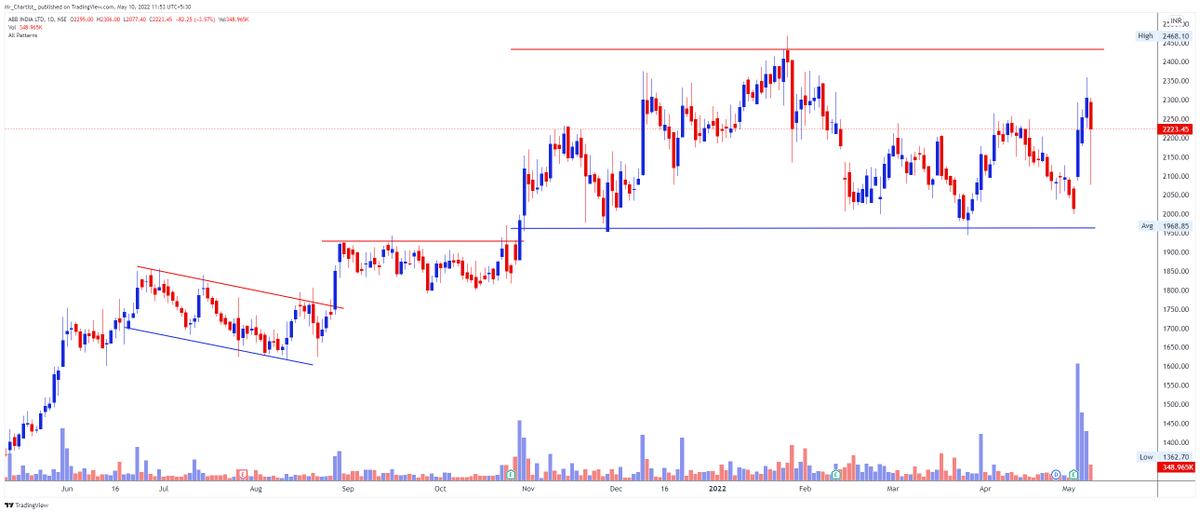
2. ABB 2221
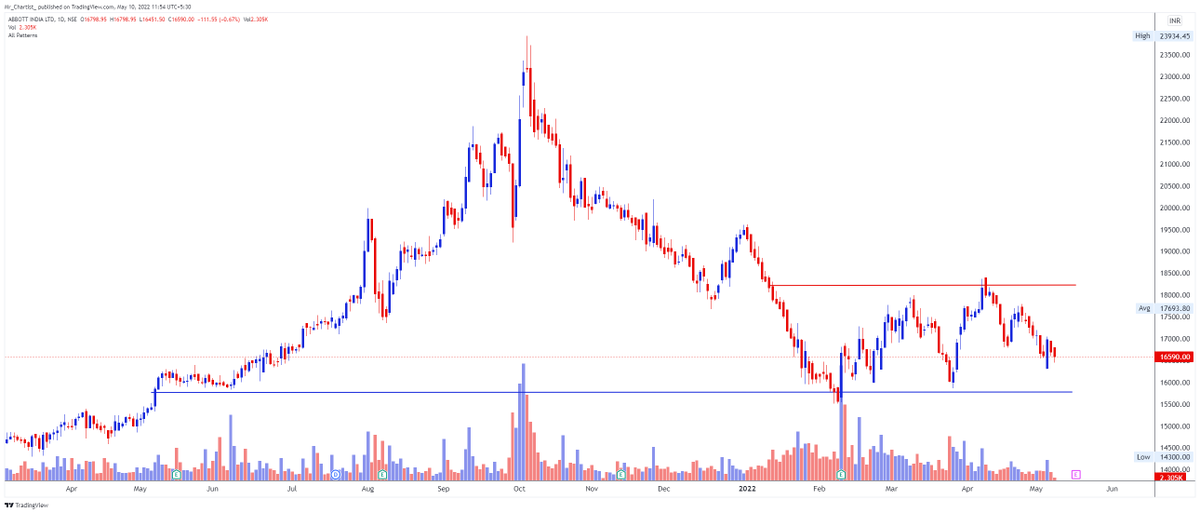
3. ABBOTINDIA 16594
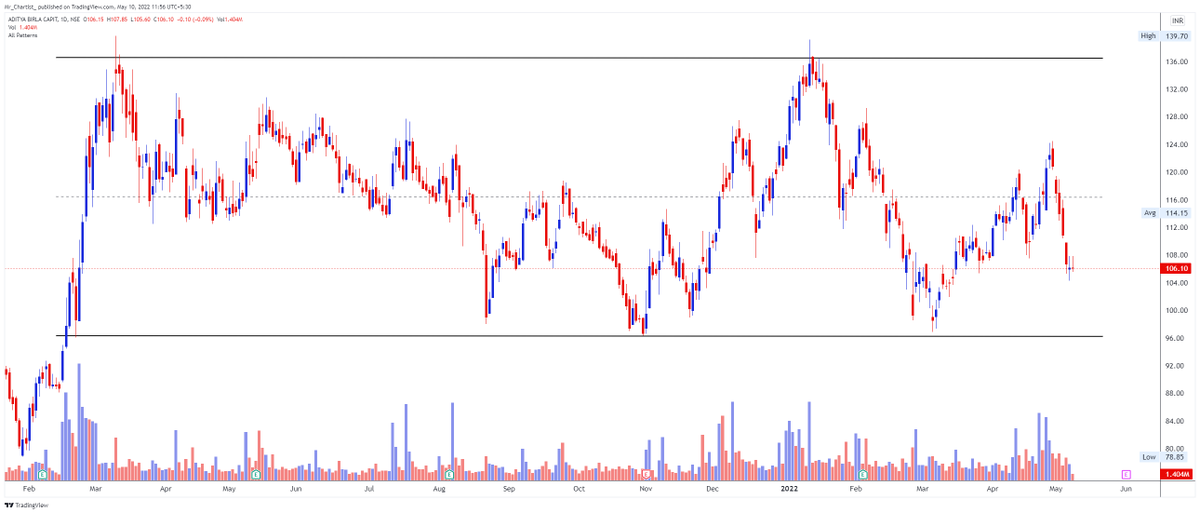
4. ABCAPITAL 106
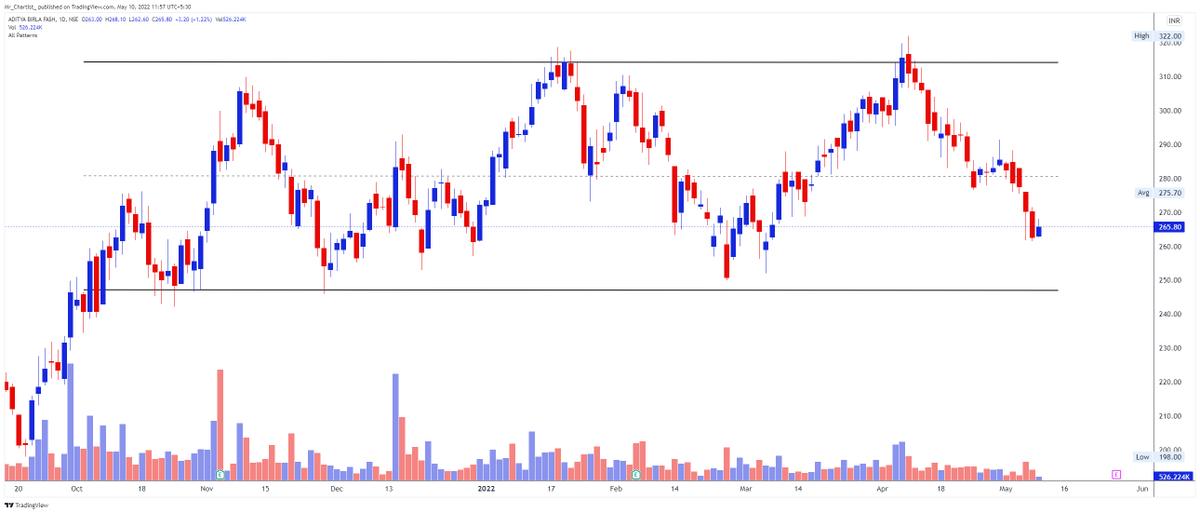
5. ABFRL 265.80
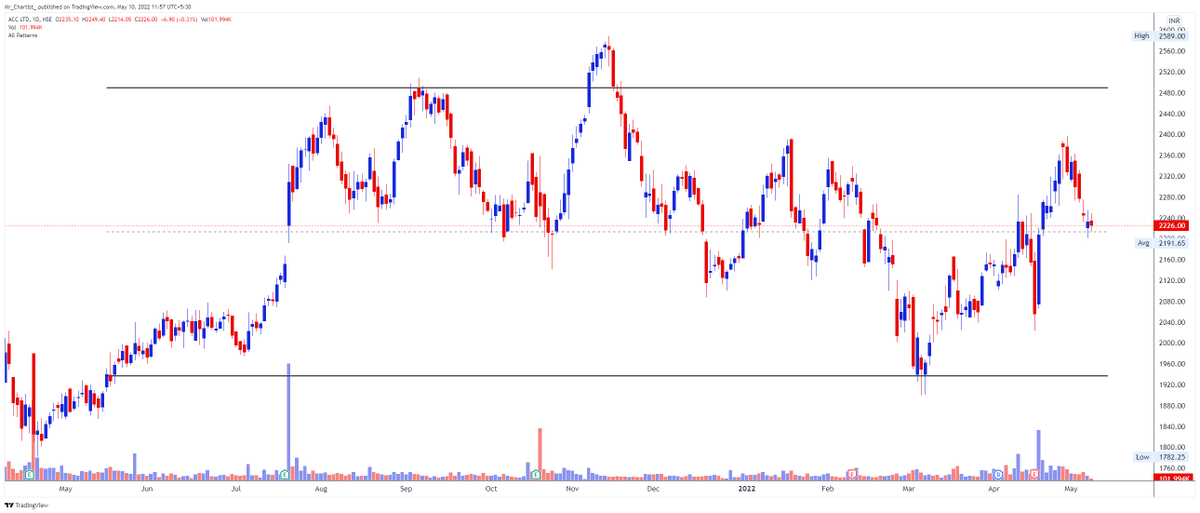
6. ACC 2225
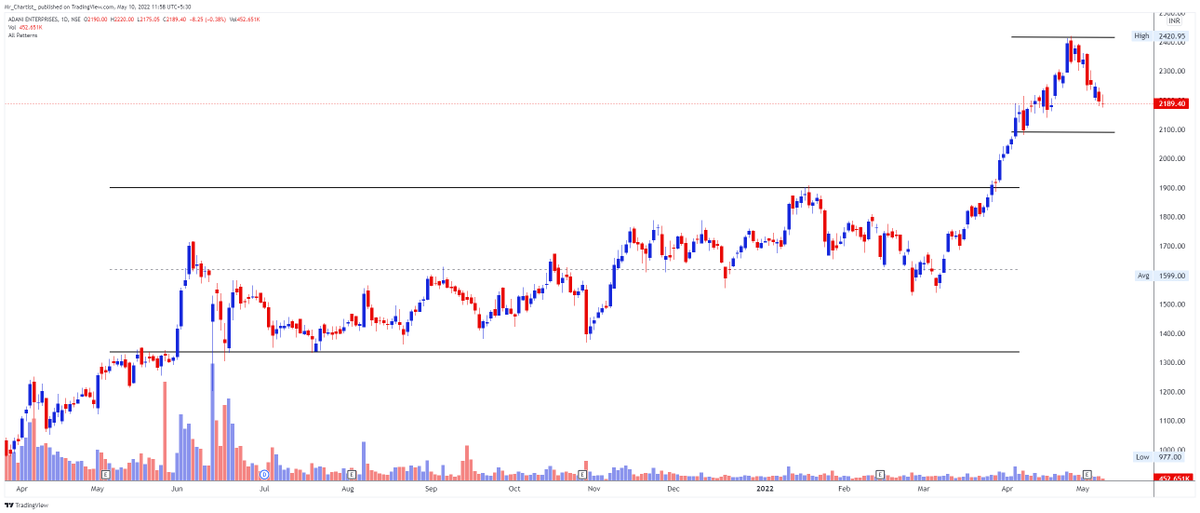
7. ADANIENT 2189
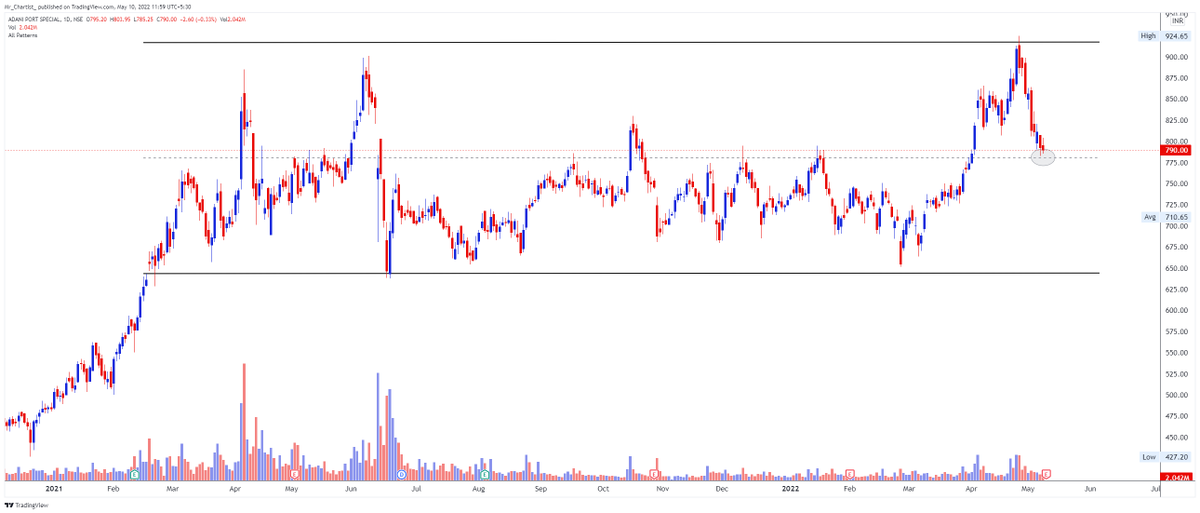
8. ADANIPORT 790
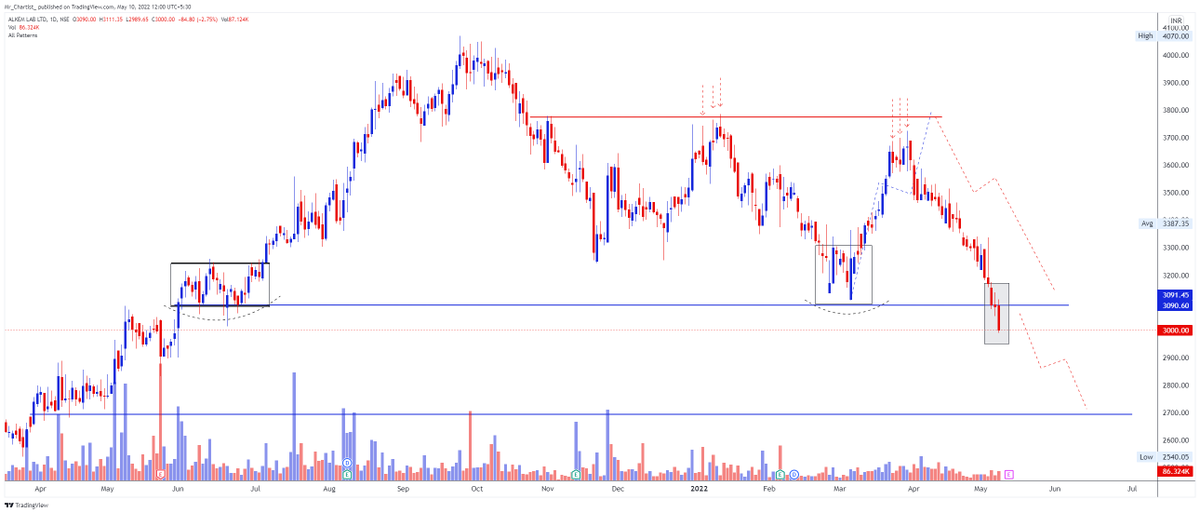
9. ALKEM 3000
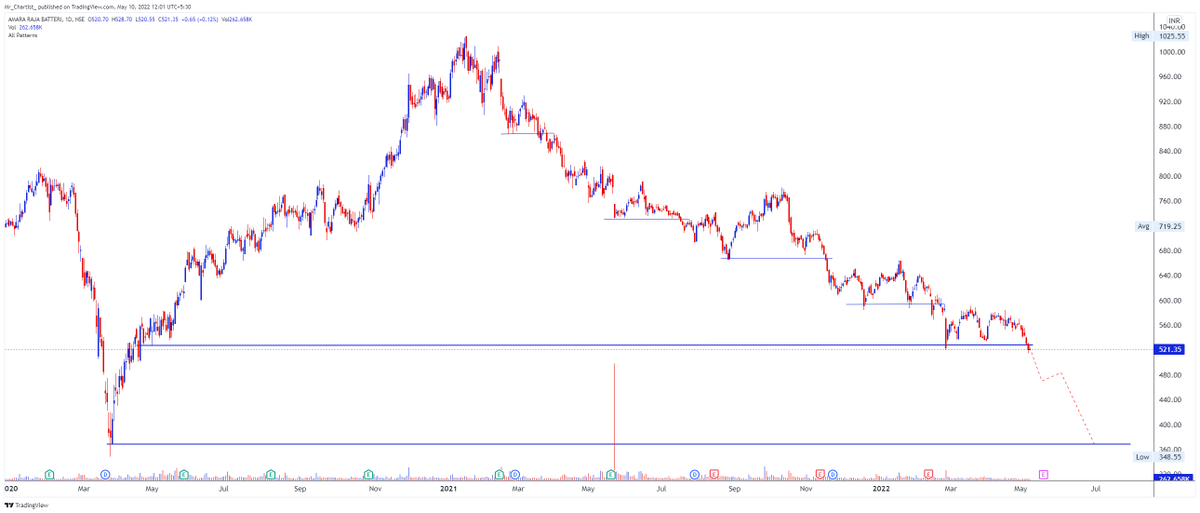
10. NSE:AMARAJABAT 521.55
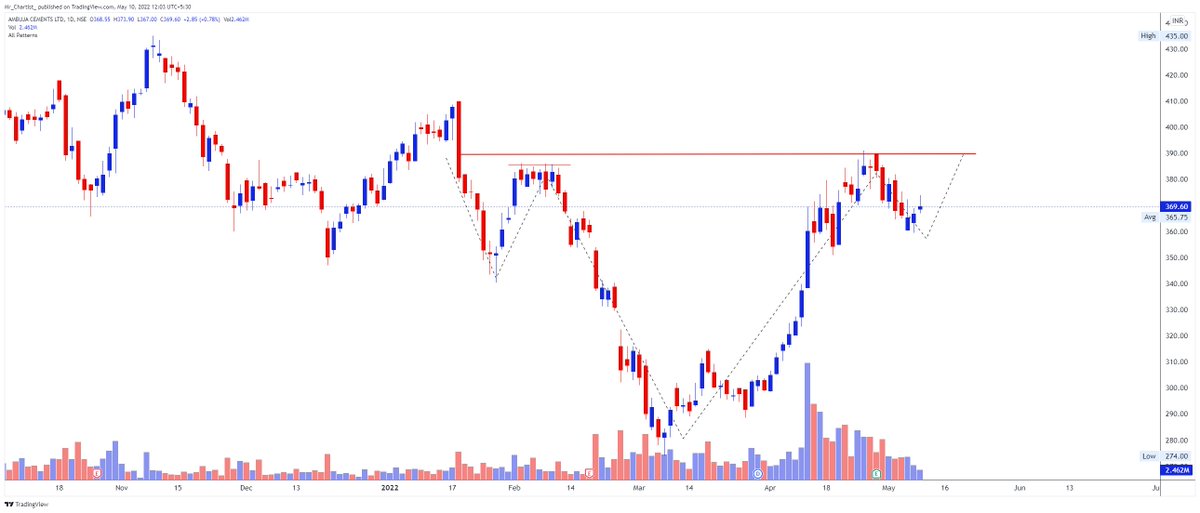
11. NSE:AMBUJACEM 369.60
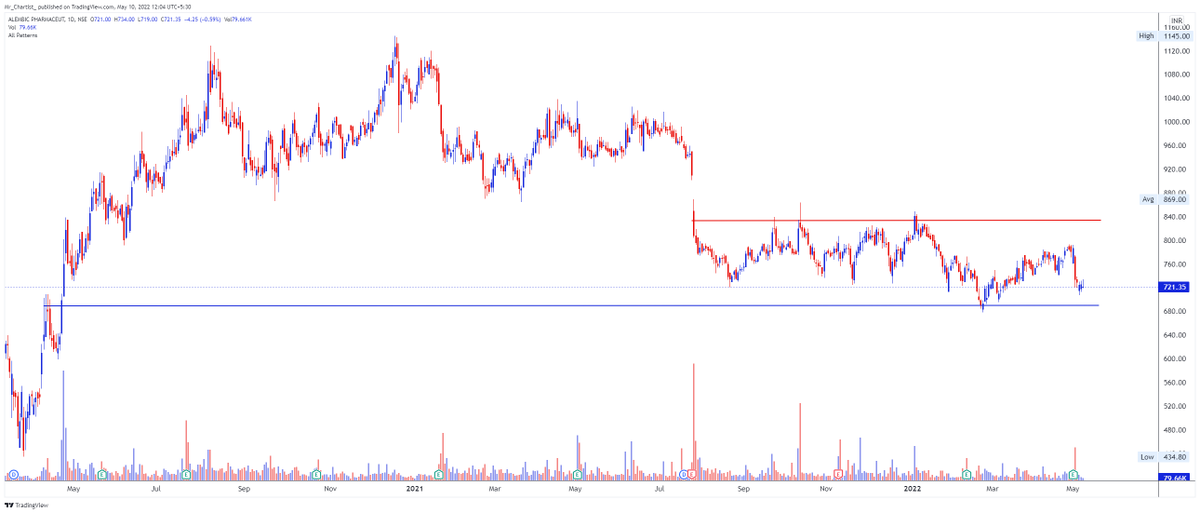
12. APLLTD 721
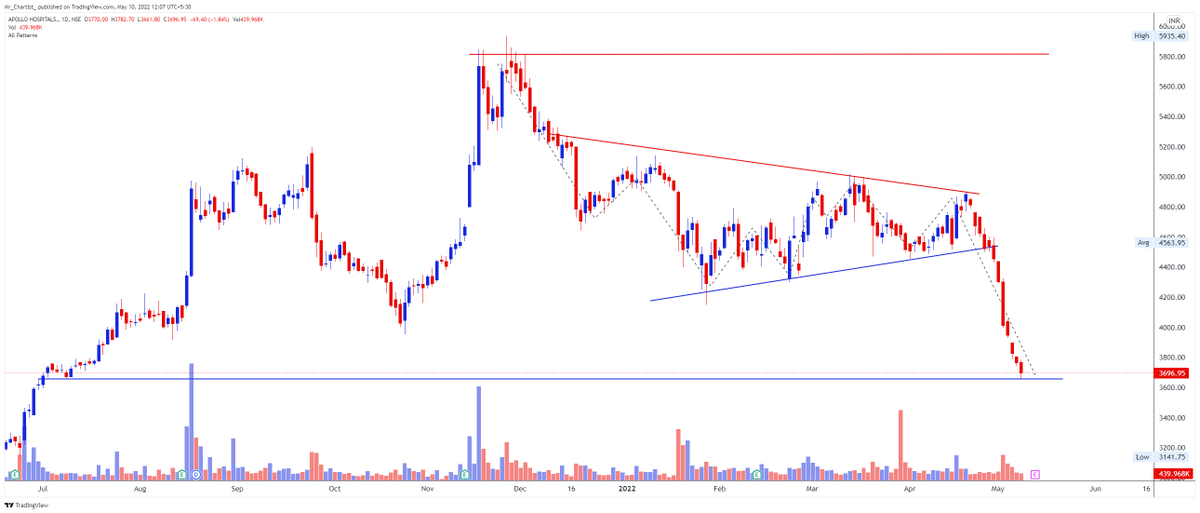
13. NSE:APOLLOHOSP 3698
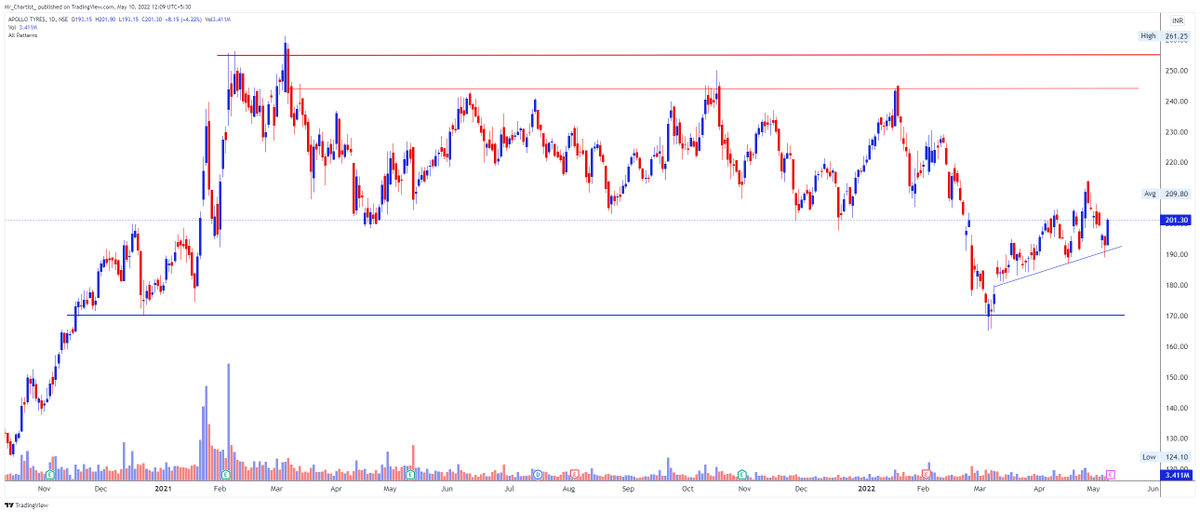
14. APOLLOTYRE 201.25
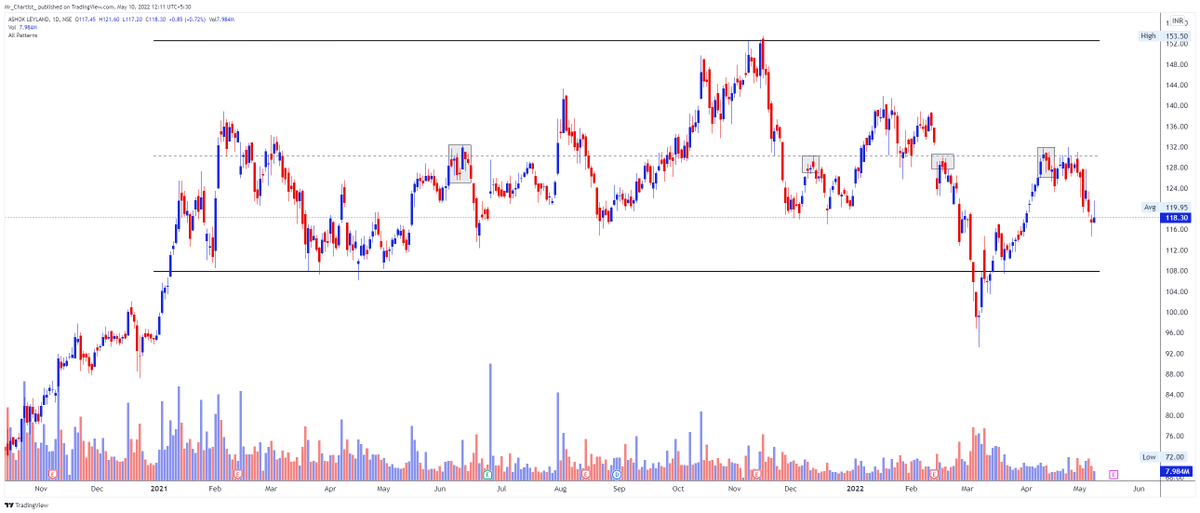
15. ASHOKLEY 118
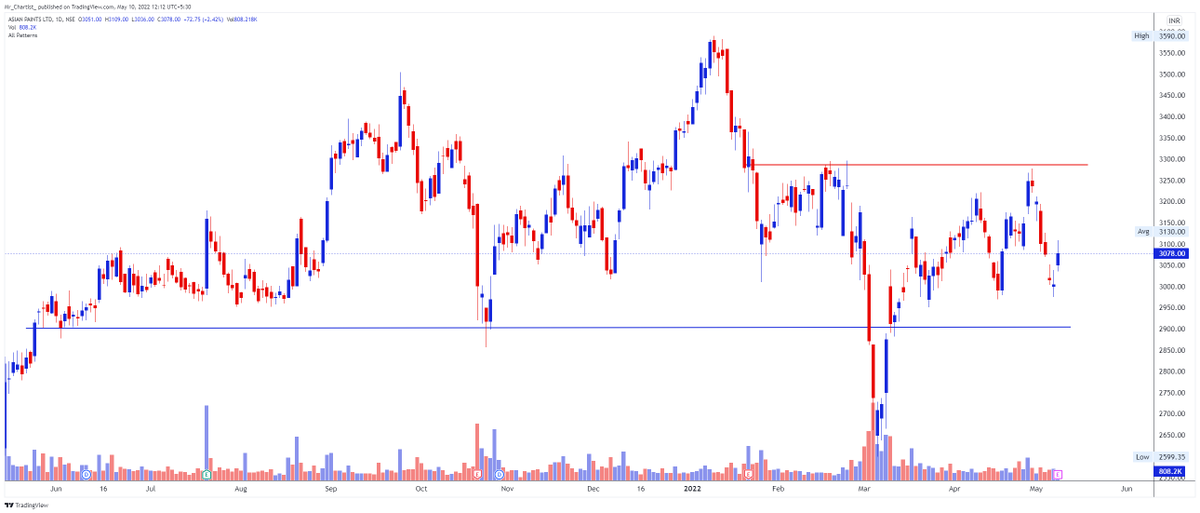
16. ASIANPAINT 3078
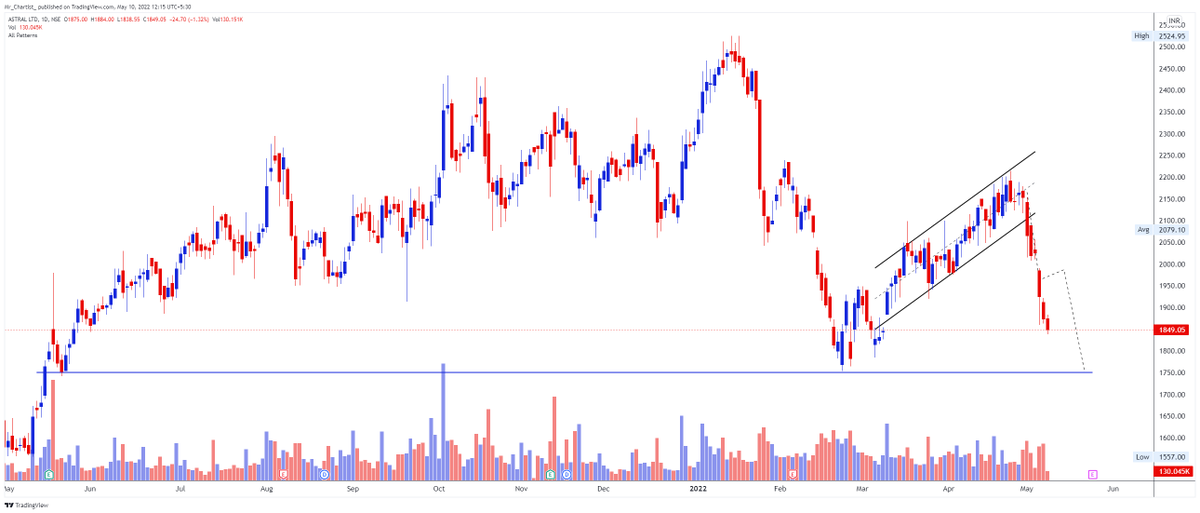
17. ASTRAL 1849
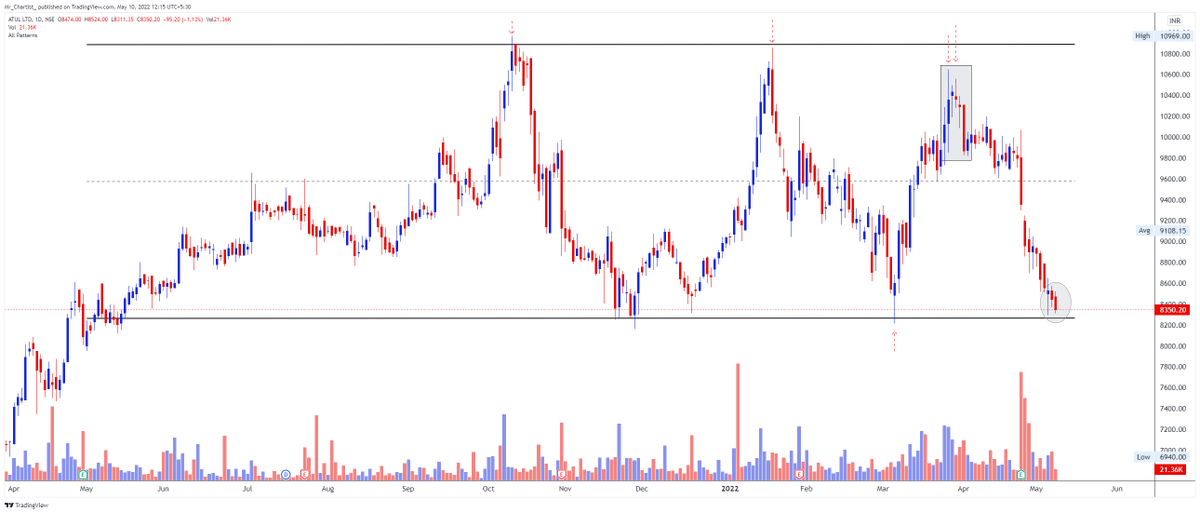
18. ATUL 8350
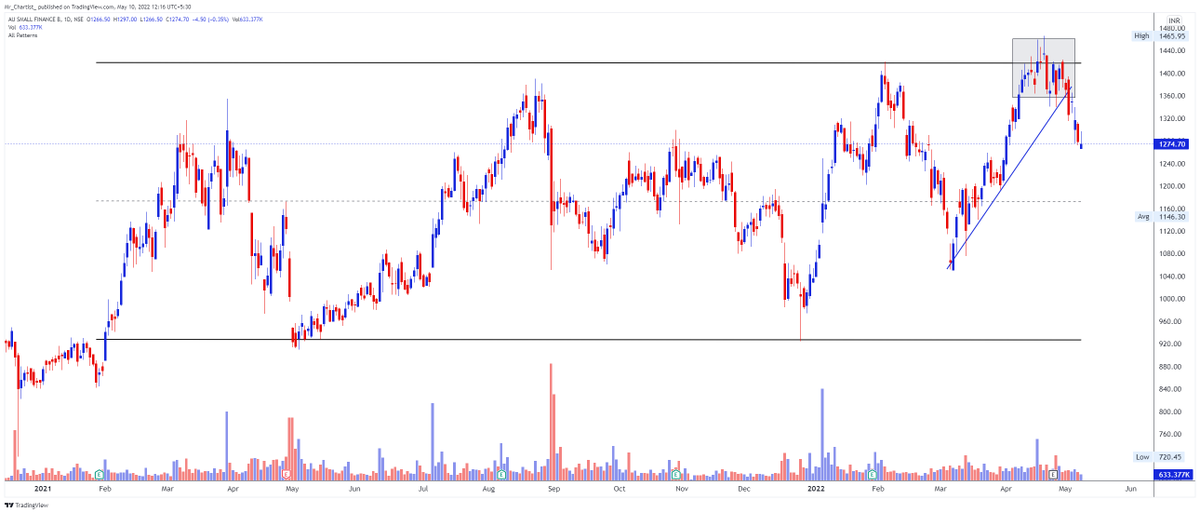
19. AUBANK 1274
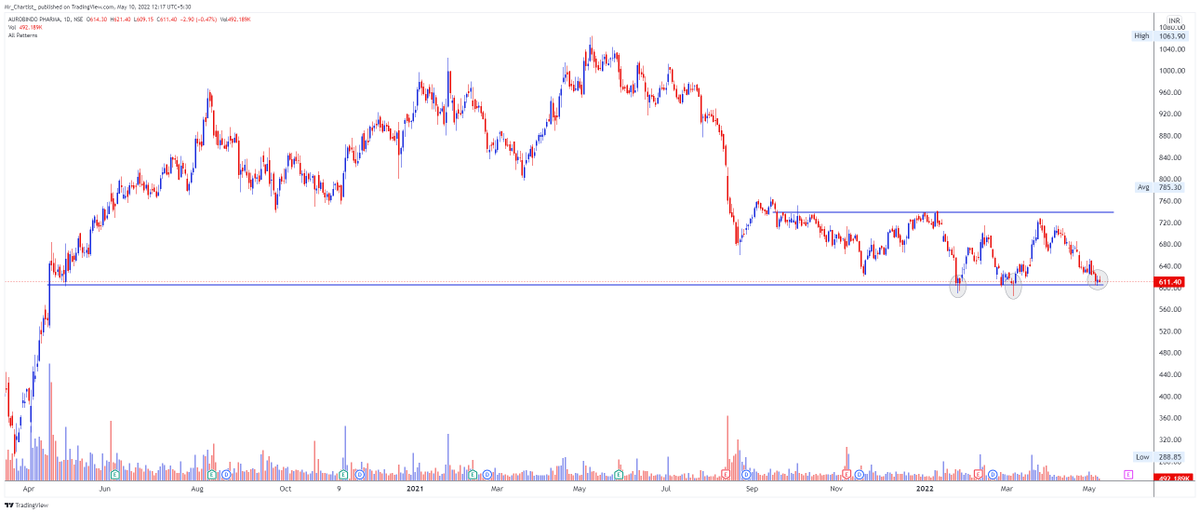
20. AUROPHARMA 611.40
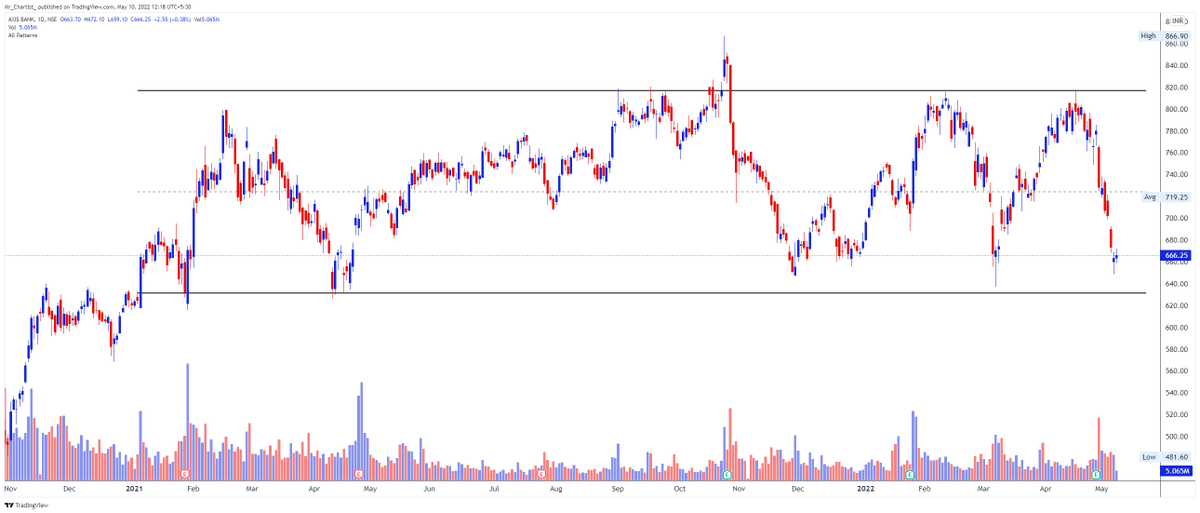
21. AXISBANK 666.1
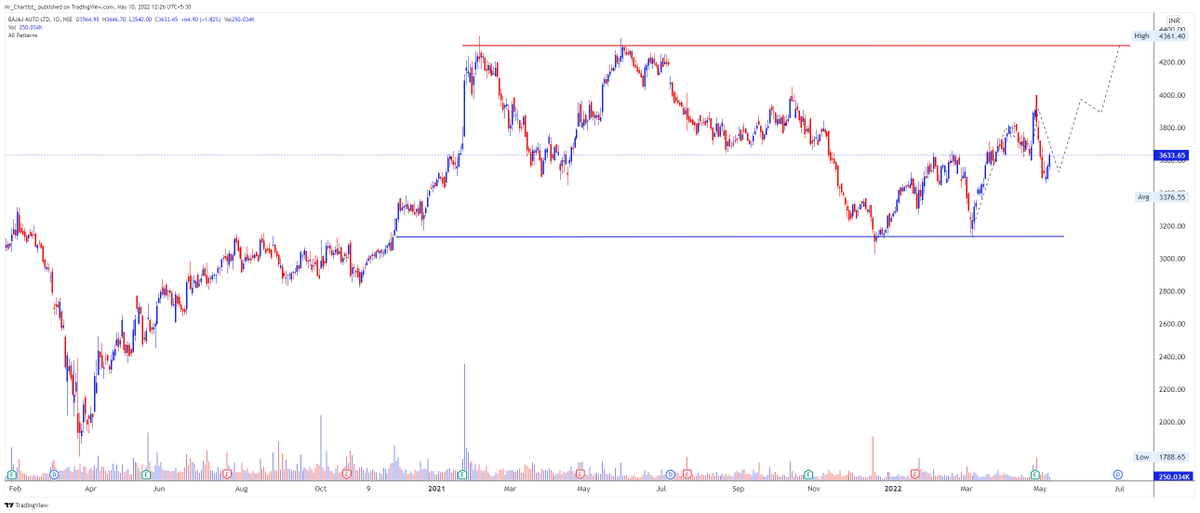
22. BAJAJAUTO
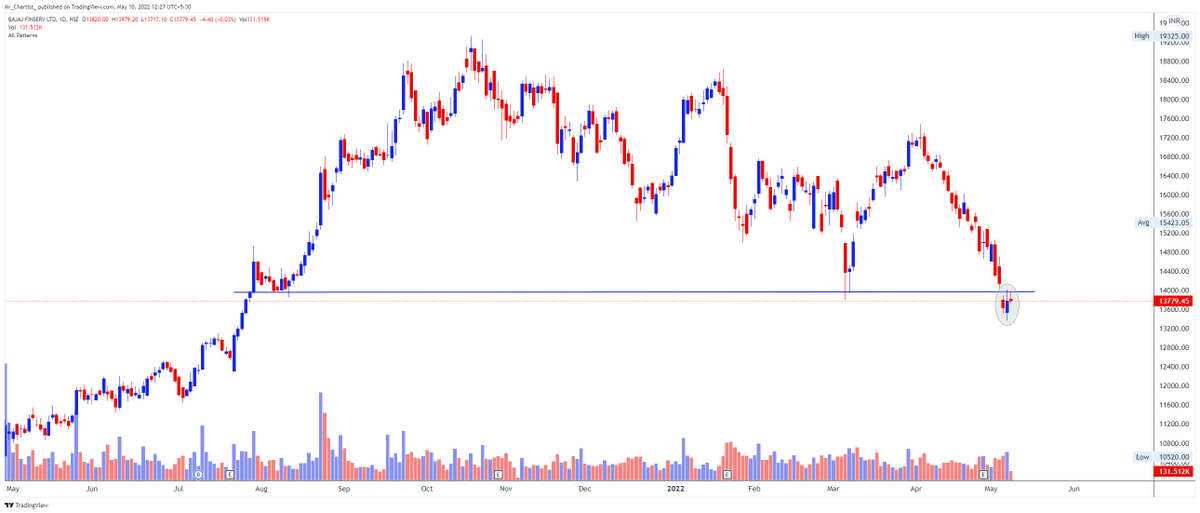
23. BAJAJFINSV
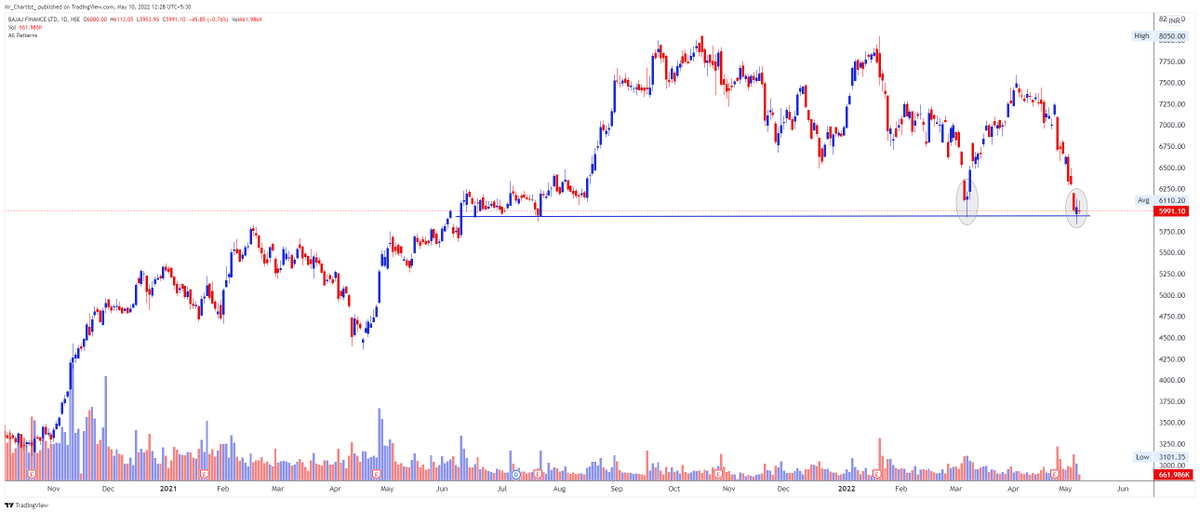
24. BAJFINANCE
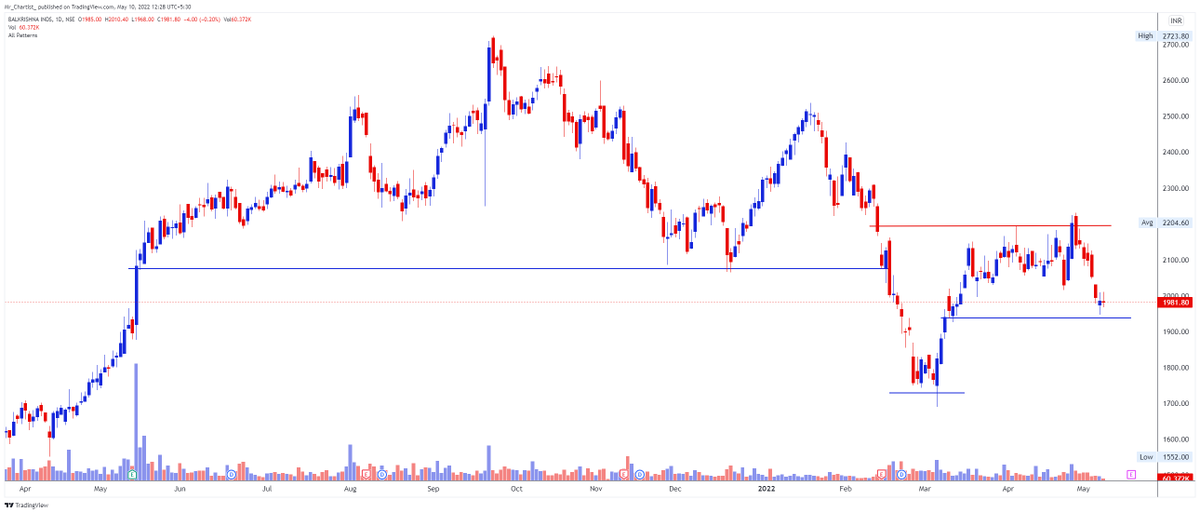
25. BALKRISIND
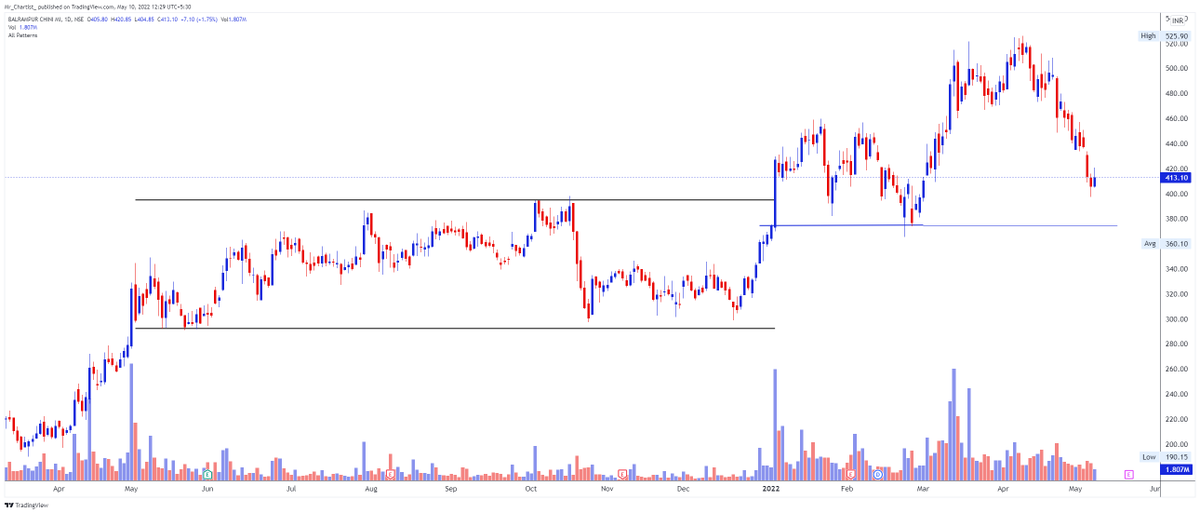
24. BALRAMCHIN
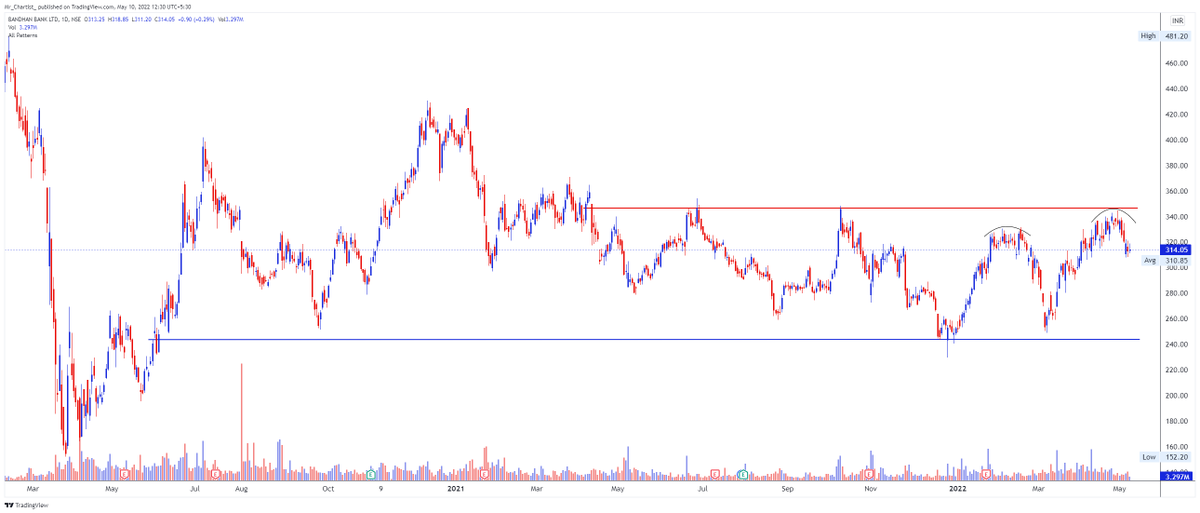
25. BANDHANBNK
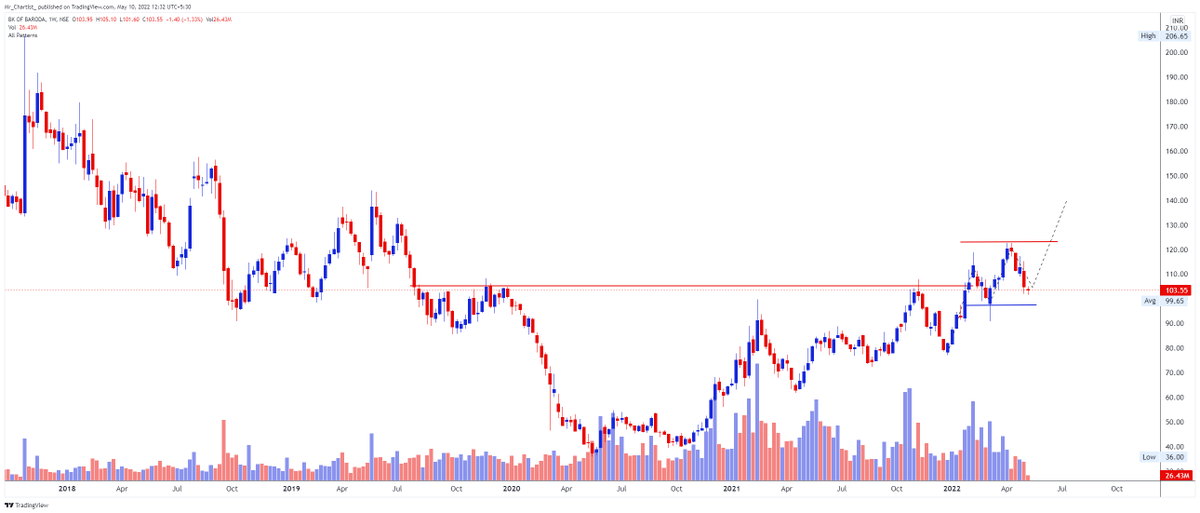
26. BANKBARODA
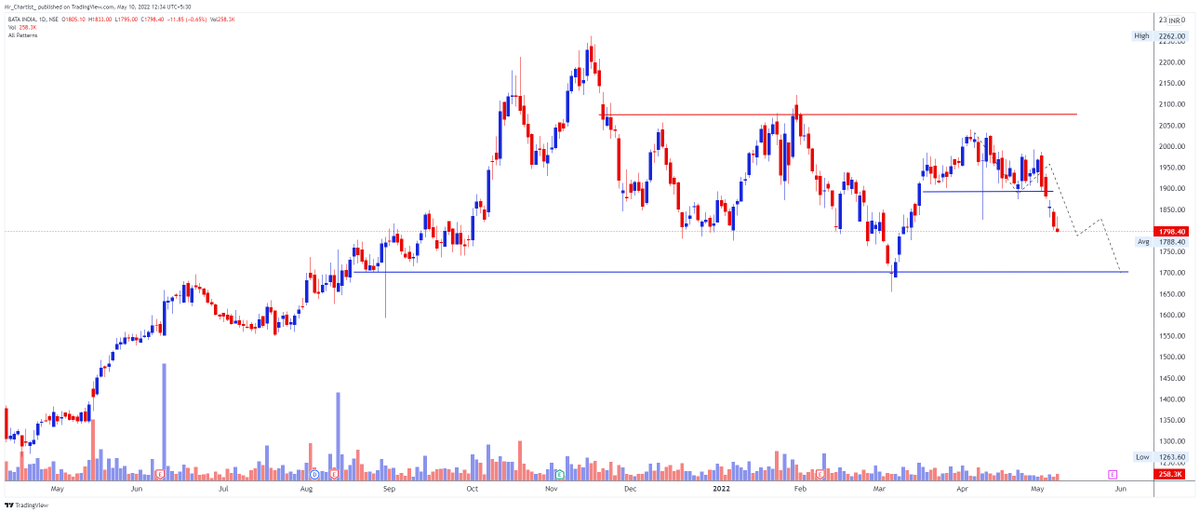
27. BATAINDIA
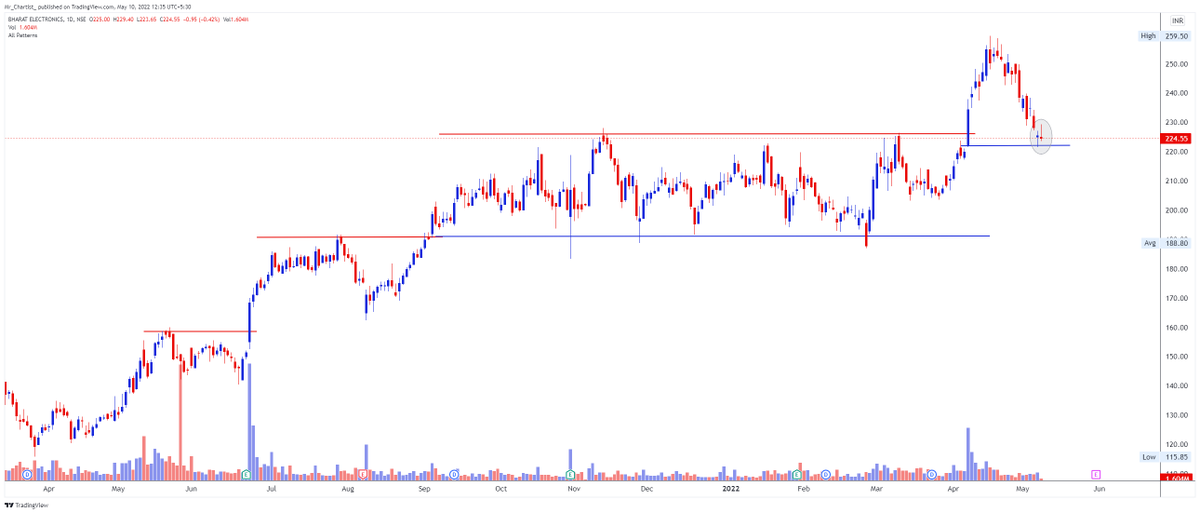
28. BEL
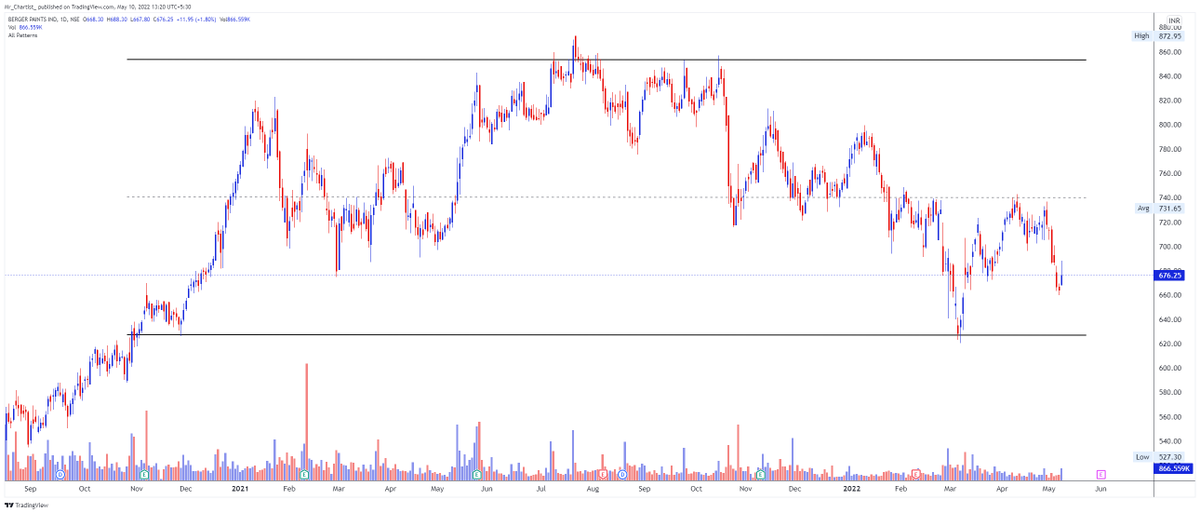
29. BERGEPAINT 676
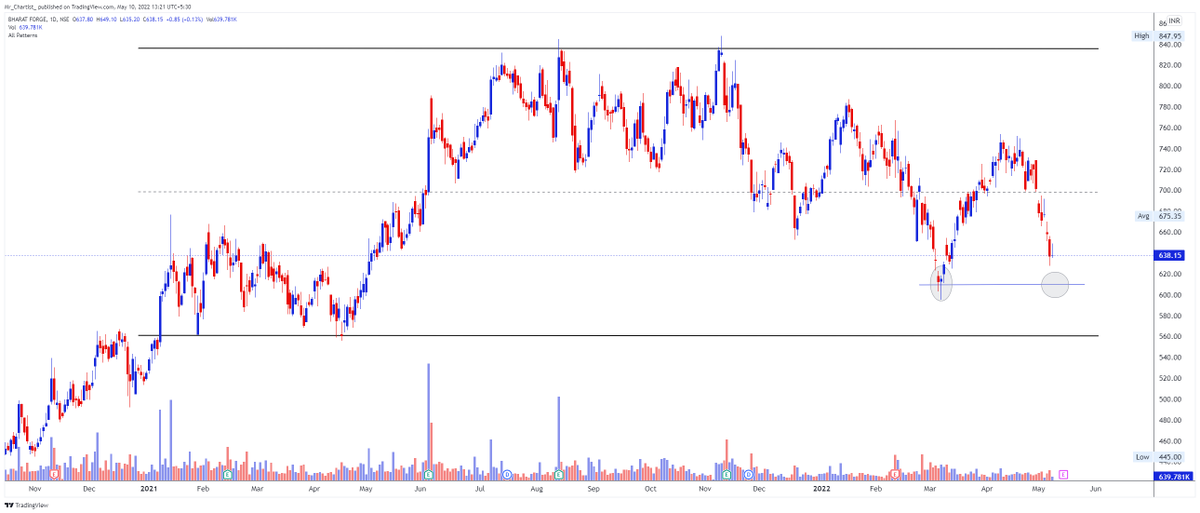
30. BHARATFORG 638
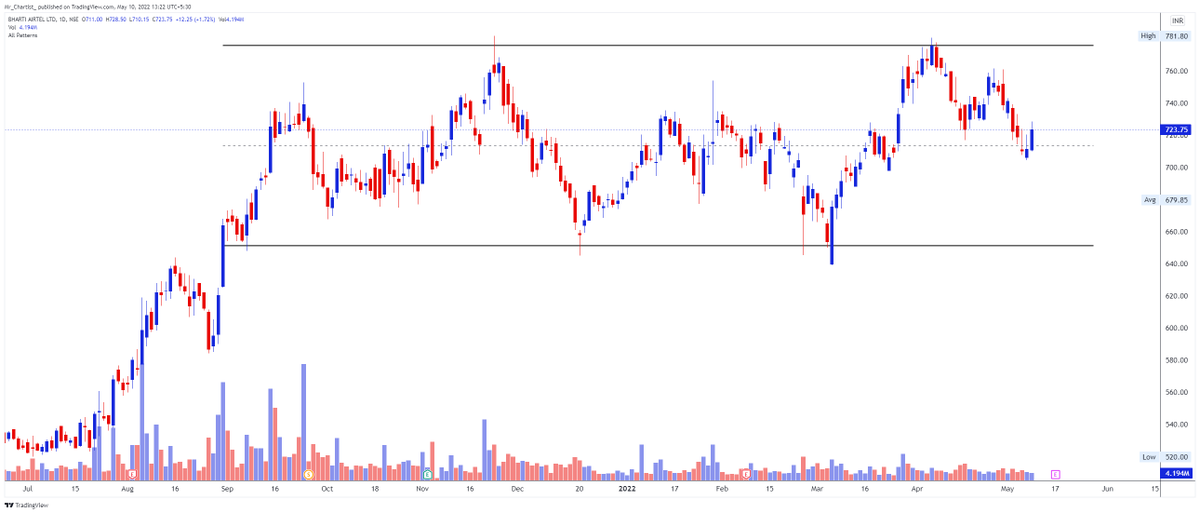
31. BHARTIARTL 723
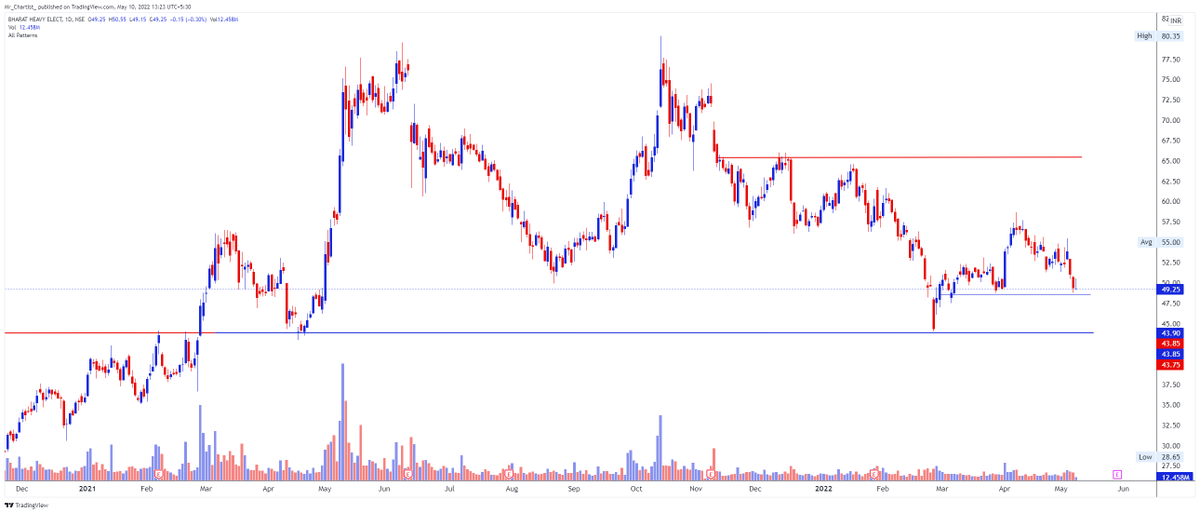
32. BHEL 49.25
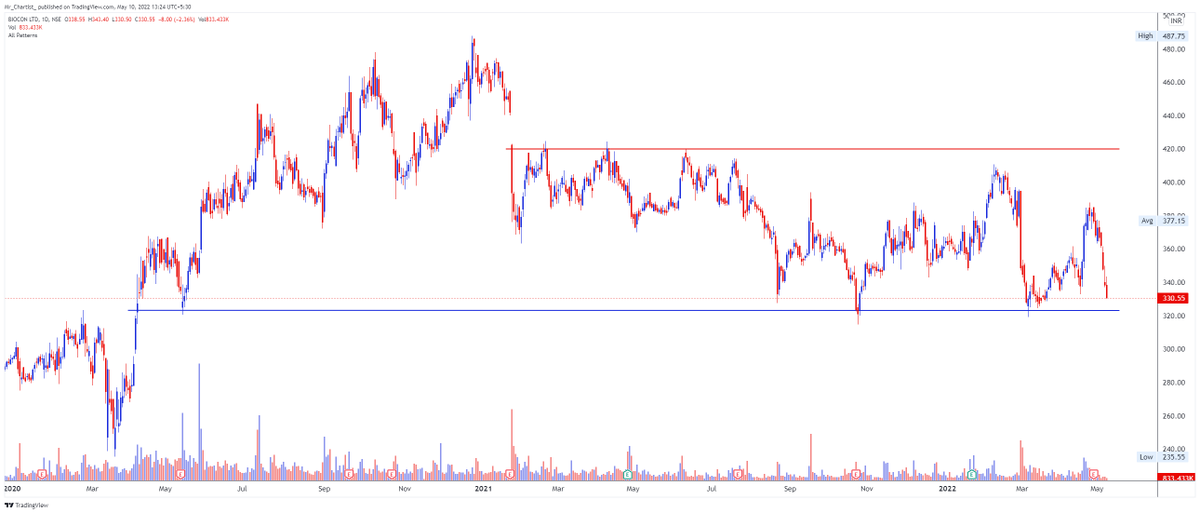
33. BIOCON 331
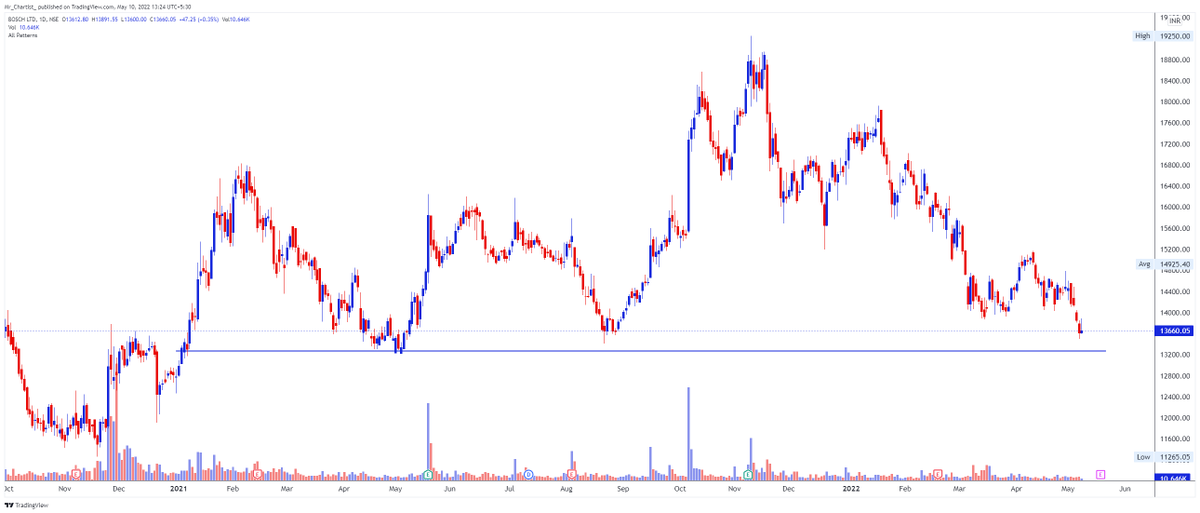
34. BOSCHLTD 13660
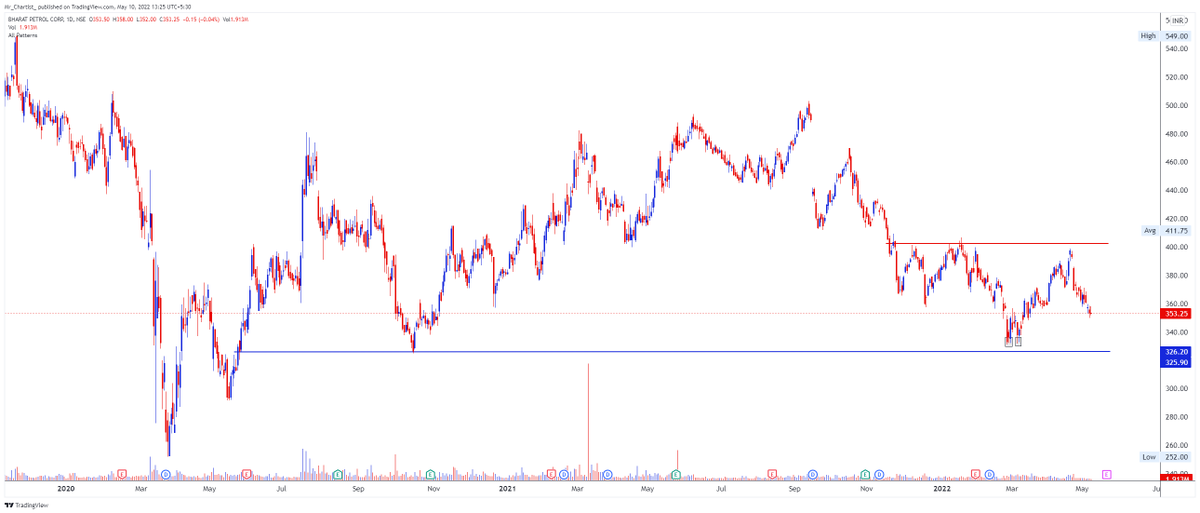
35. BPCL 353
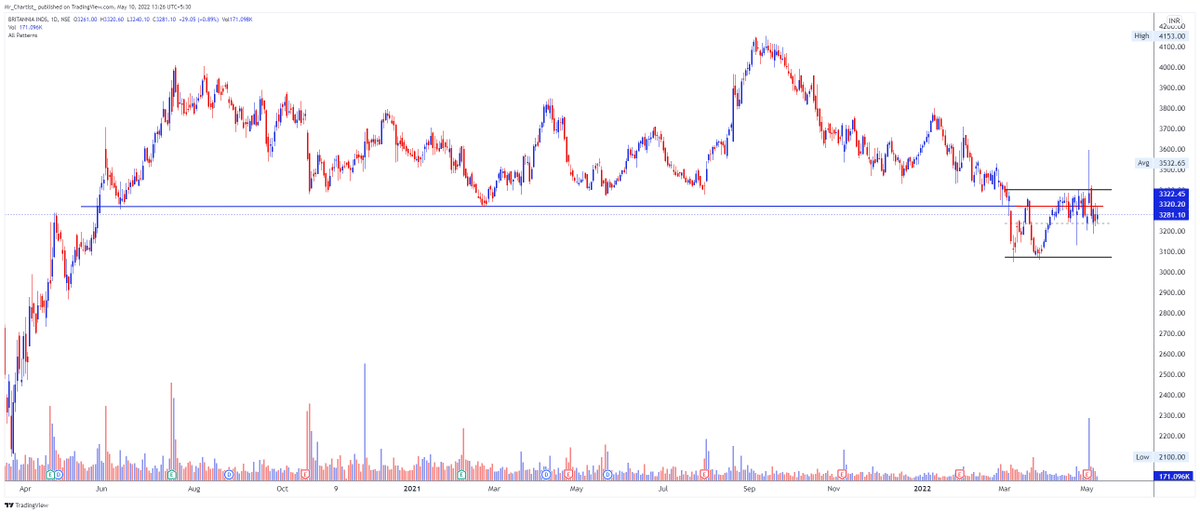
36. BRITANNIA 3280
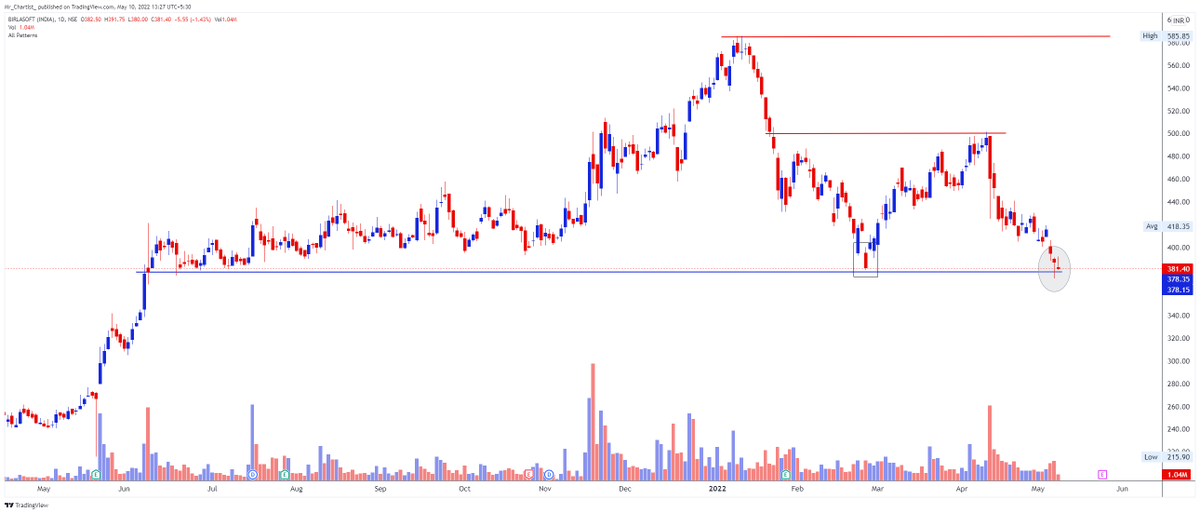
37. BSOFT 381
50. CUMMINSIND 990
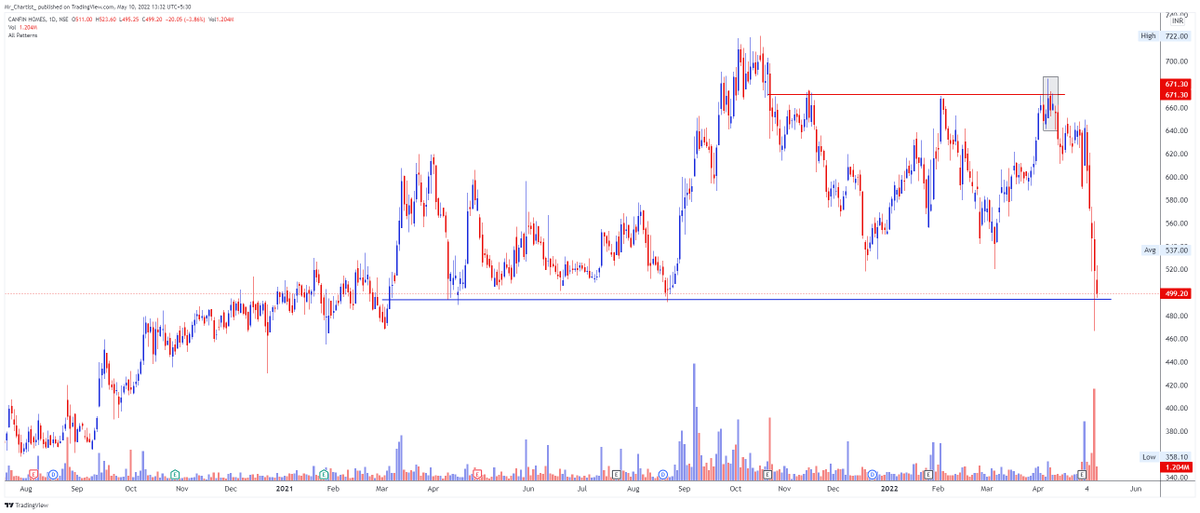
39. CANFINHOME 499
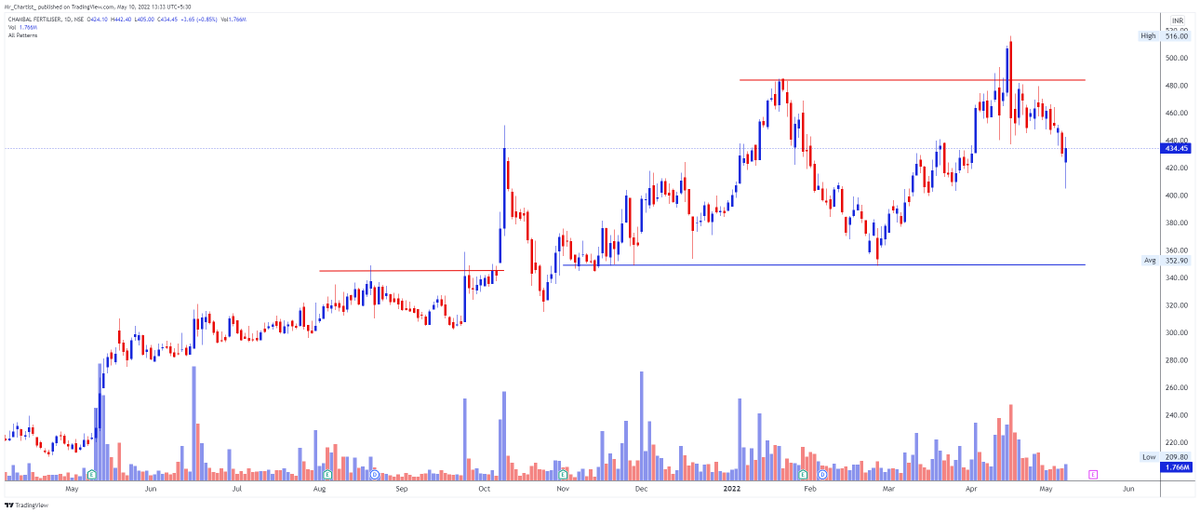
40. CHAMBLFERT 434
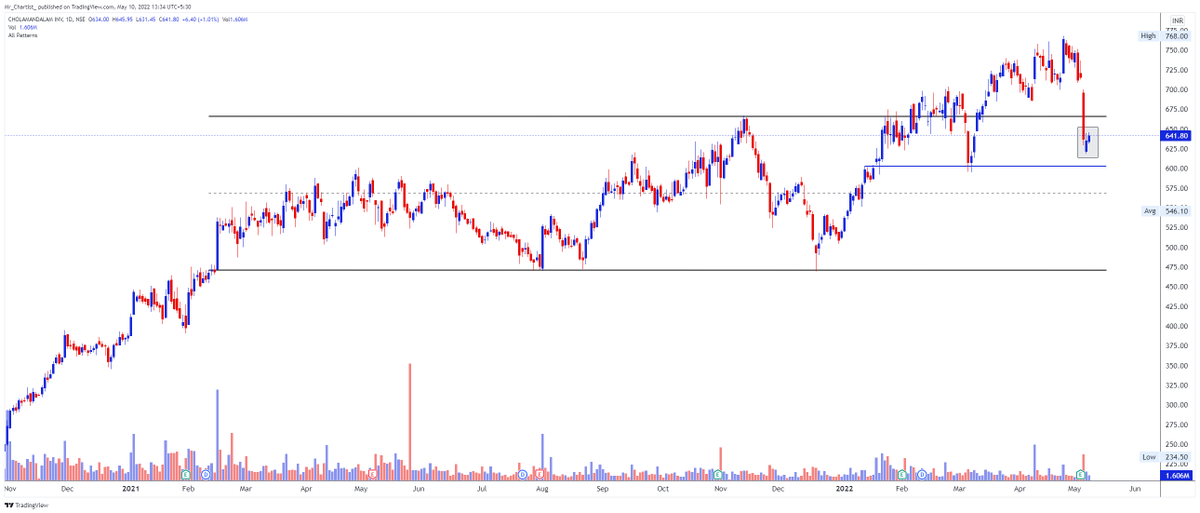
41. CHOLAFIN 641
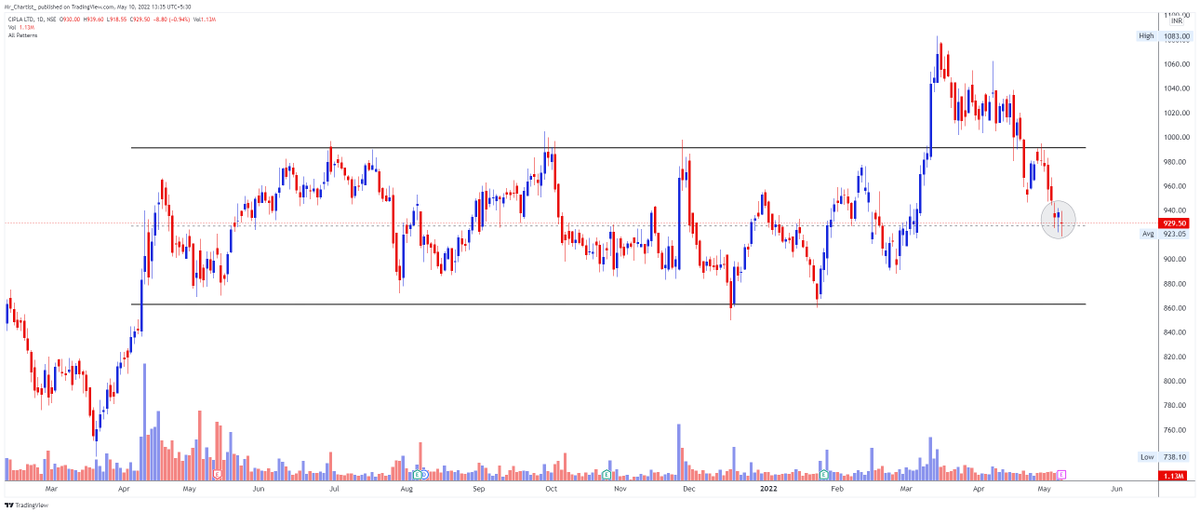
42. CIPLA 929
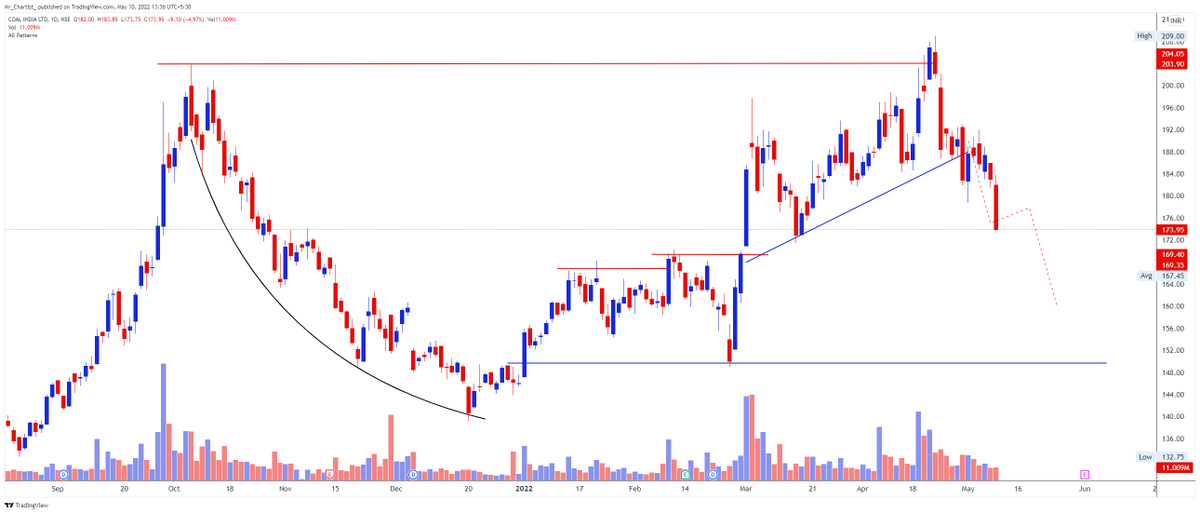
43. COALINDIA 173
NSE:COALINDIA 174
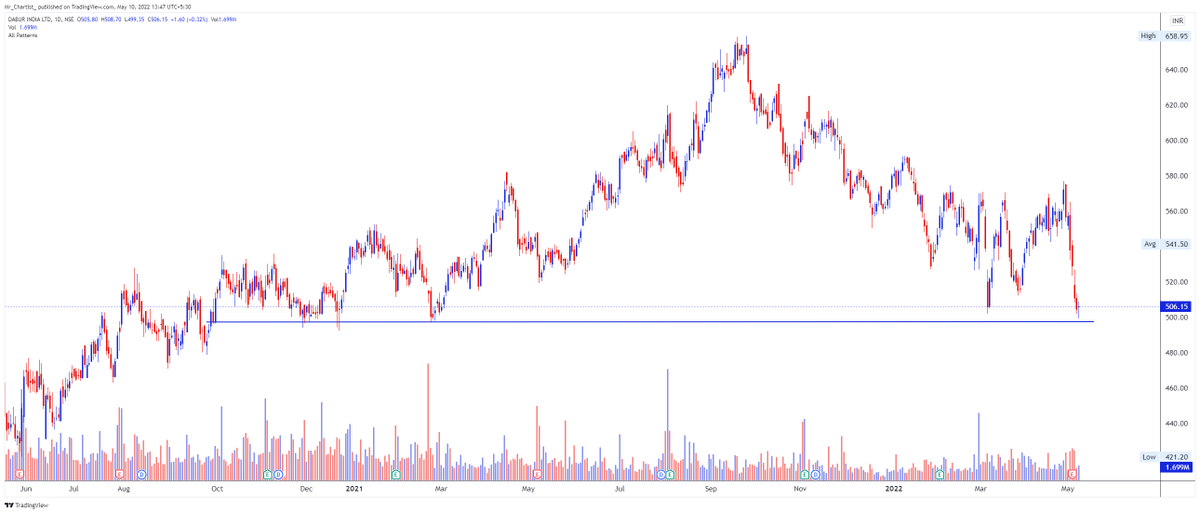
1. Price falling from upside and price trading below the support level
2. Now price can move towards the 165 to 152 levels with the help of 180 resistance level
#TechnicalAnalysiswithMrChartist
NSE:COALINDIA 174
1. Price falling from upside and price trading below the support level
2. Now price can move towards the 165 to 152 levels with the help of 180 resistance level
#TechnicalAnalysiswithMrChartist
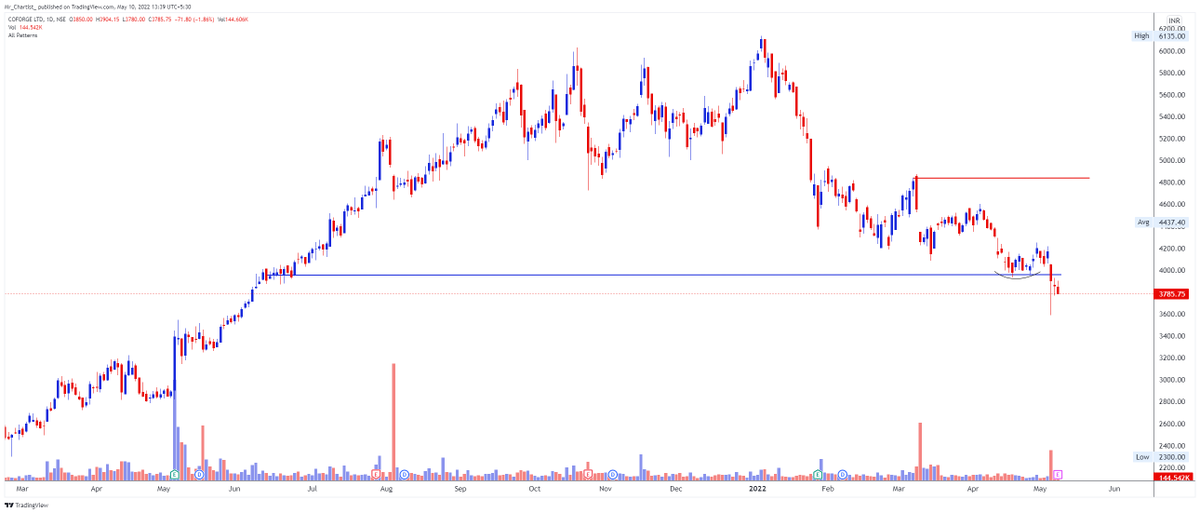
44. COFORGE 3784
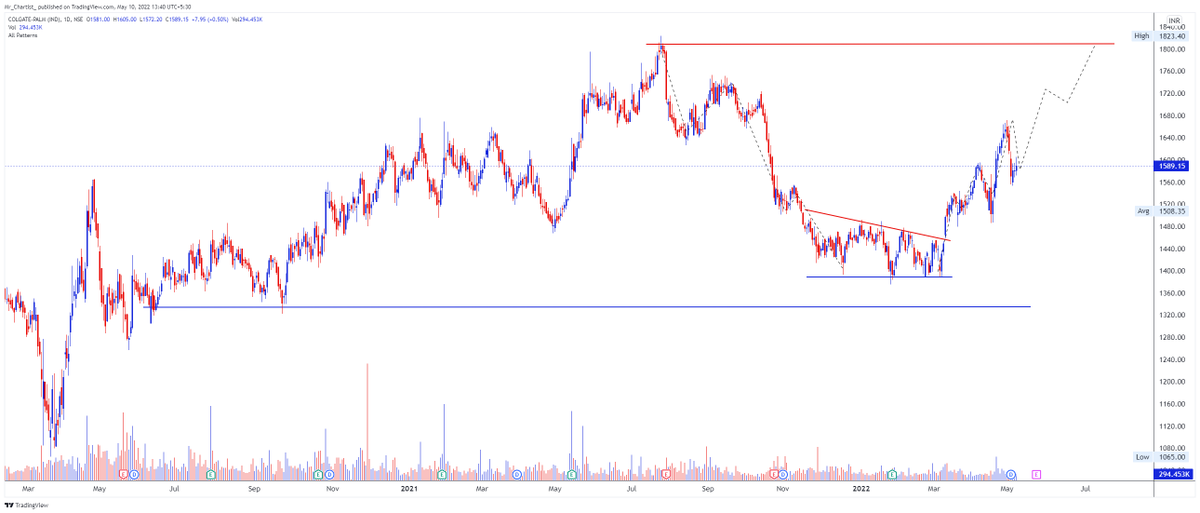
45. COLPAL 1589
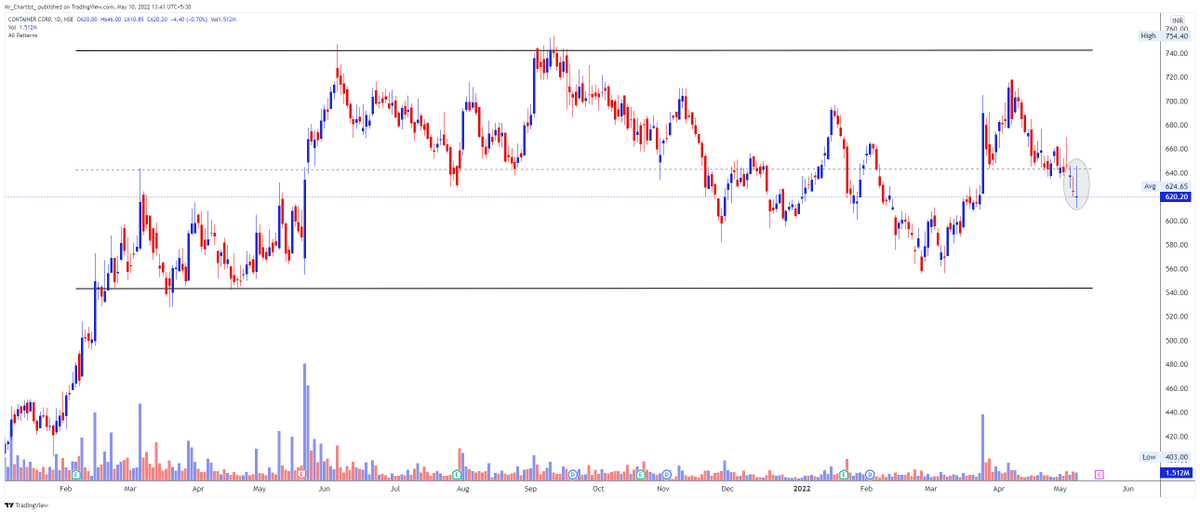
46. CONCOR 620
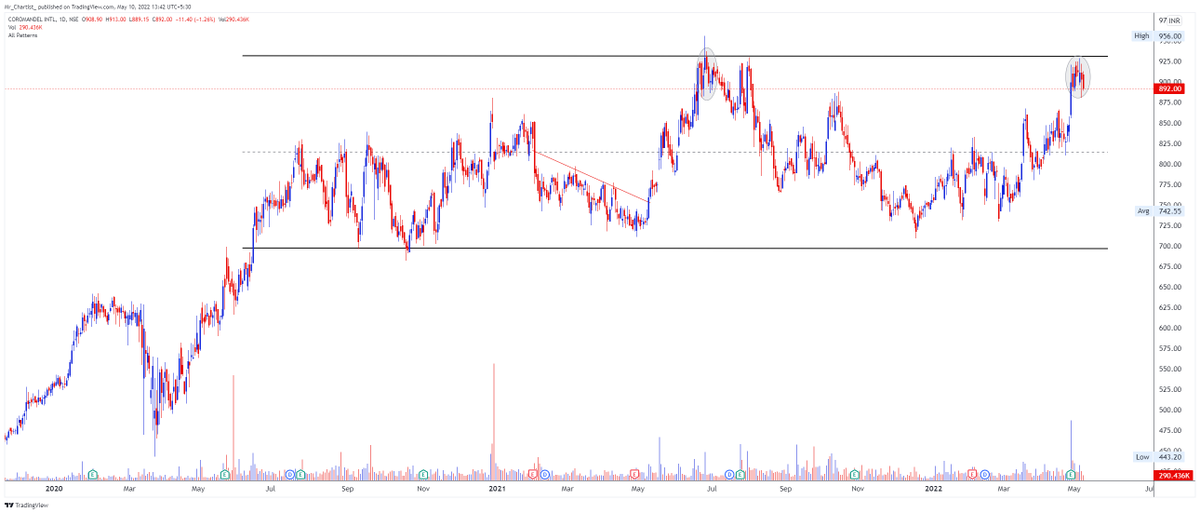
47. COROMANDEL 892
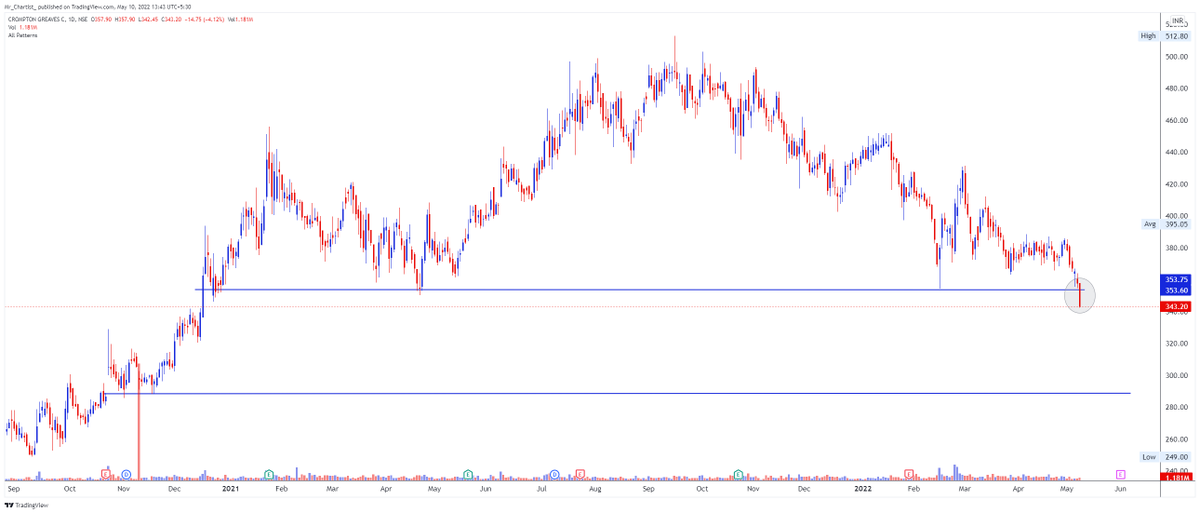
48. CROMPTON 343
1. Price trading below major support line with strong volume
2. Upcoming level to watch 320-300 level
3. Resistance near 360 level.
#TechnicalAnalysiswithMrChartist.
1. Price trading below major support line with strong volume
2. Upcoming level to watch 320-300 level
3. Resistance near 360 level.
#TechnicalAnalysiswithMrChartist.
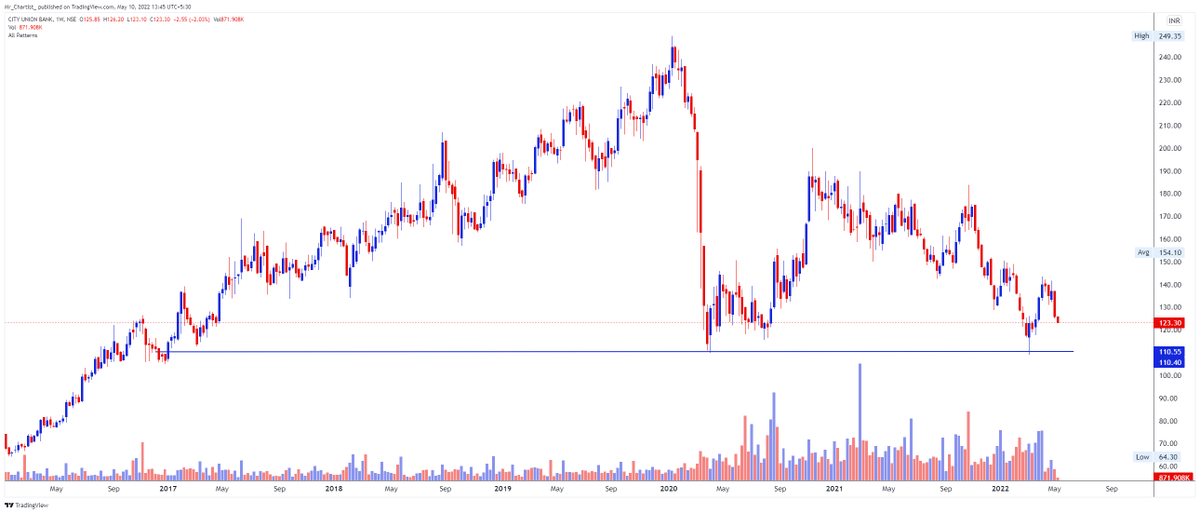
49. CUB 123
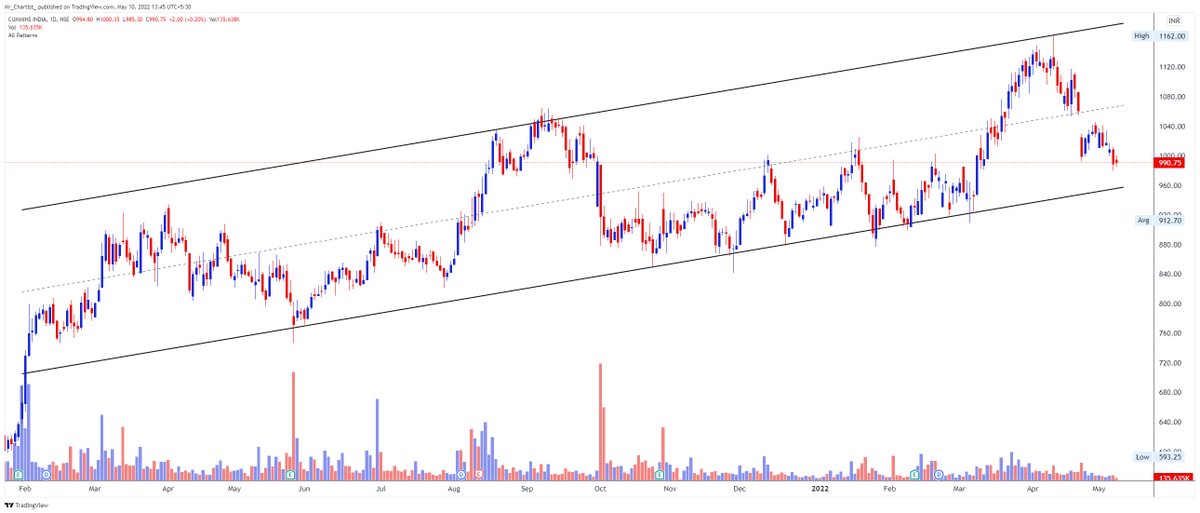
50. CUMMINSIND 990
73. GUJGASLTD 512.4
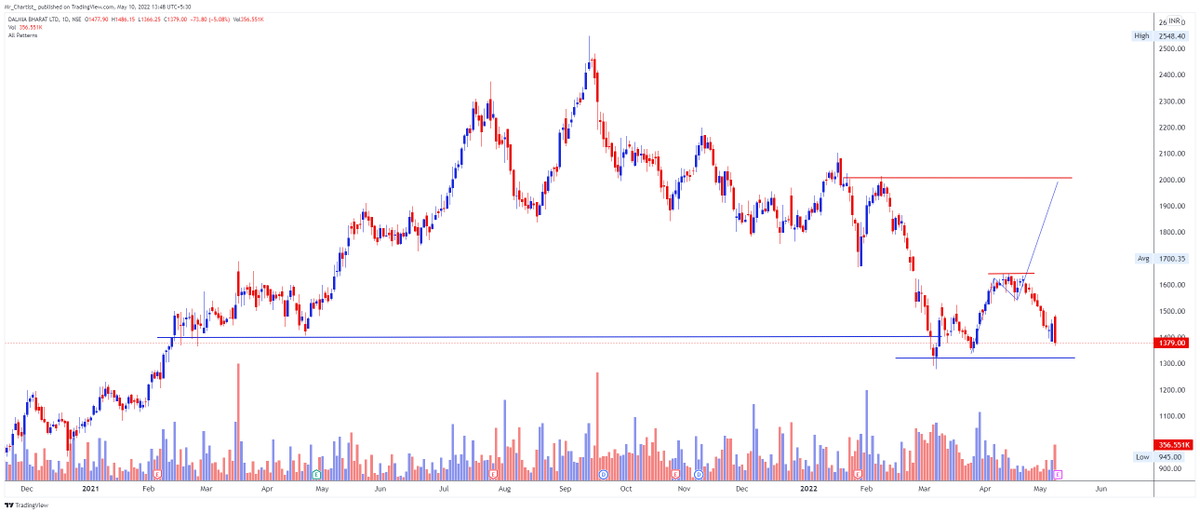
52. DALBHARAT 1379
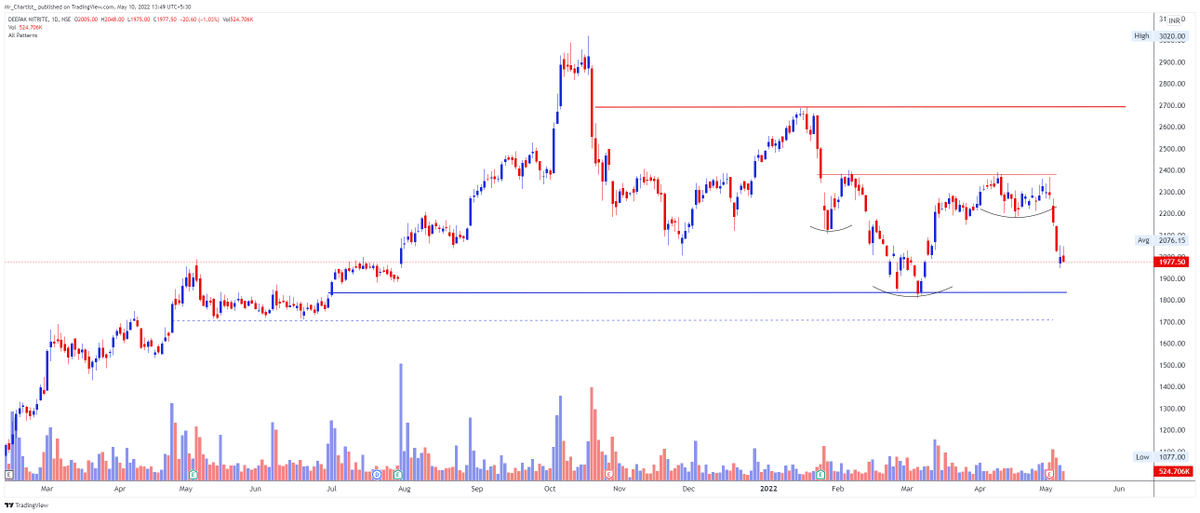
53. DEEPAKNTR
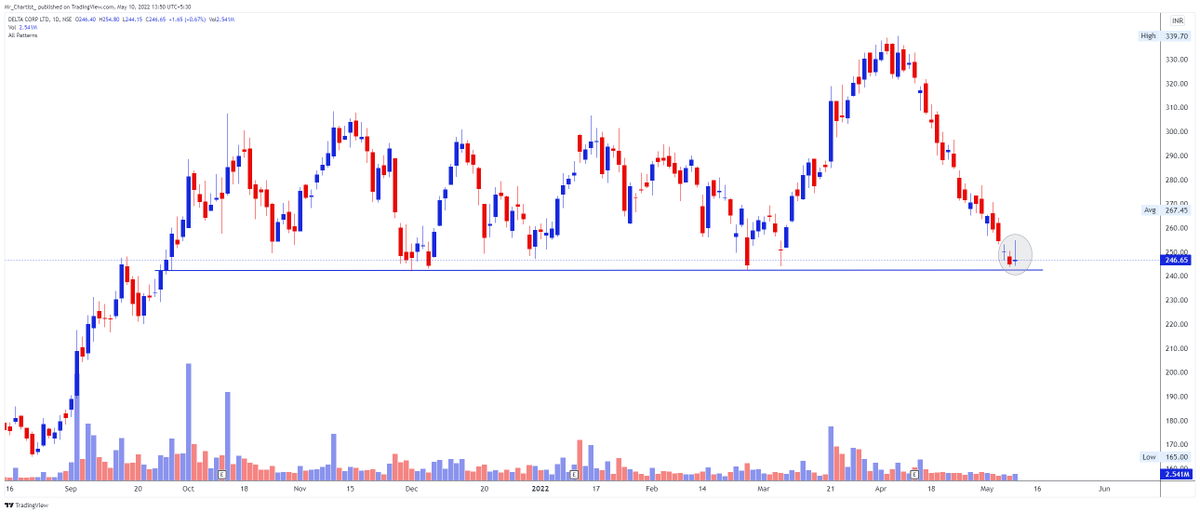
54. DELTACORP 246
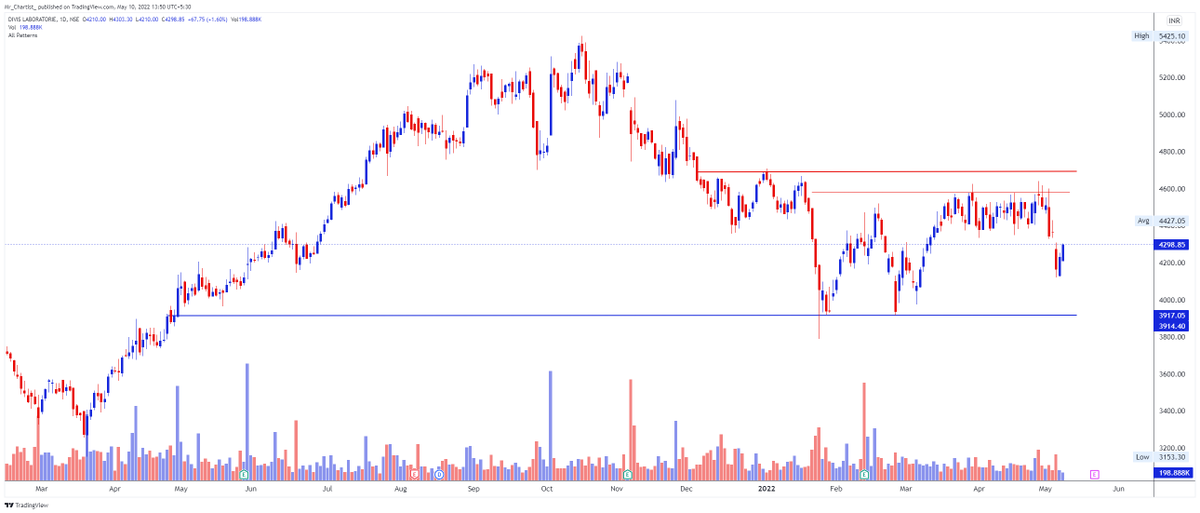
55. DIVISLAB 4299
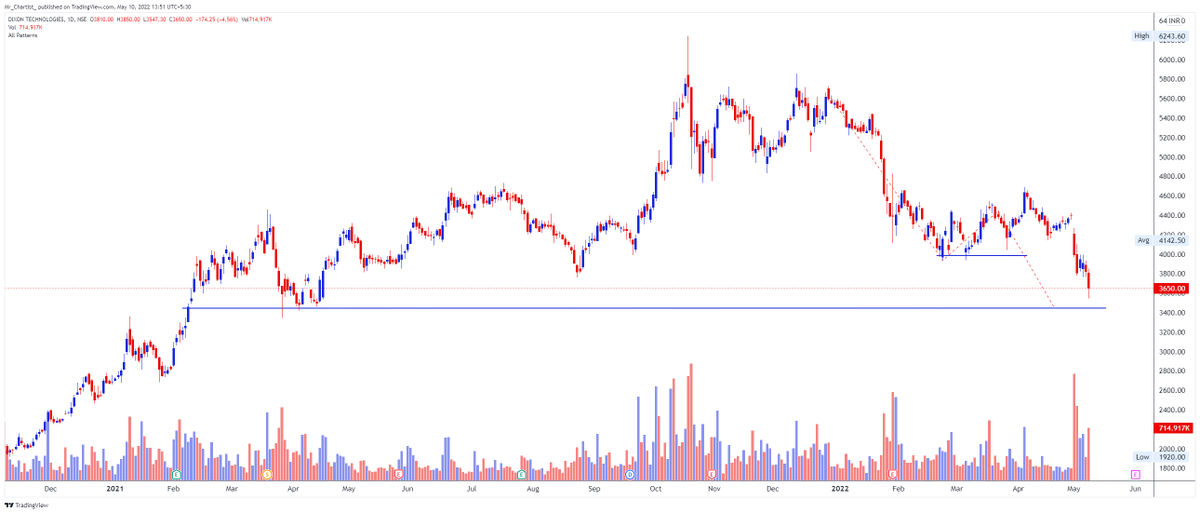
56. DIXON 3654
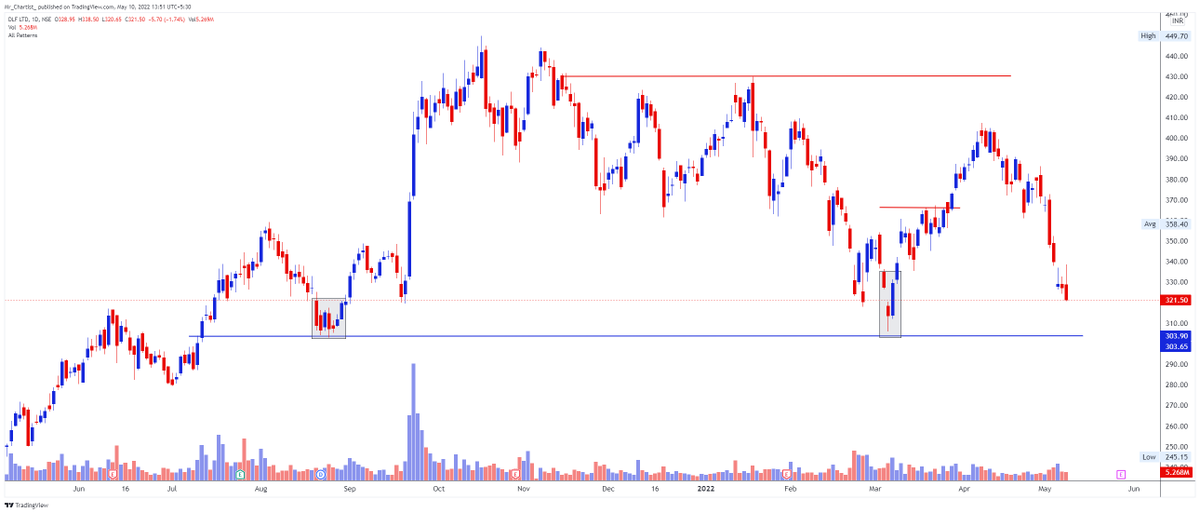
57. DLF 321
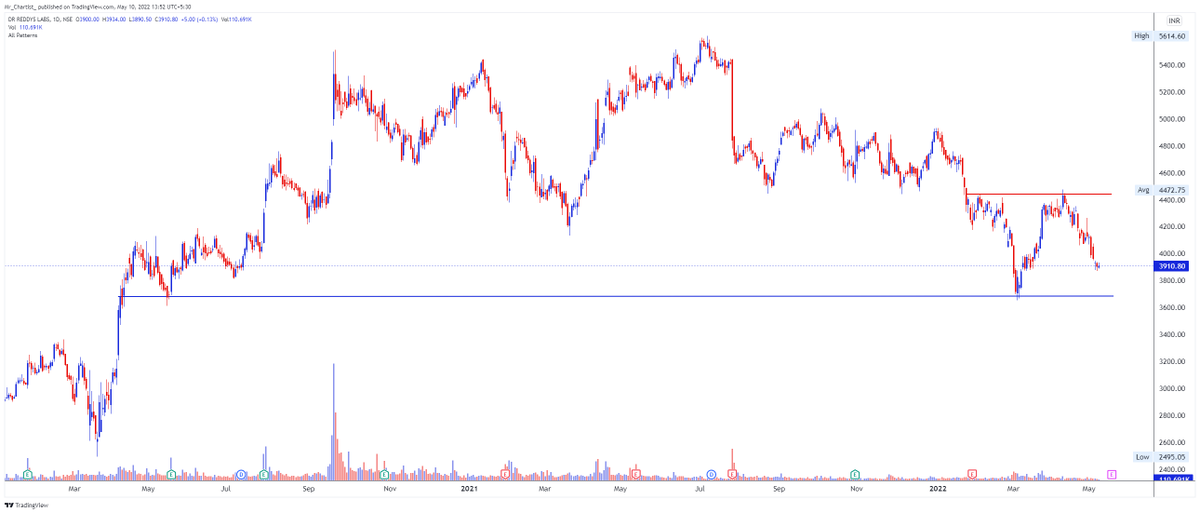
58. DRREDDY 3910
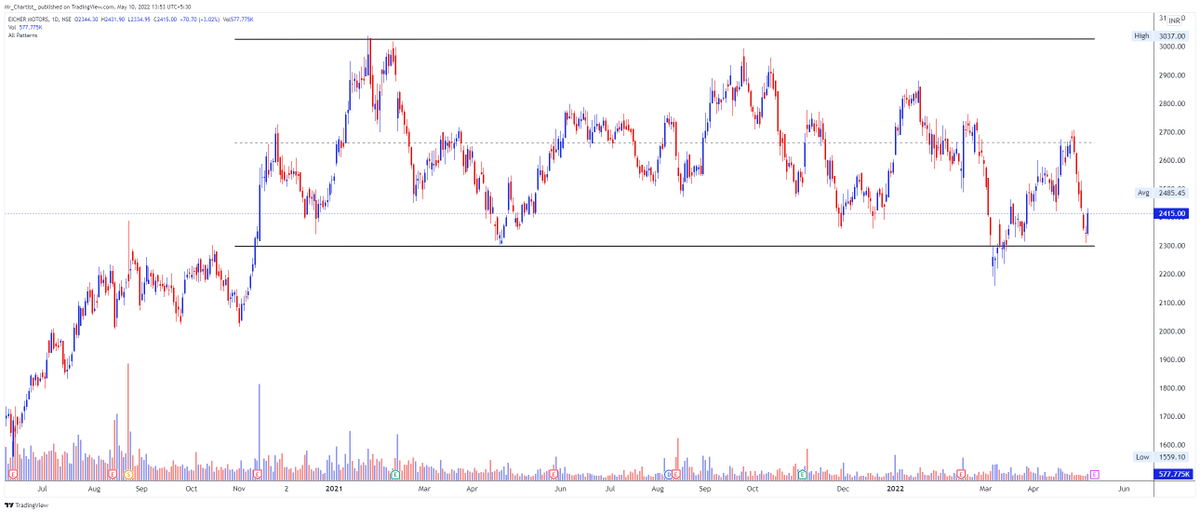
59. EICHERMOT 2415
1. Trading in the Rectangle Pattern and now price trading at support level
2. Moring Star Formation price moving upside with strong volume
3. Upcoming levels to watch 2600-2900 levels
4. Support near 2300 level on the chart.
#TechnicalAnalaysiswitMrChartist
1. Trading in the Rectangle Pattern and now price trading at support level
2. Moring Star Formation price moving upside with strong volume
3. Upcoming levels to watch 2600-2900 levels
4. Support near 2300 level on the chart.
#TechnicalAnalaysiswitMrChartist
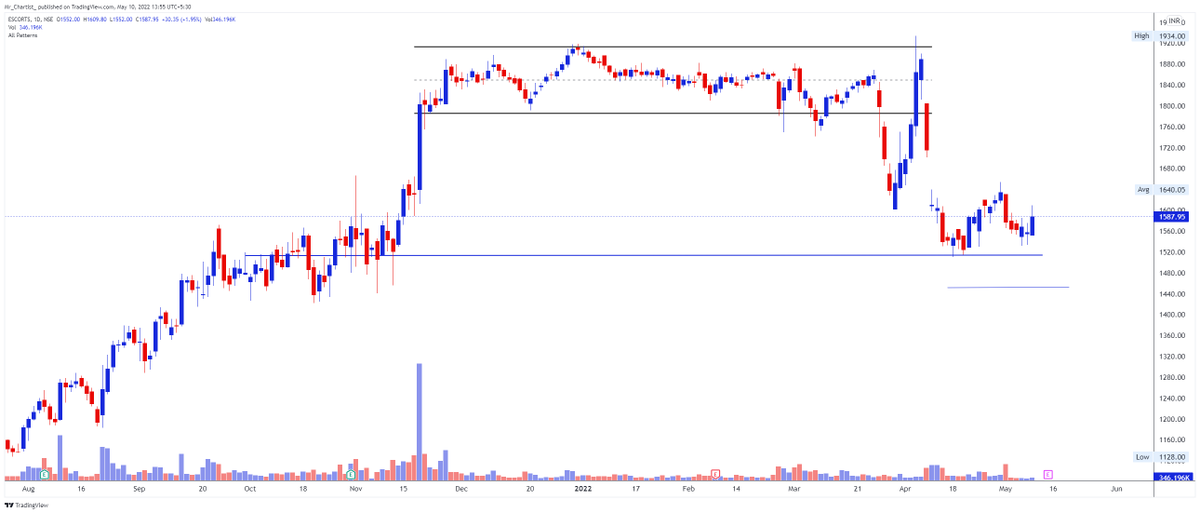
60. ESCORTS 1588
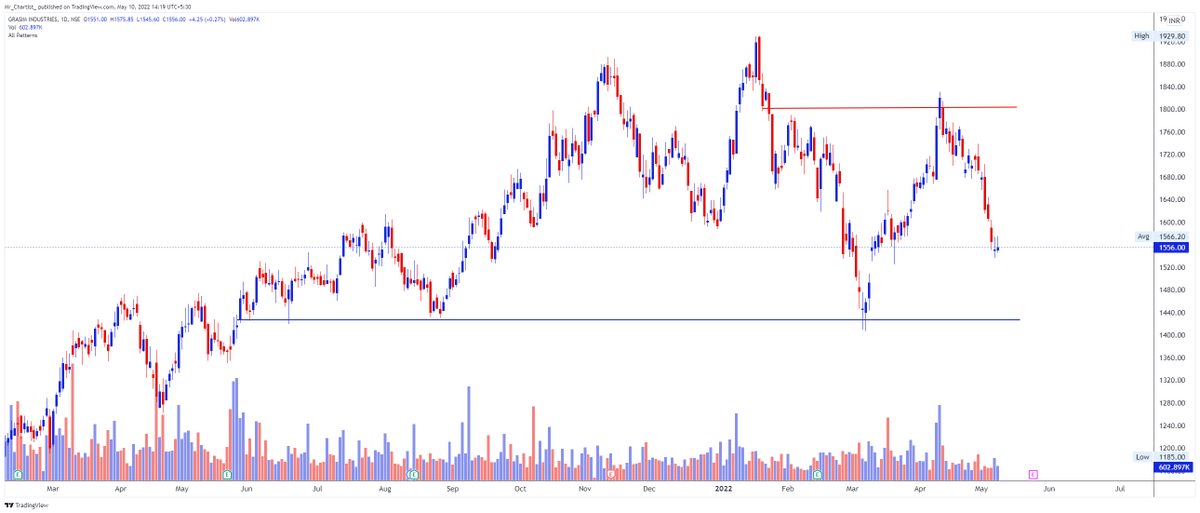
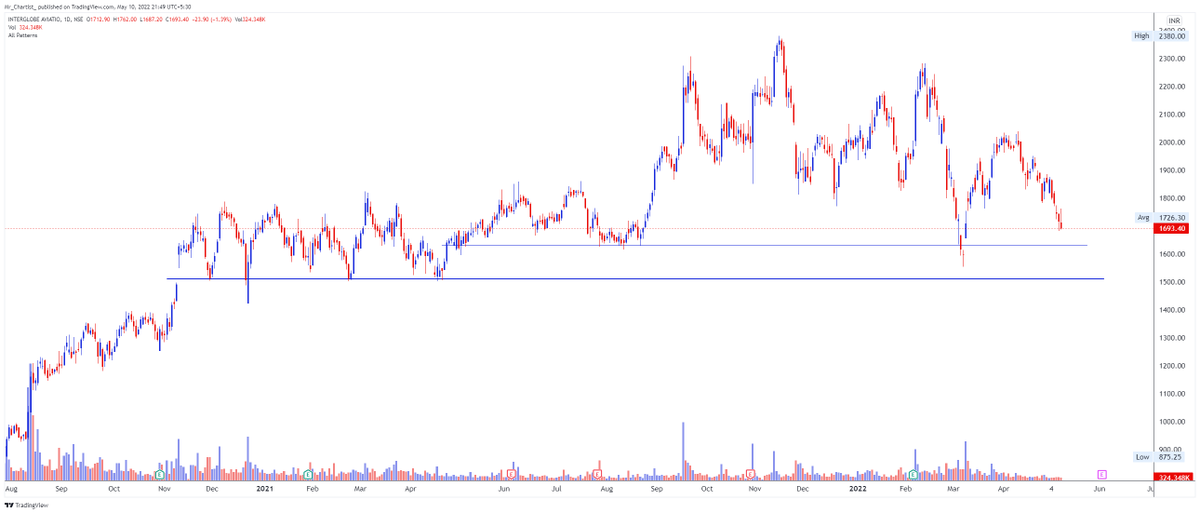
1. Price trading at support level and consolidated between 1640 to 1520 range.
2. Above 1640 we can see some possible upside in the chart and below 1520 we will have major breakdown in the chart.
#TechnicalAnalysiswithMrChartist
1. Price trading at support level and consolidated between 1640 to 1520 range.
2. Above 1640 we can see some possible upside in the chart and below 1520 we will have major breakdown in the chart.
#TechnicalAnalysiswithMrChartist
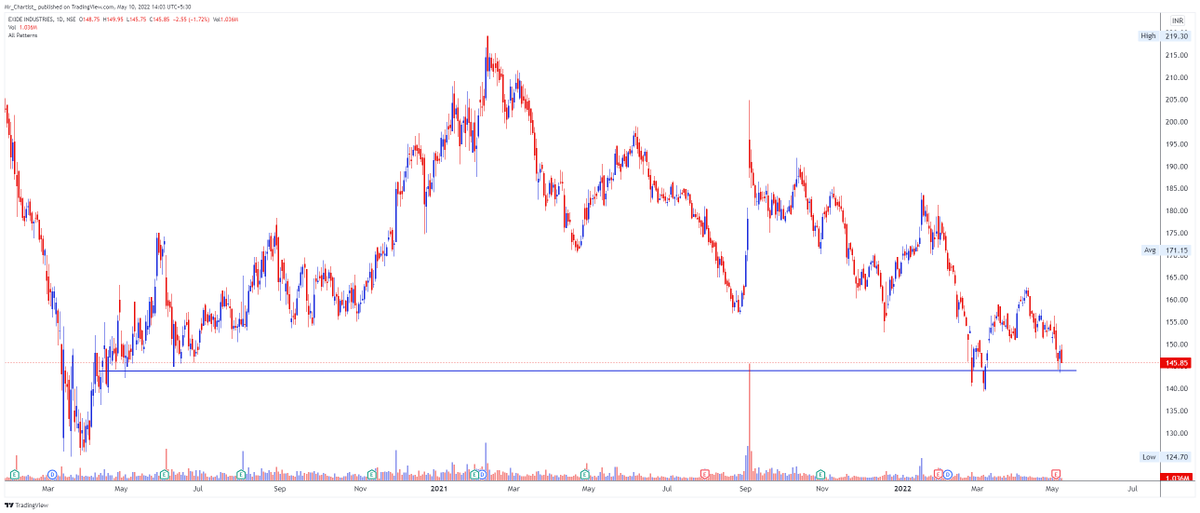
61.EXIDEIND 145
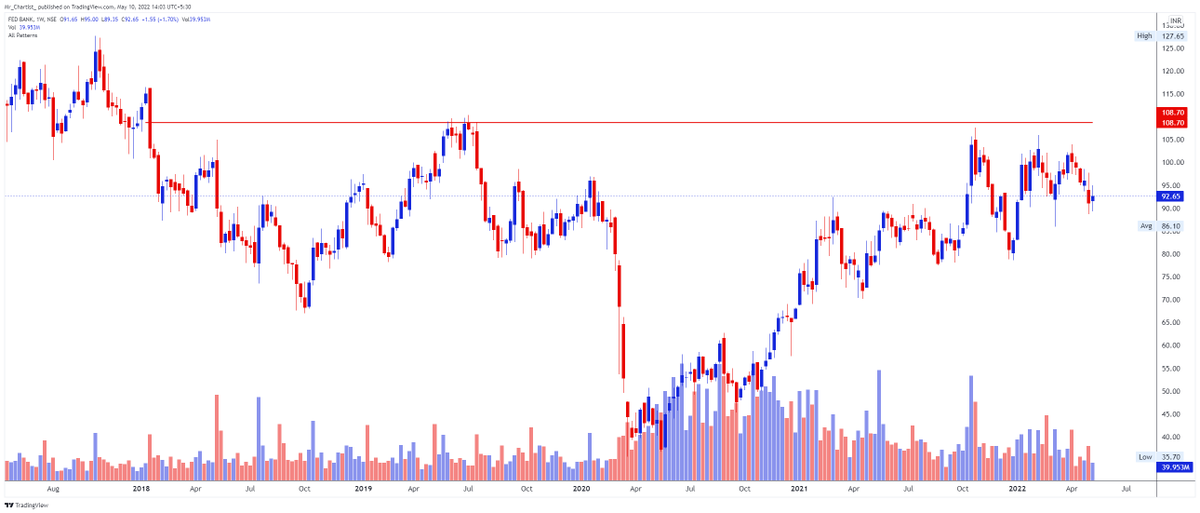
62. FEDERALBNK 92.55
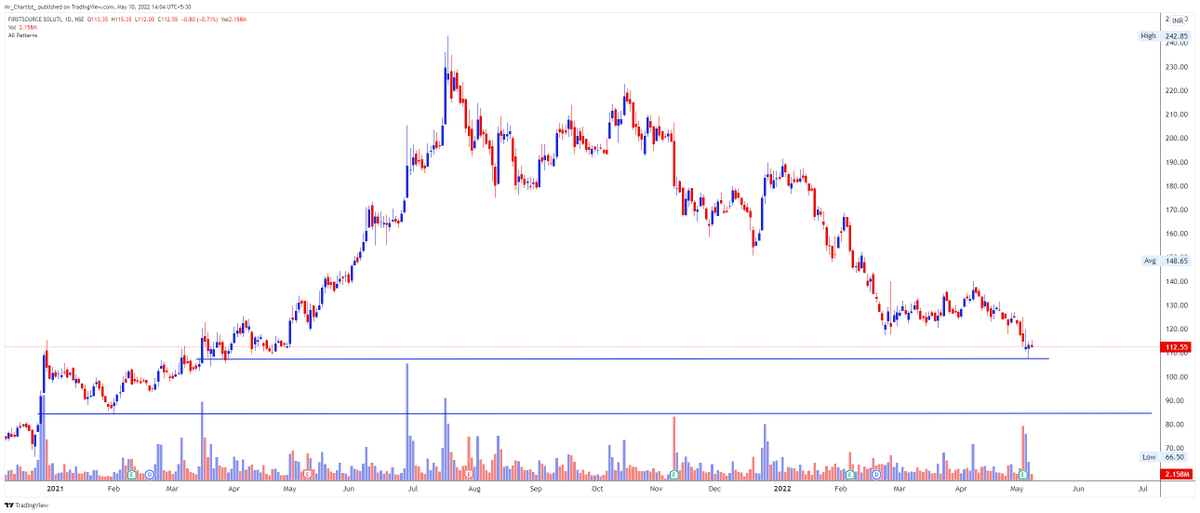
63. FSL 112
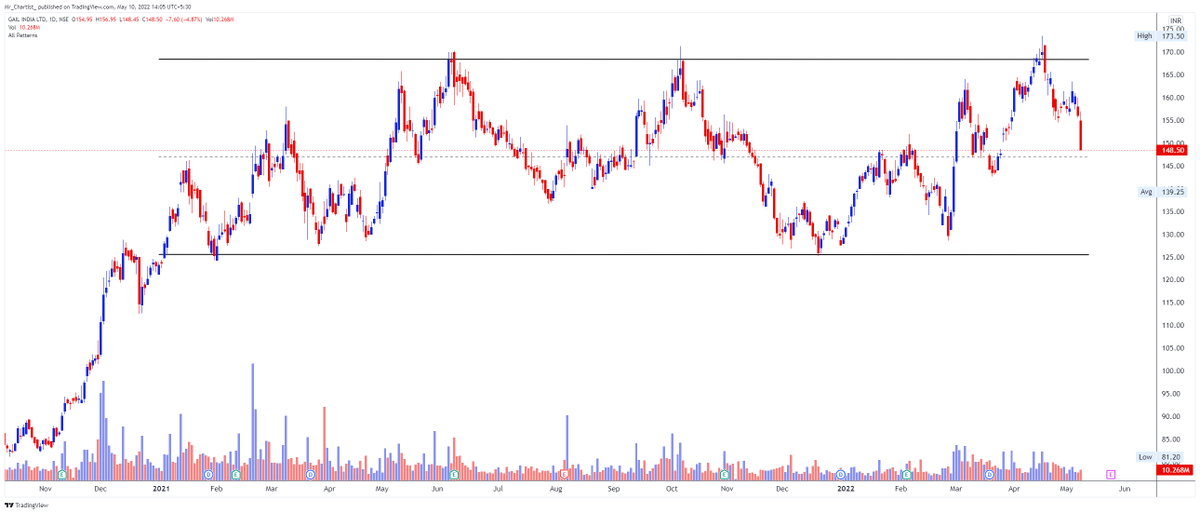
64. GAIL 148.4
1. Price falling with strong volume along with price
2. 146 is only hope for price and if price break 146 level we can see some major fall
3. Resistance near 155 level on the chart.
#TechnicalAnalysiswithMrChartist
1. Price falling with strong volume along with price
2. 146 is only hope for price and if price break 146 level we can see some major fall
3. Resistance near 155 level on the chart.
#TechnicalAnalysiswithMrChartist
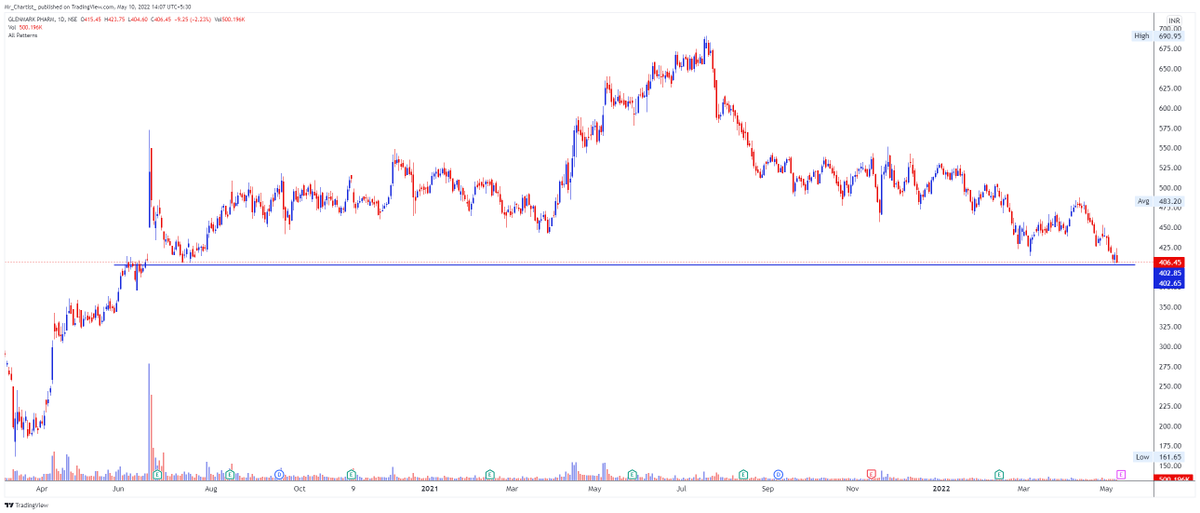
65. GLENMARK 406.45
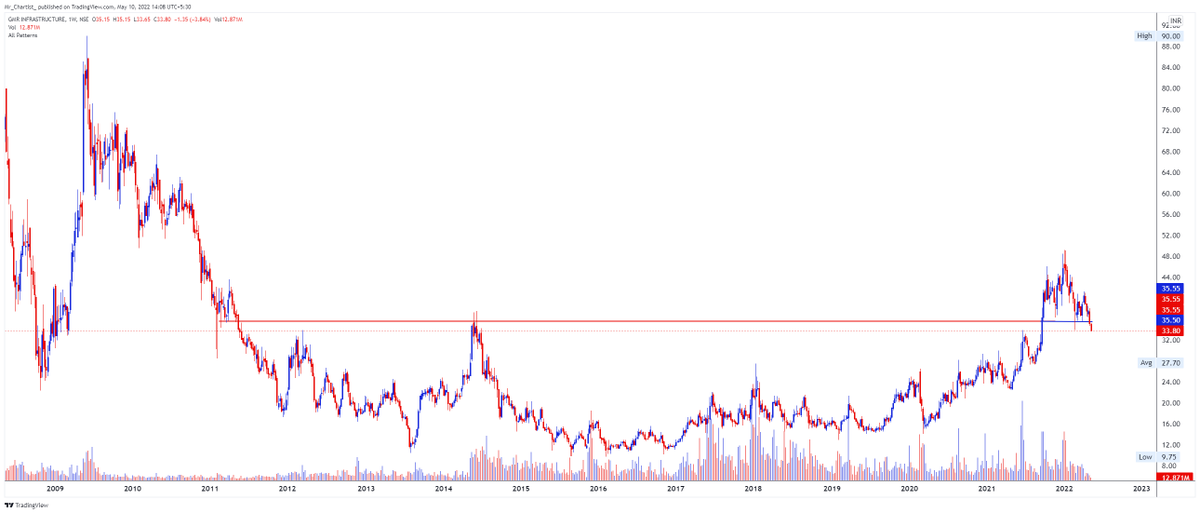
66. GMRINFRA 33.8
1. Price fall below breakout level in rounding bottom pattern
2. Below 35 price is a little bit in the bearish zone
3. Above 38 level price will be out of the danger zone.
#TechnicalAnalysiswithMrChartist
1. Price fall below breakout level in rounding bottom pattern
2. Below 35 price is a little bit in the bearish zone
3. Above 38 level price will be out of the danger zone.
#TechnicalAnalysiswithMrChartist
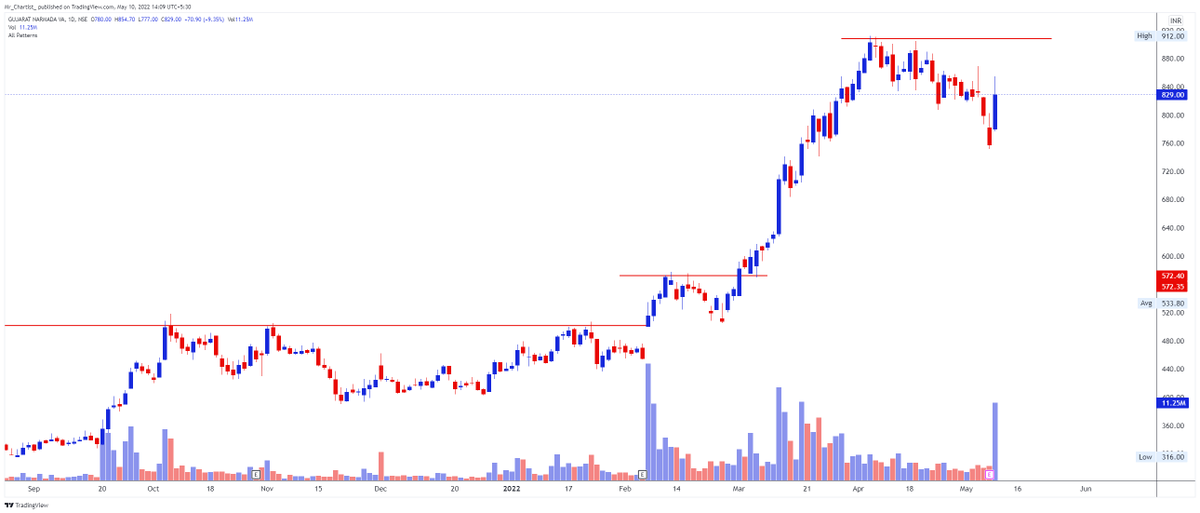
67. GNFC 828
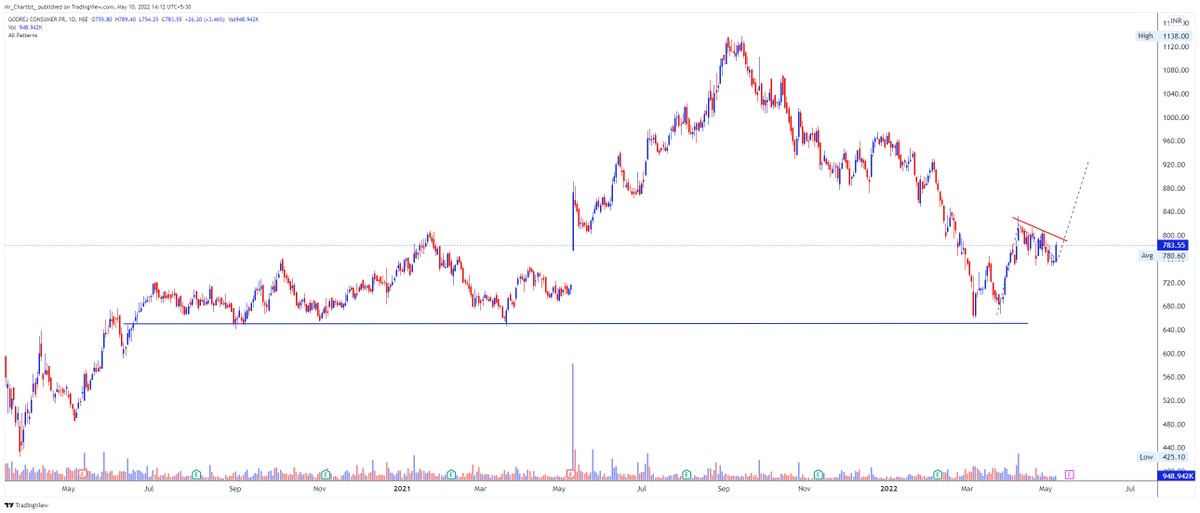
68. GODREJCP 782
1. Pole and Flag Formation in the chart and breakout above the 795 level
2. Price looking good here and support near the 750 level.
#TechnicalAnalysiswithMrChartist
1. Pole and Flag Formation in the chart and breakout above the 795 level
2. Price looking good here and support near the 750 level.
#TechnicalAnalysiswithMrChartist
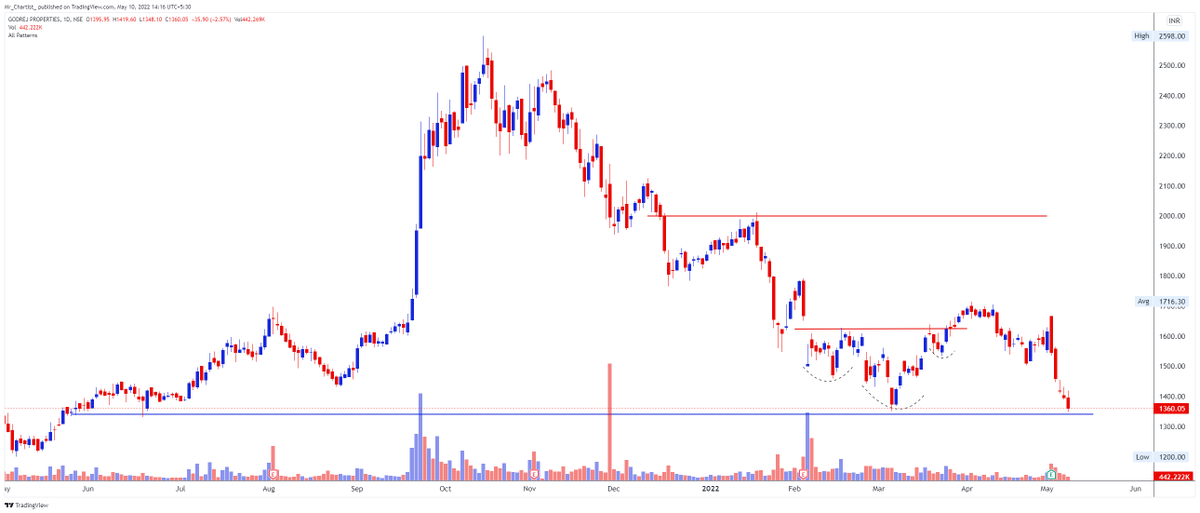
69. GODREJPROP 1359
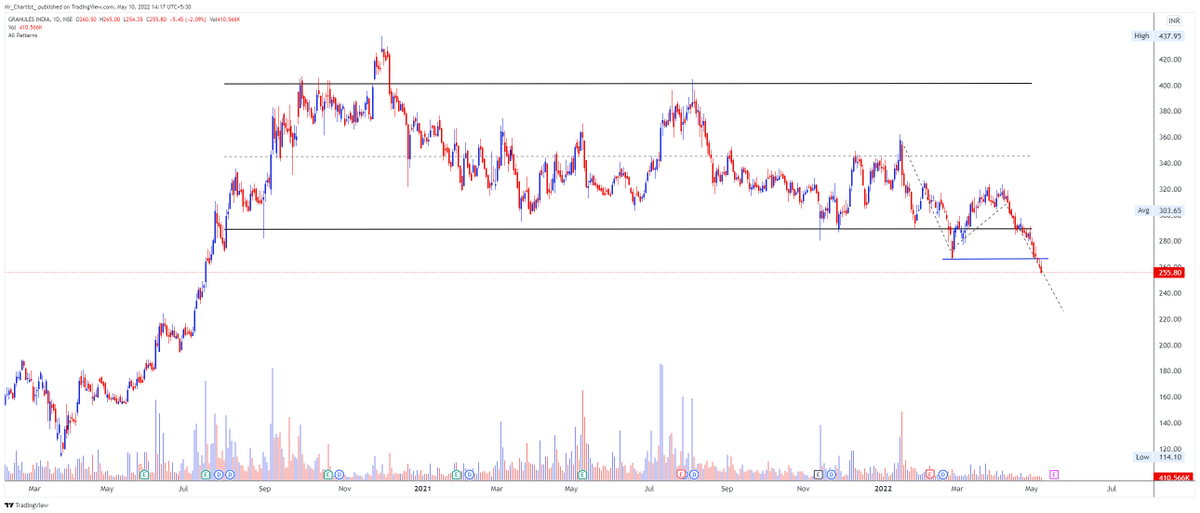
70. GRANULES 255.8
71. GRASIM 1556
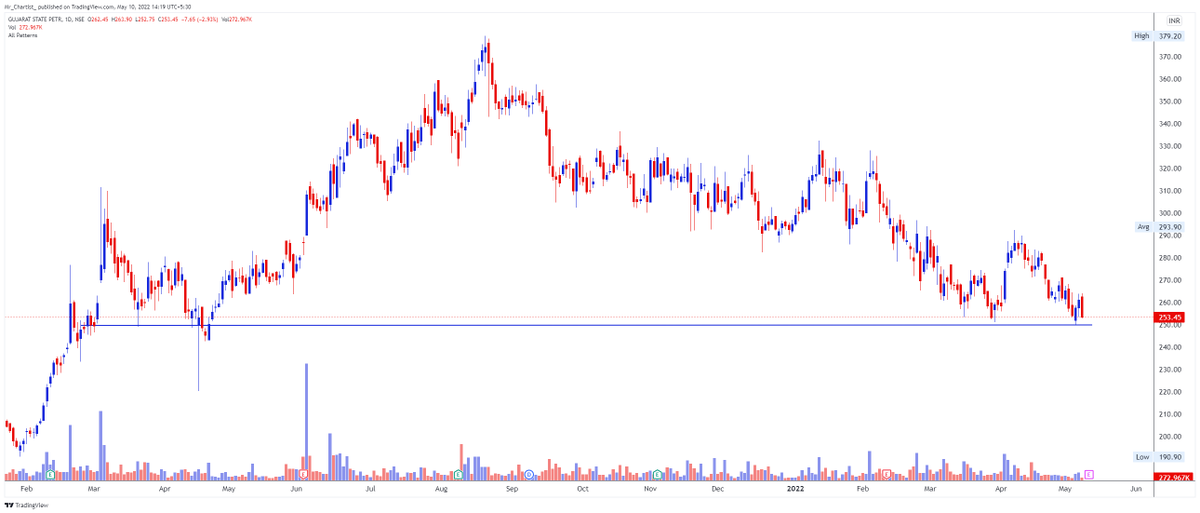
72. GSPL 253.45
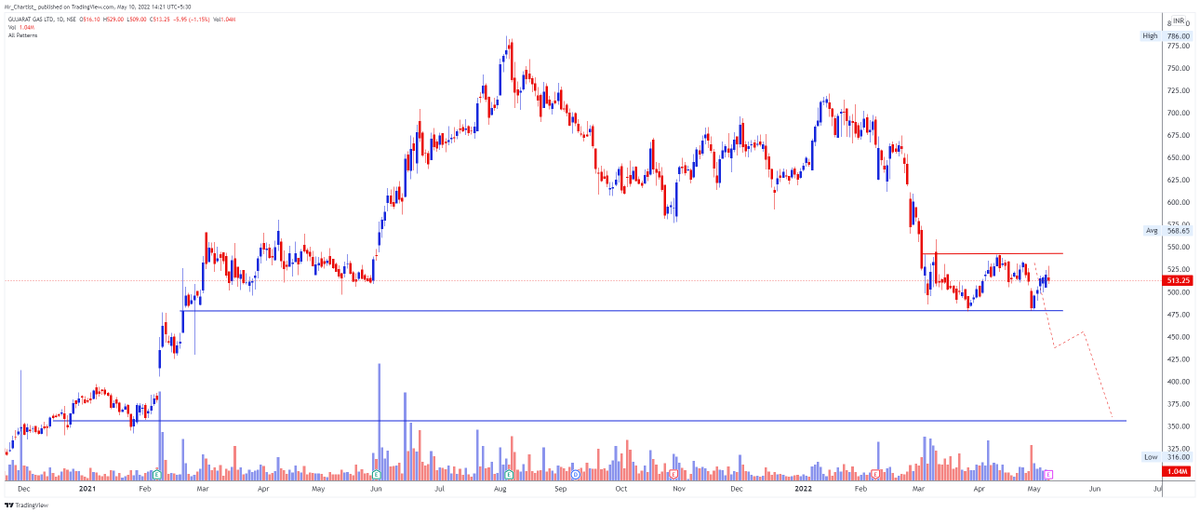
73. GUJGASLTD 512.4
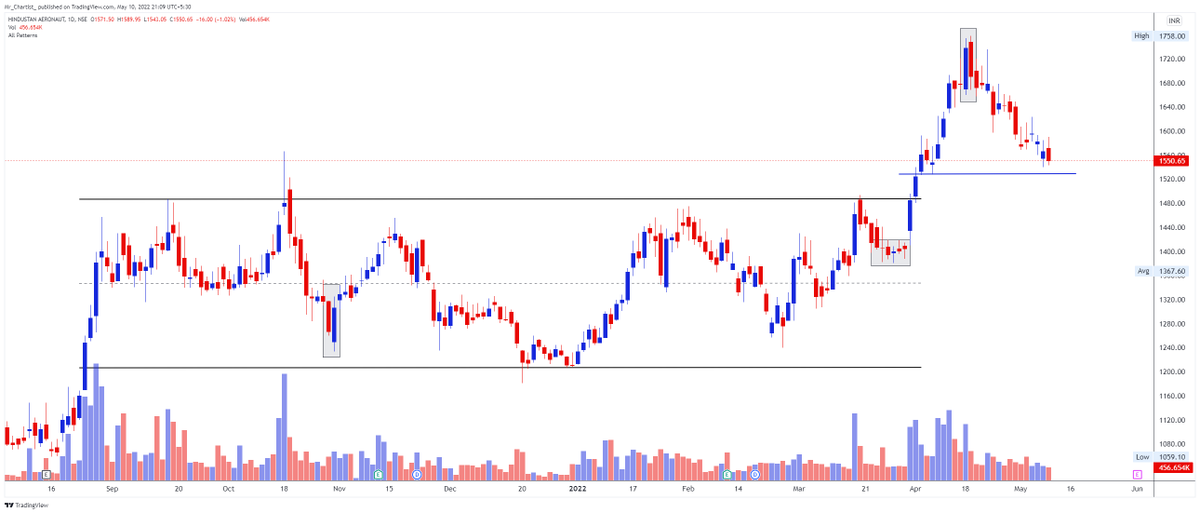
74. HAL 1550
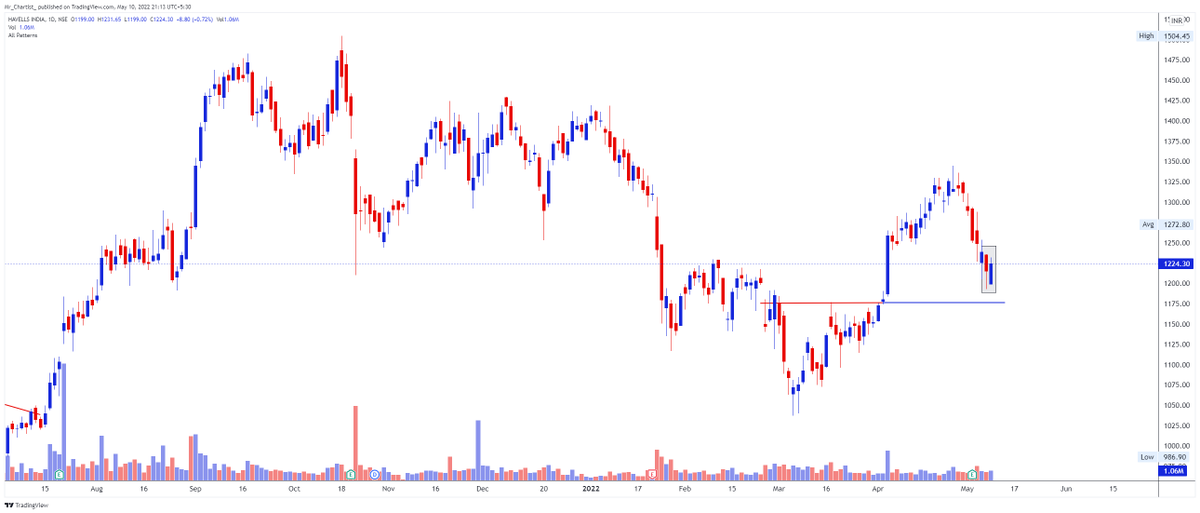
75. HAVELLS 1224
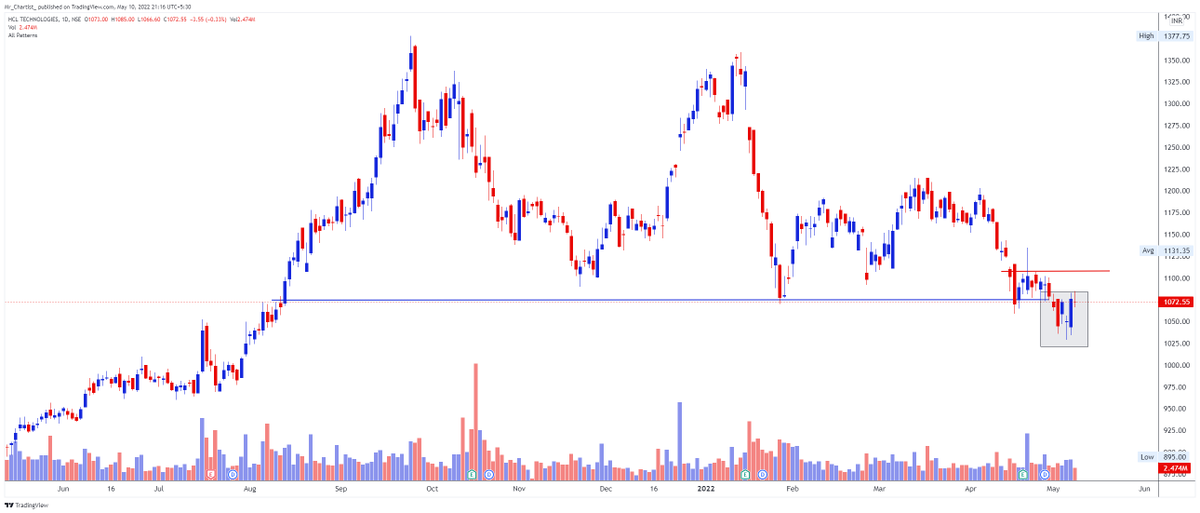
76. HCLTECH 1069
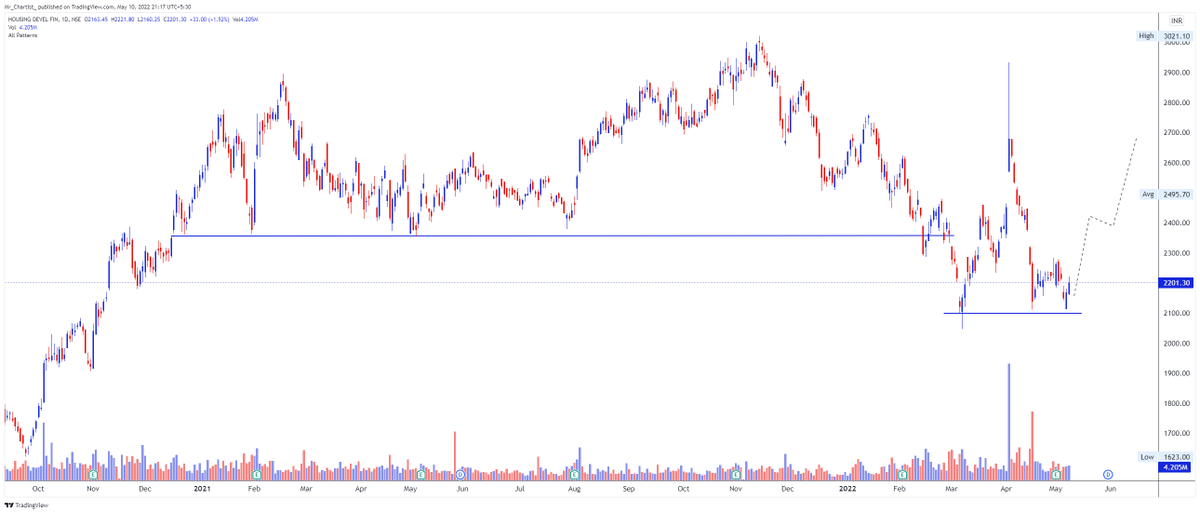
77. HDFC 2201
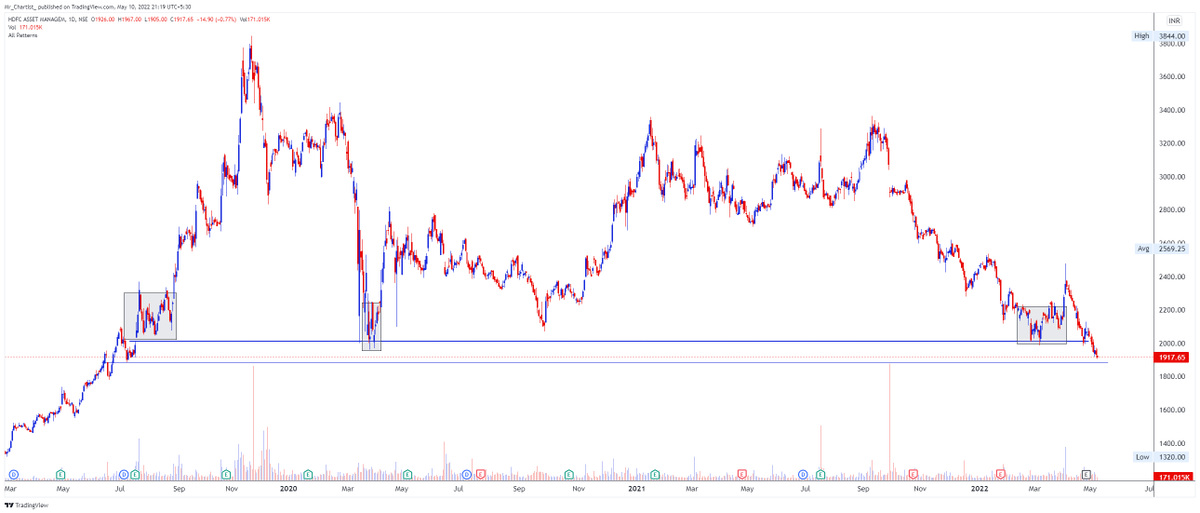
78. HDFCAMC 1917
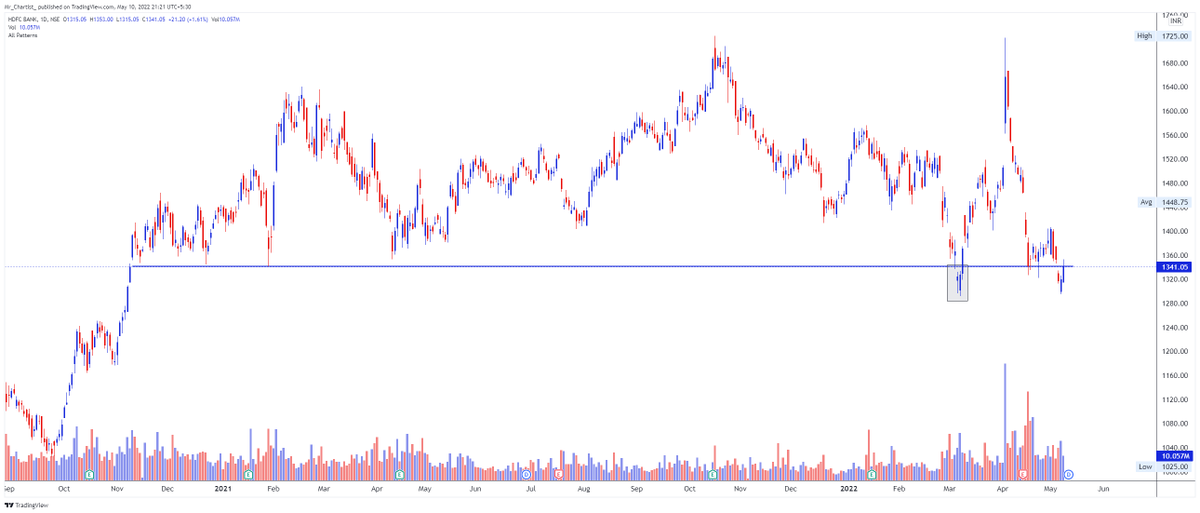
79. HDFCBANK 1341
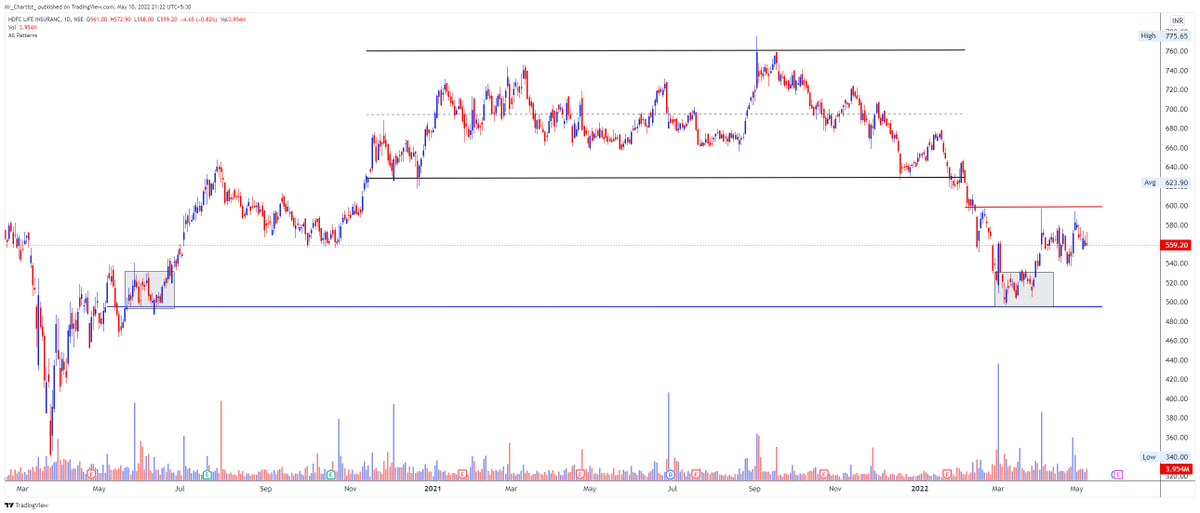
80. HDFCLIFE 559
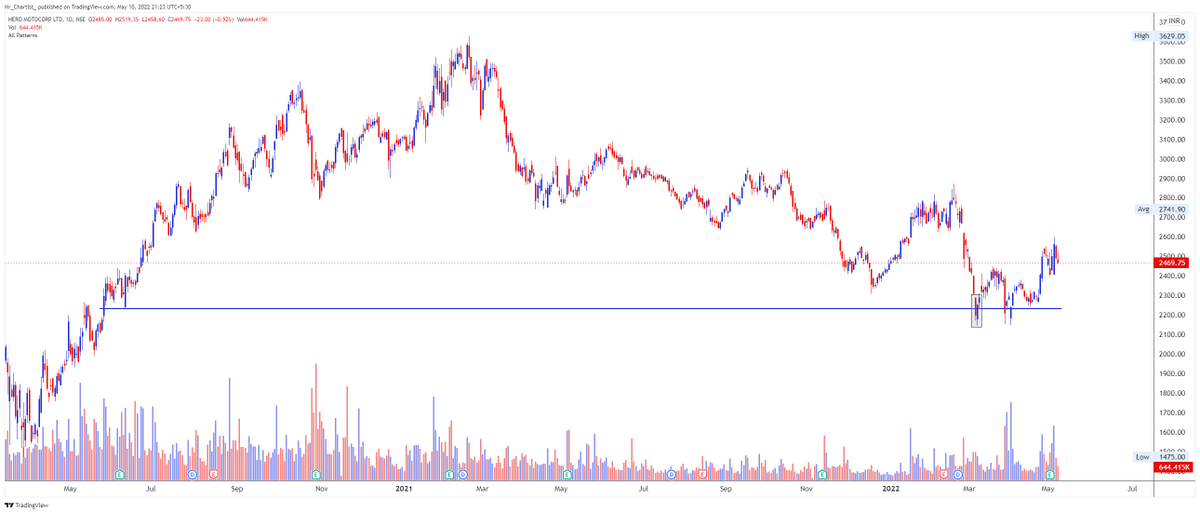
81. HEROMOTOCO 2469
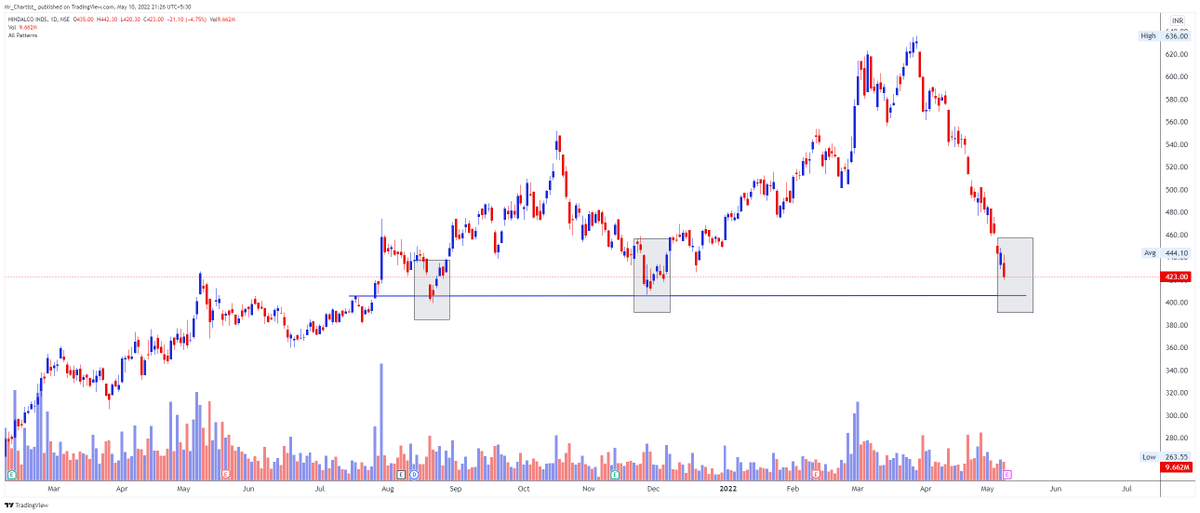
82. HINDALCO 423
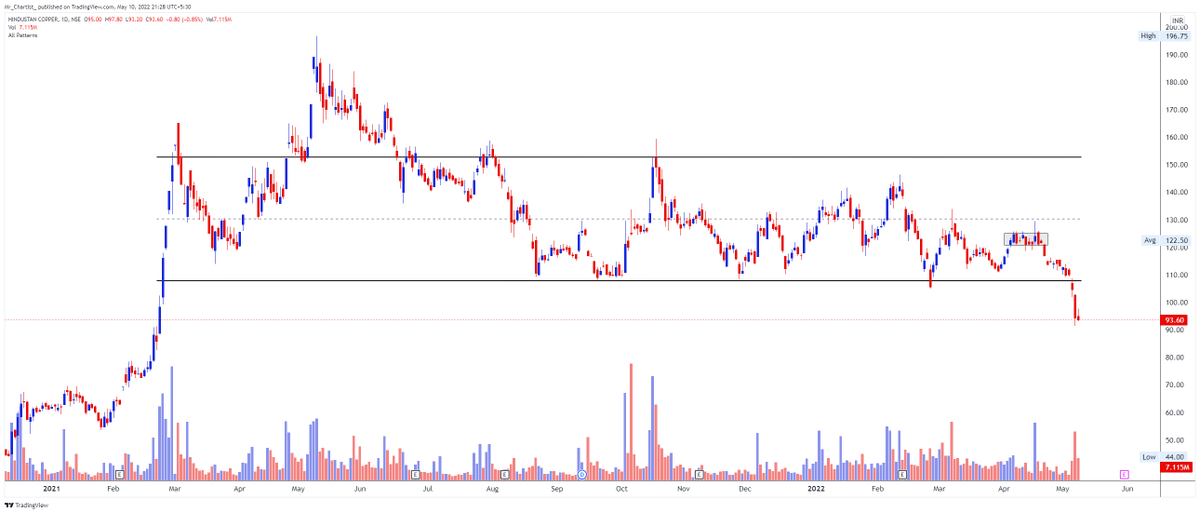
83. HINDCOPPER 93.60
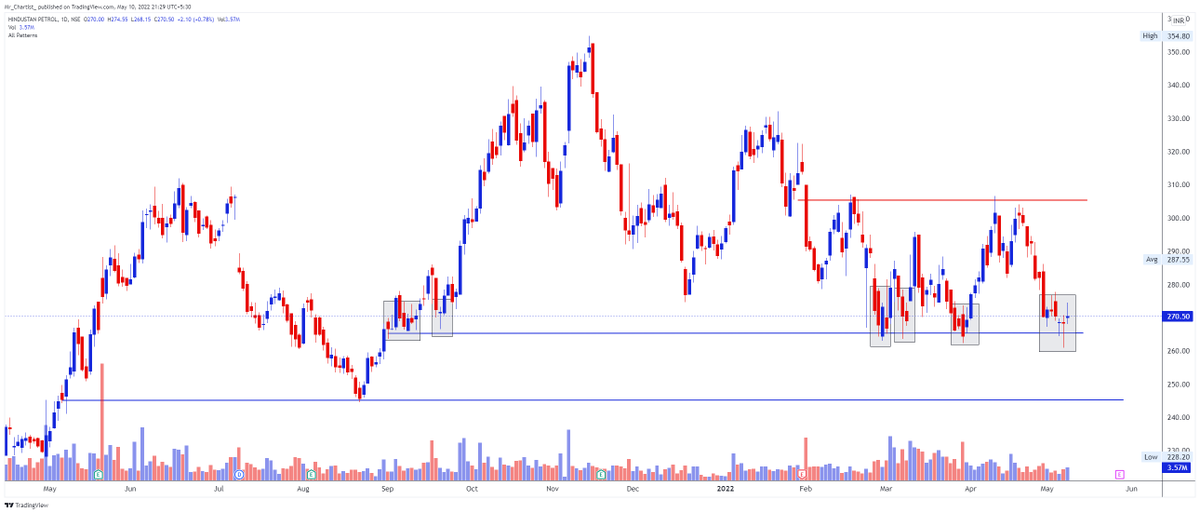
84. HINDPETRO 270
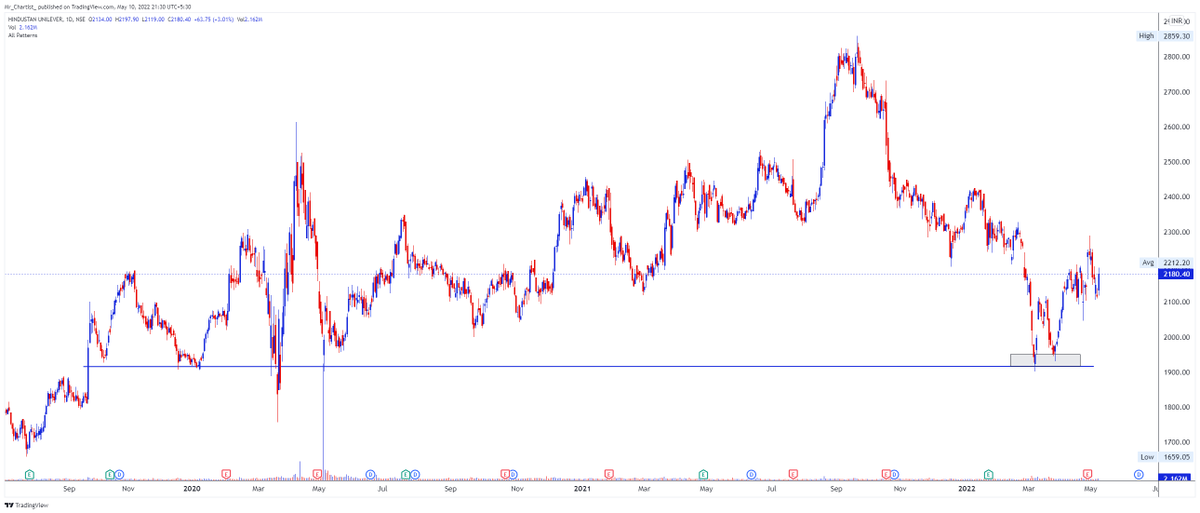
85. HINDUNILVR 2180
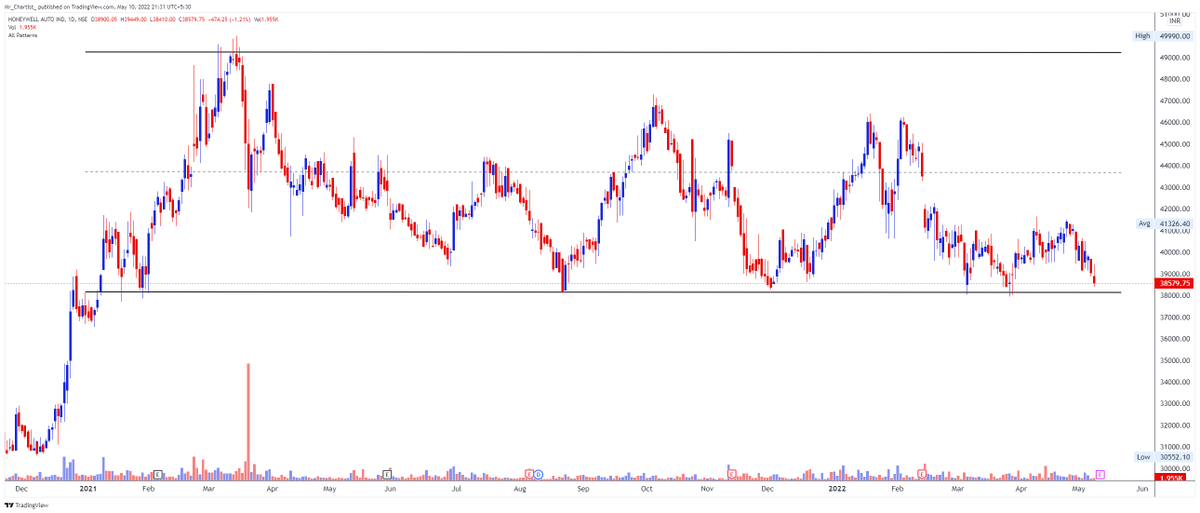
86. HONAUT 38579
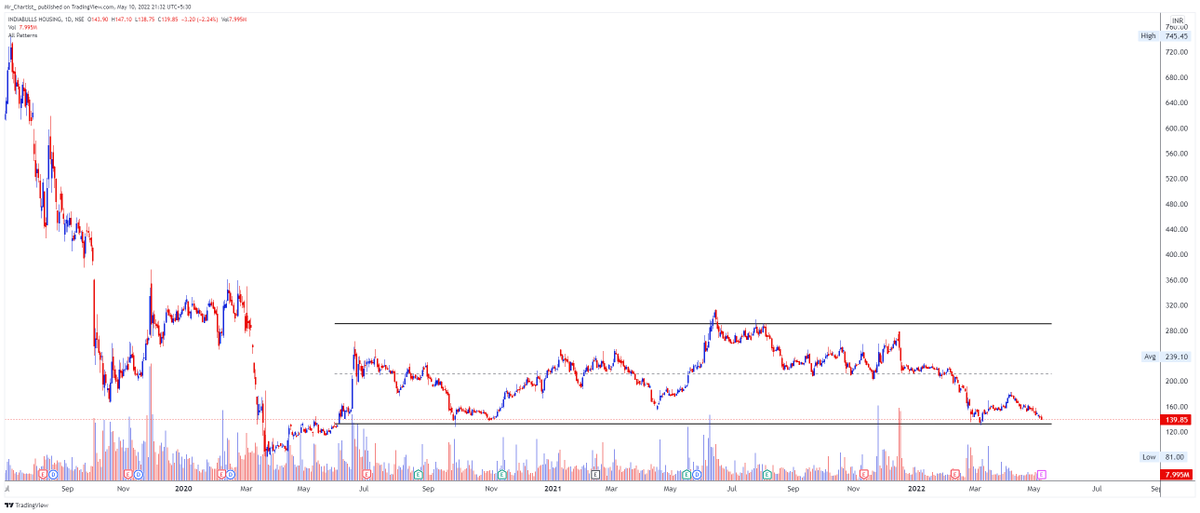
87. IBULHSGFIN 139
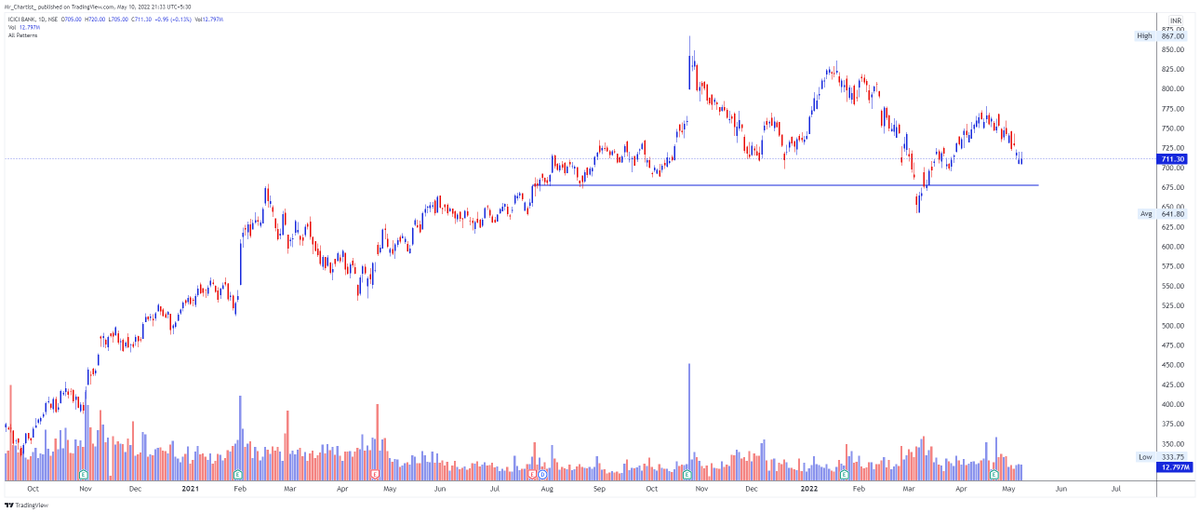
88. ICICIBANK 711
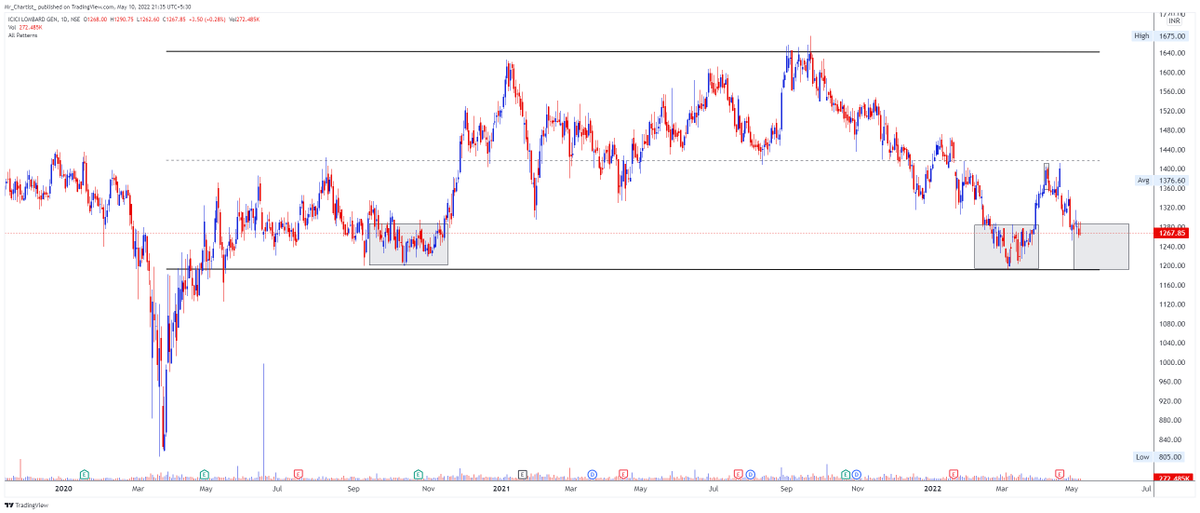
89. ICICIGI 1267
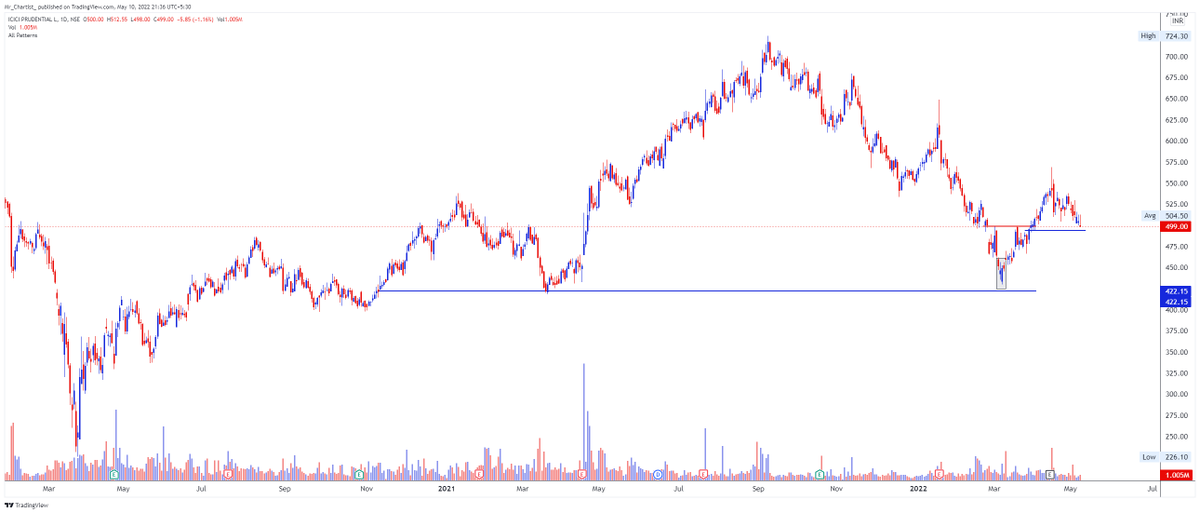
90. ICICIPRULI 499
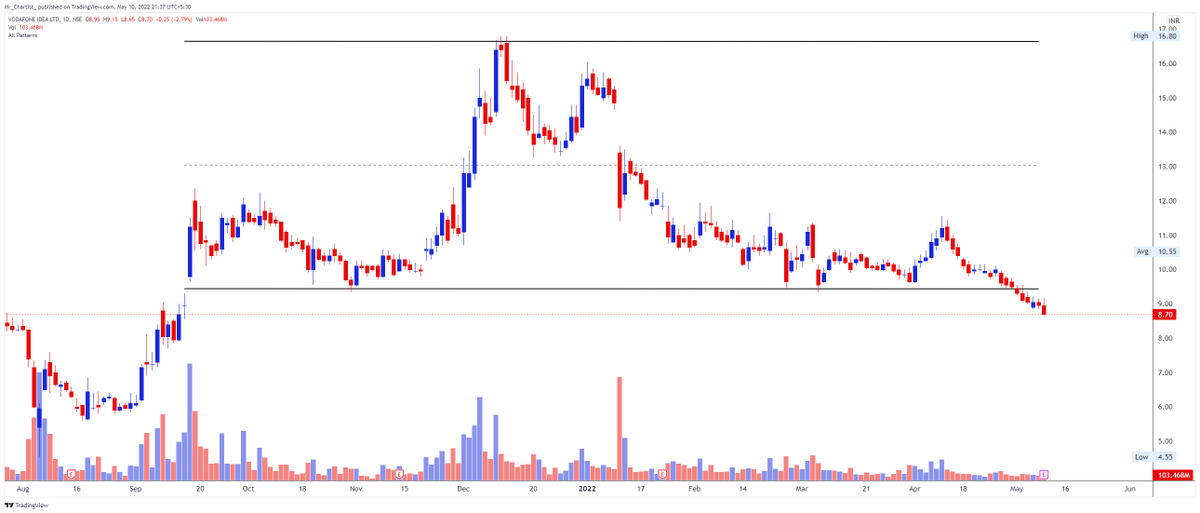
91. IDEA 8.70
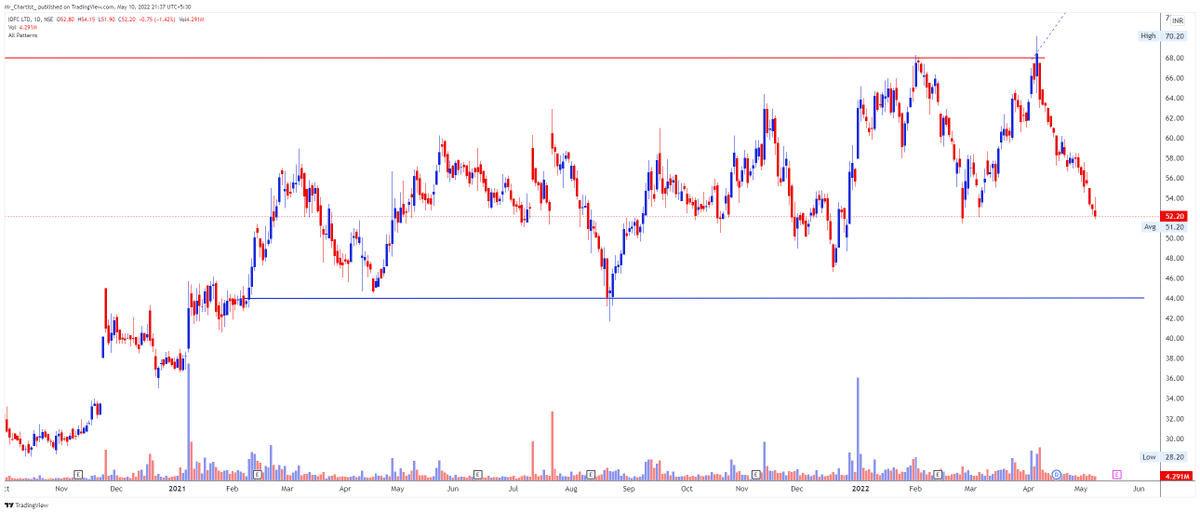
92. IDFC 52.20
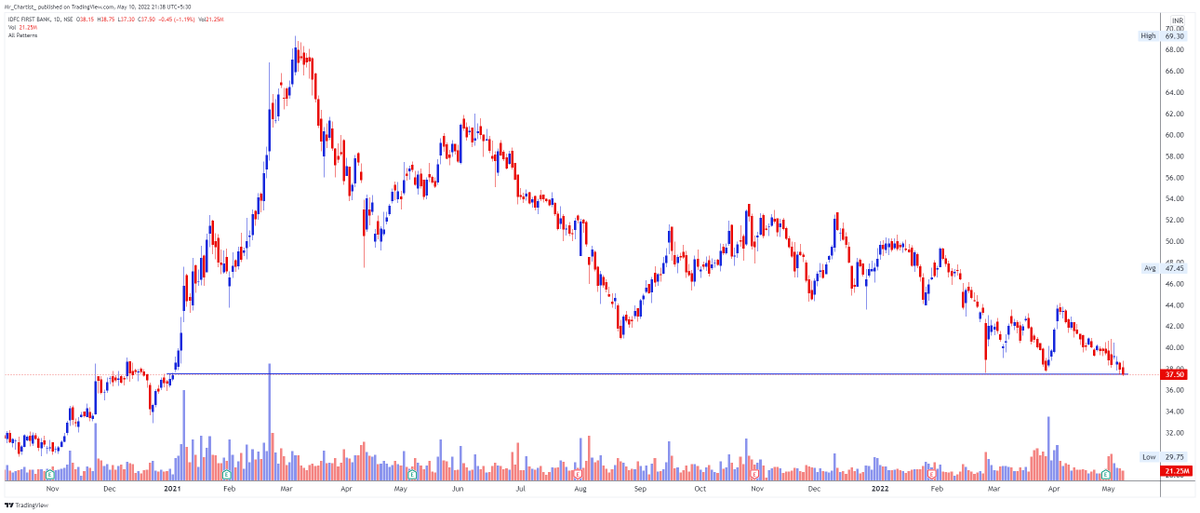
93. IDFCFIRSTB 37.50
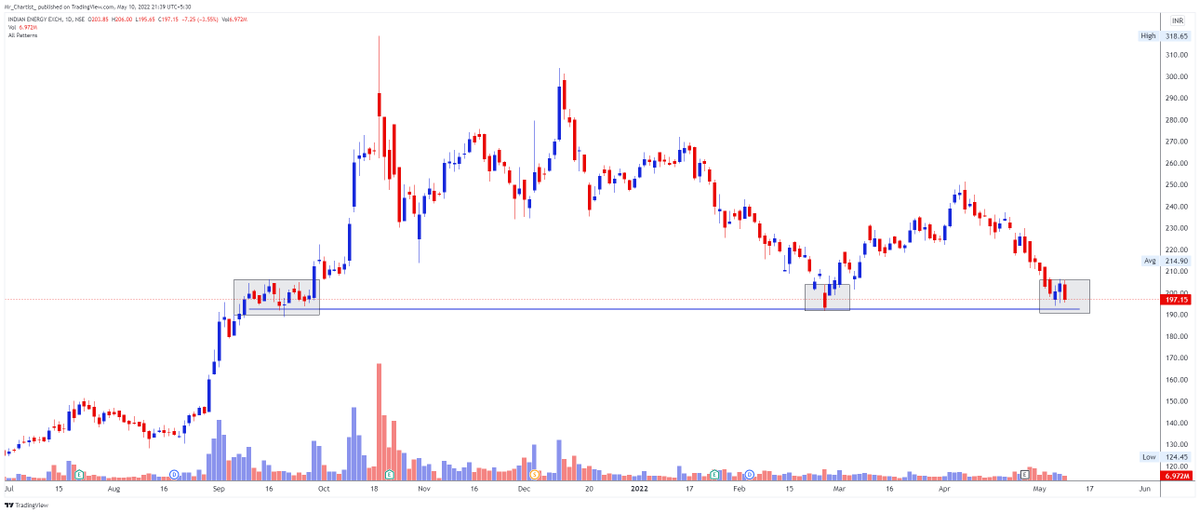
94. IEX 197
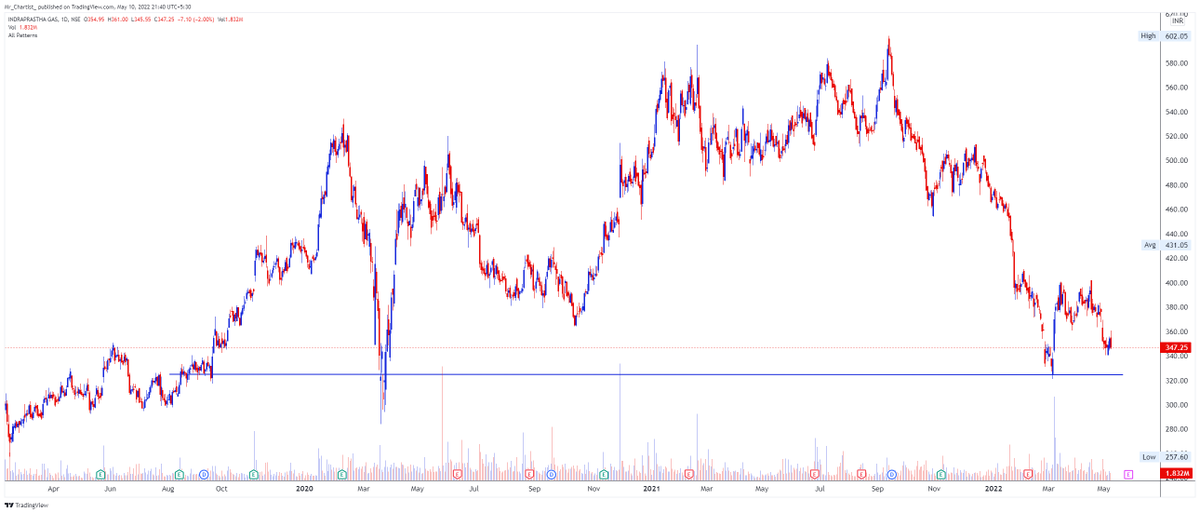
95. IGL 347.25
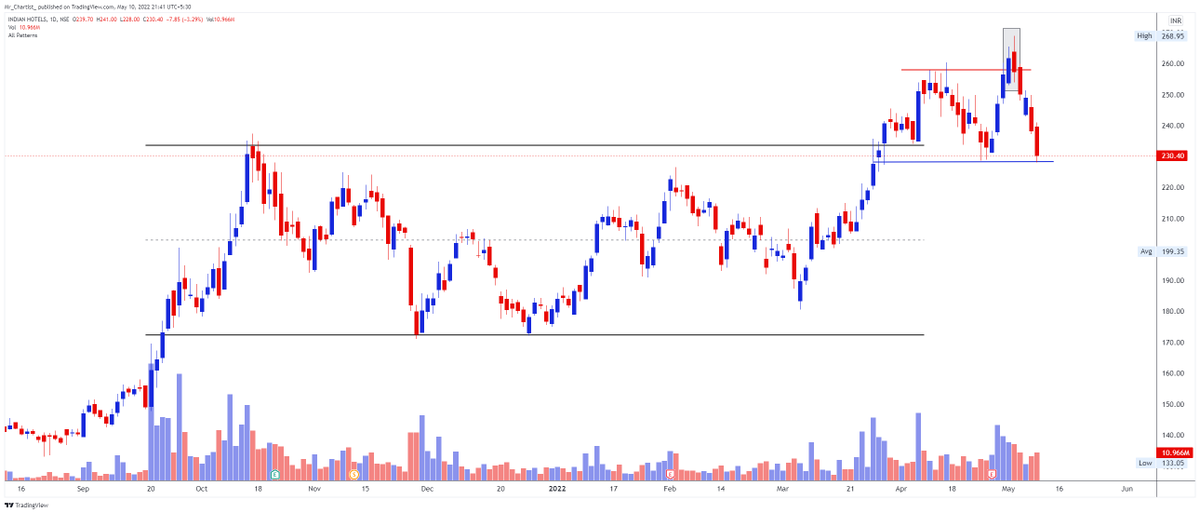
96. INDHOTEL 230.40
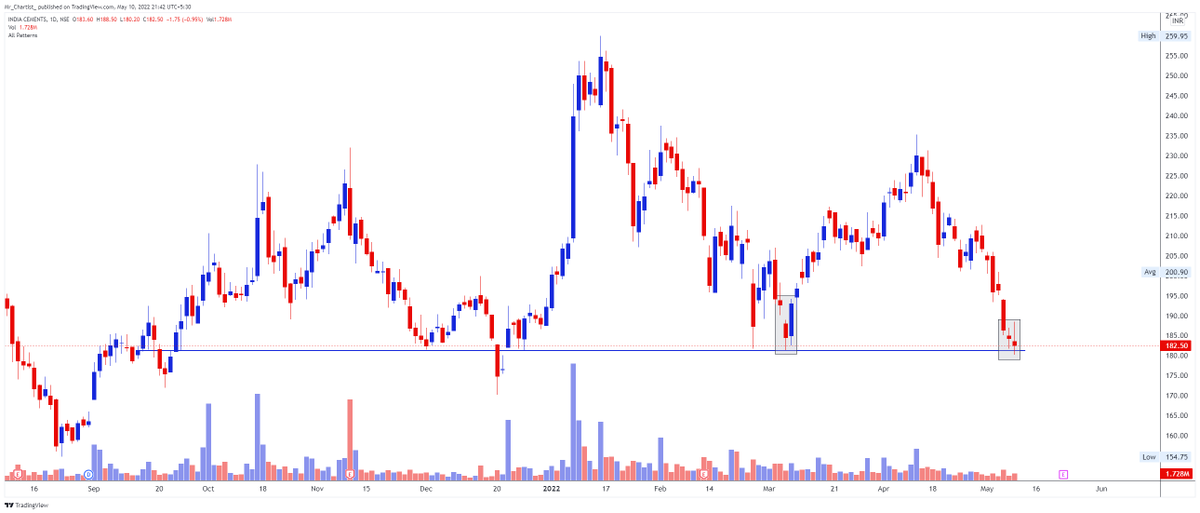
97. INDIACEM 182.50
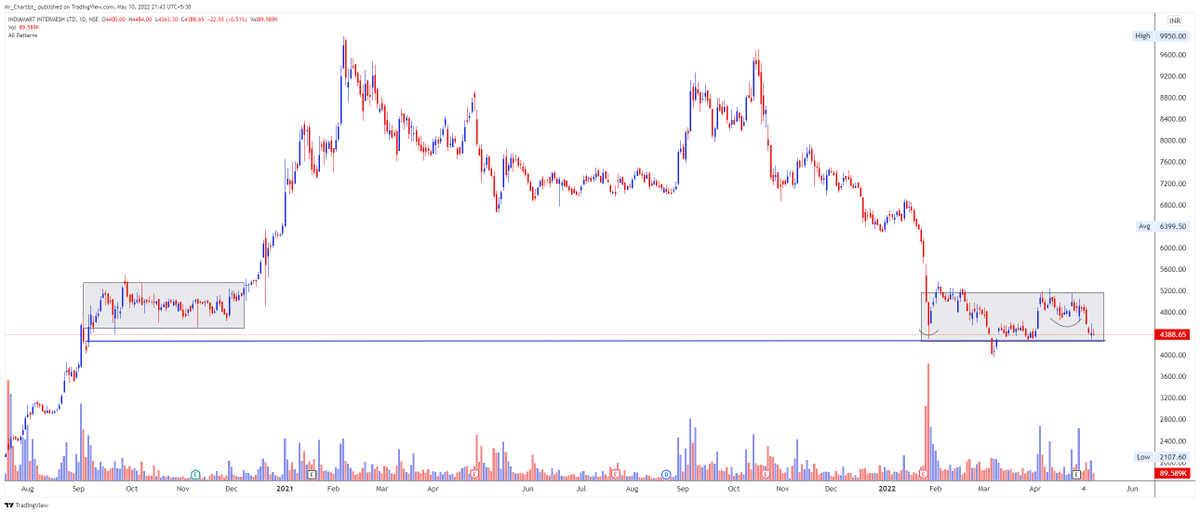
98. INDIAMART 4388
99. INDIGO 1630
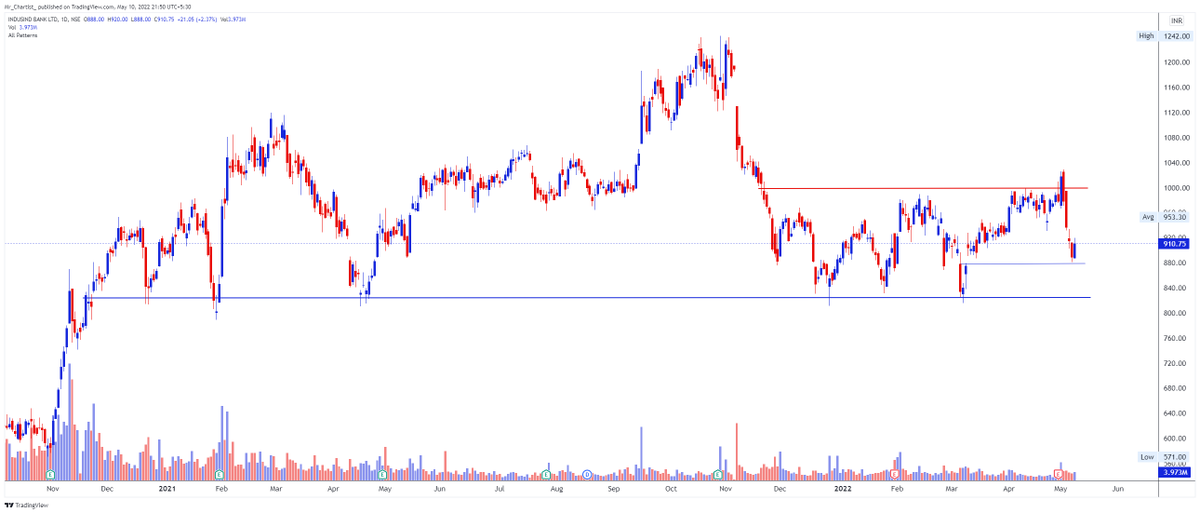
100. INDUSINDBK 910.75
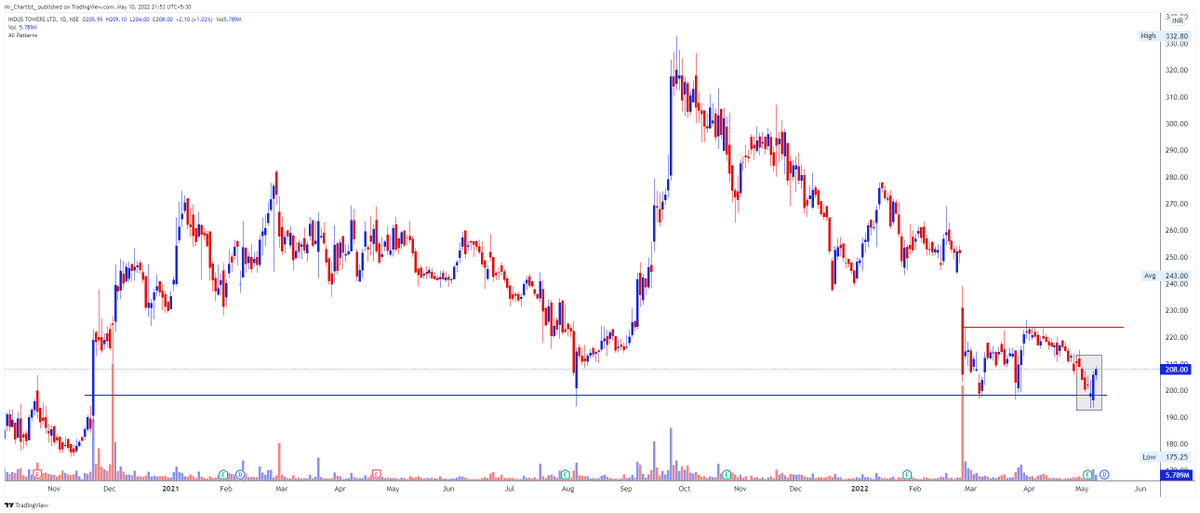
101. INDUSTOWER 208
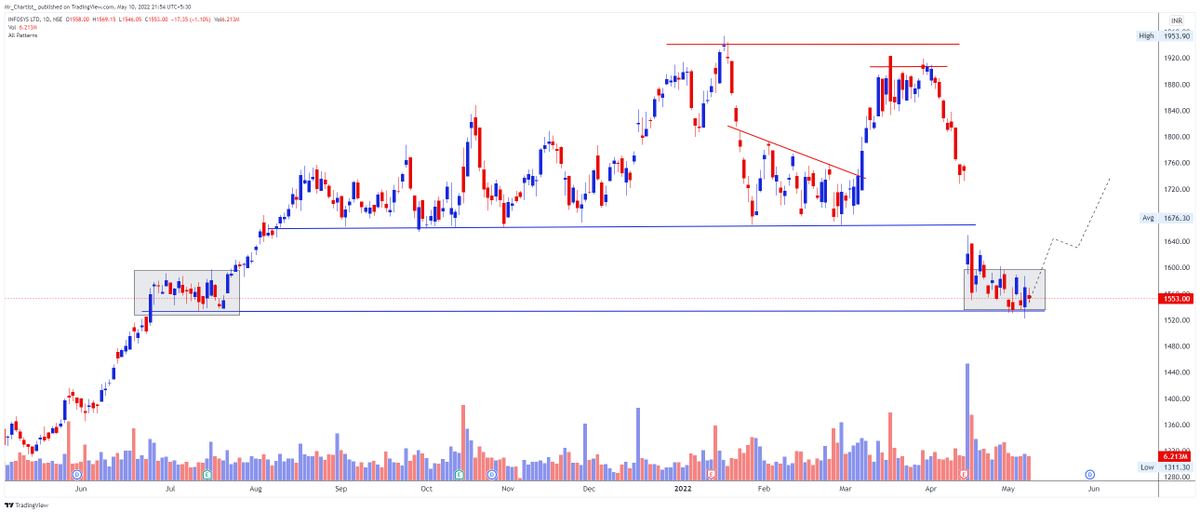
102. INFY 1553
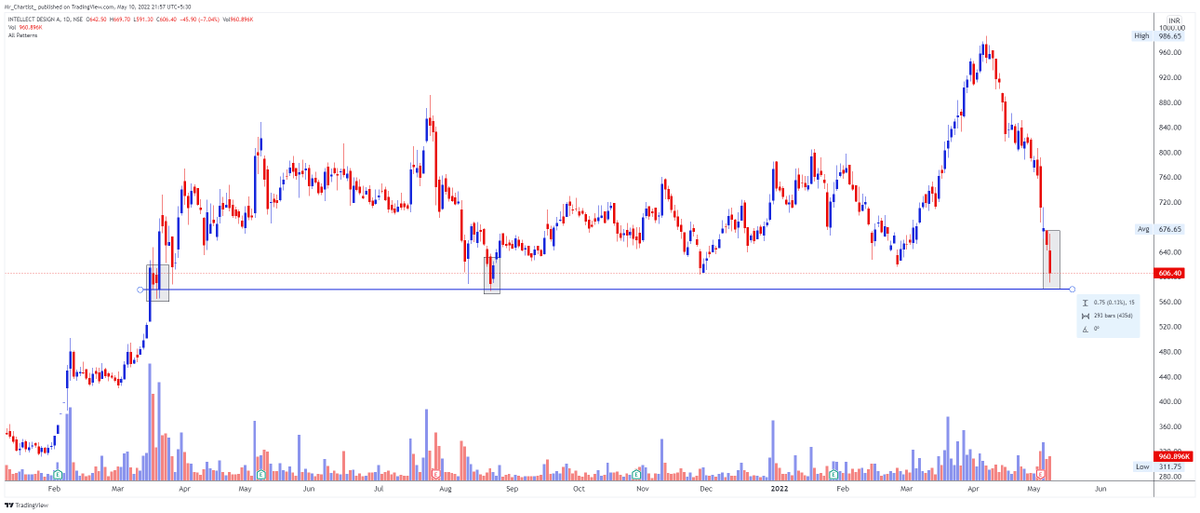
103. INTELLECT 606
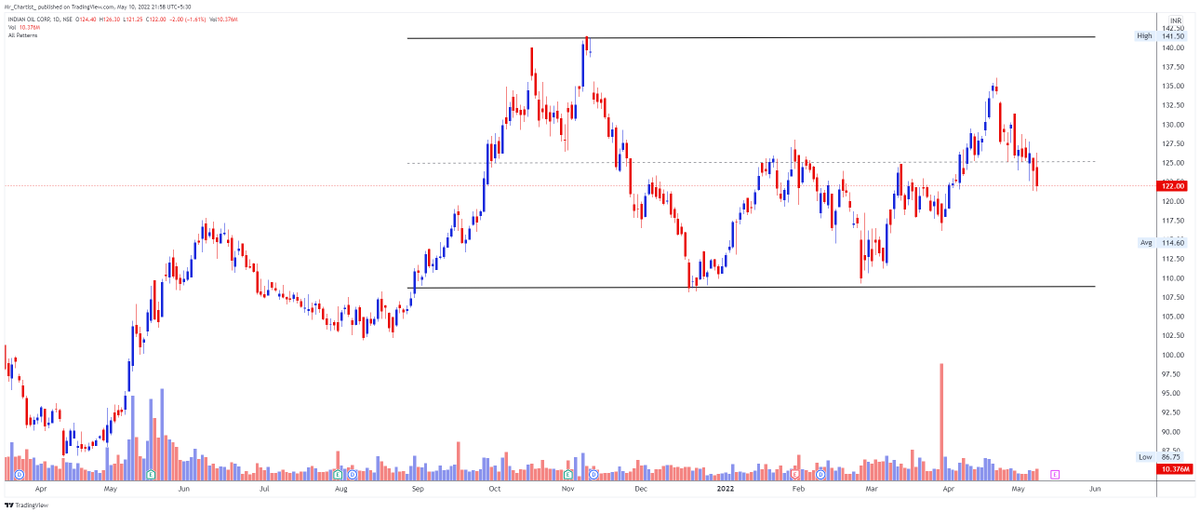
104. IOC 122.0
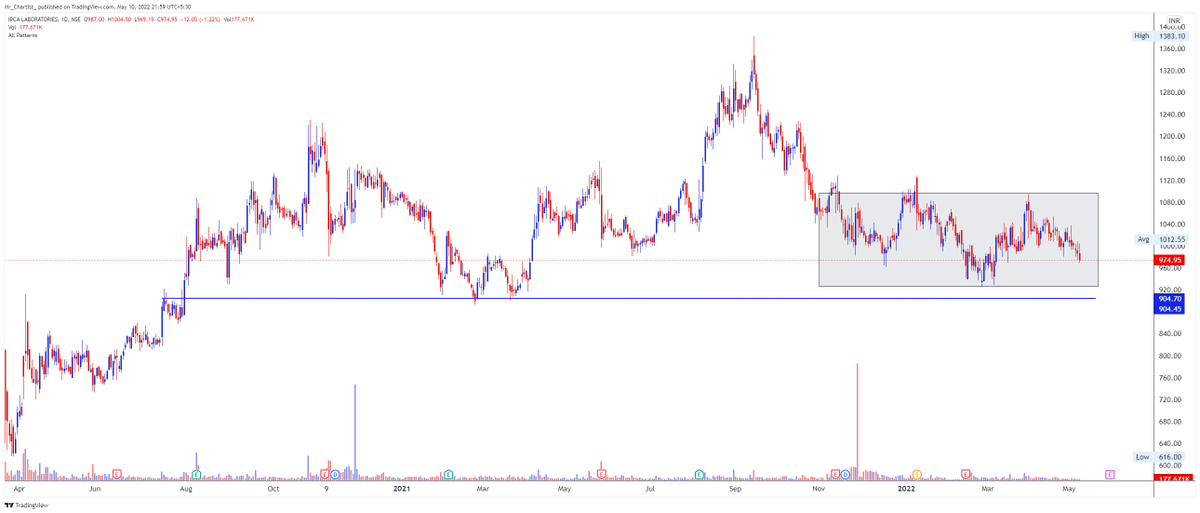
105. IPCALAB 974
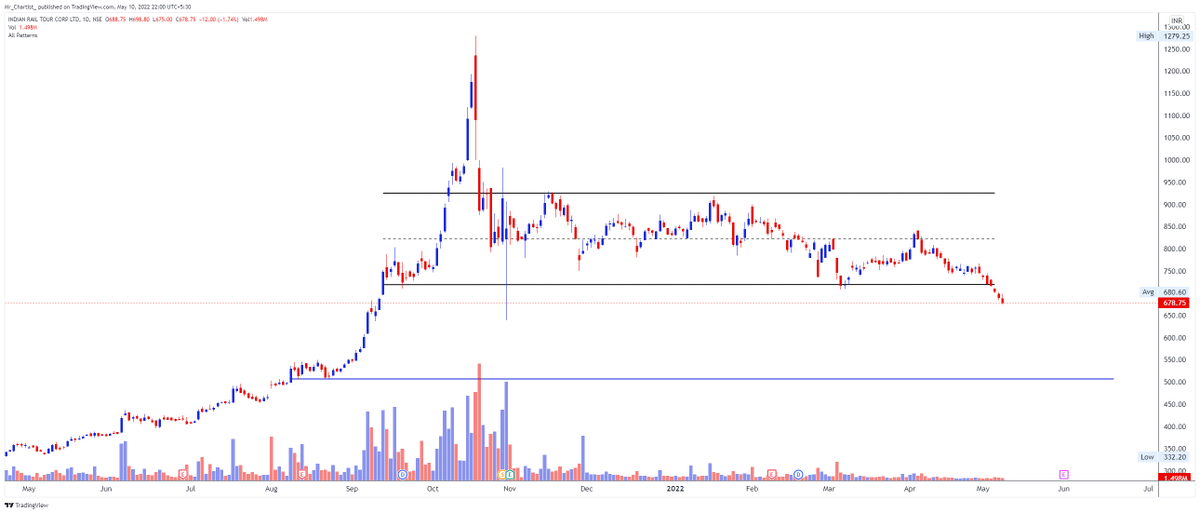
106. IRCTC 678
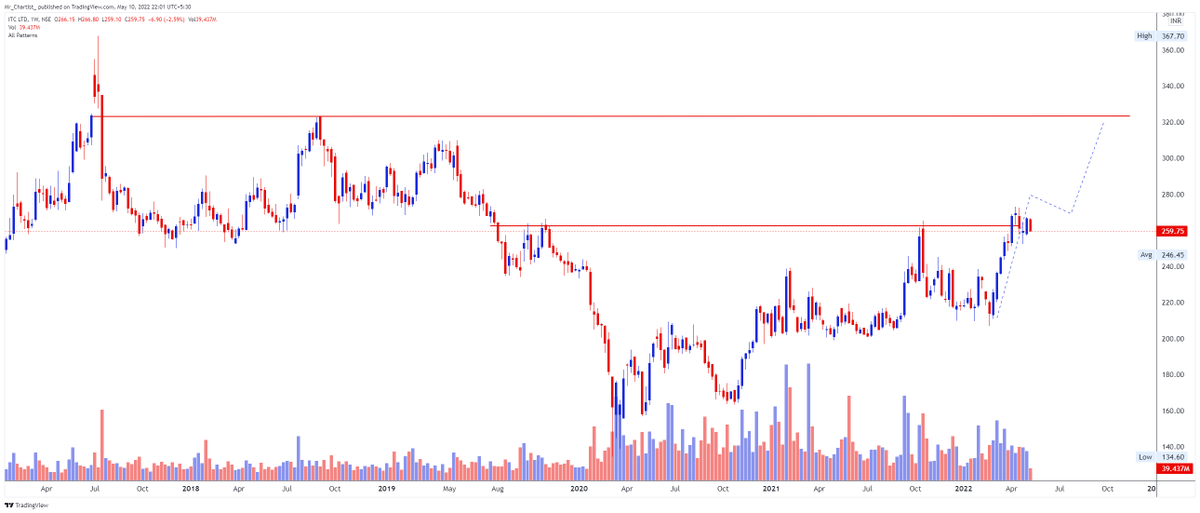
107. ITC 259.00
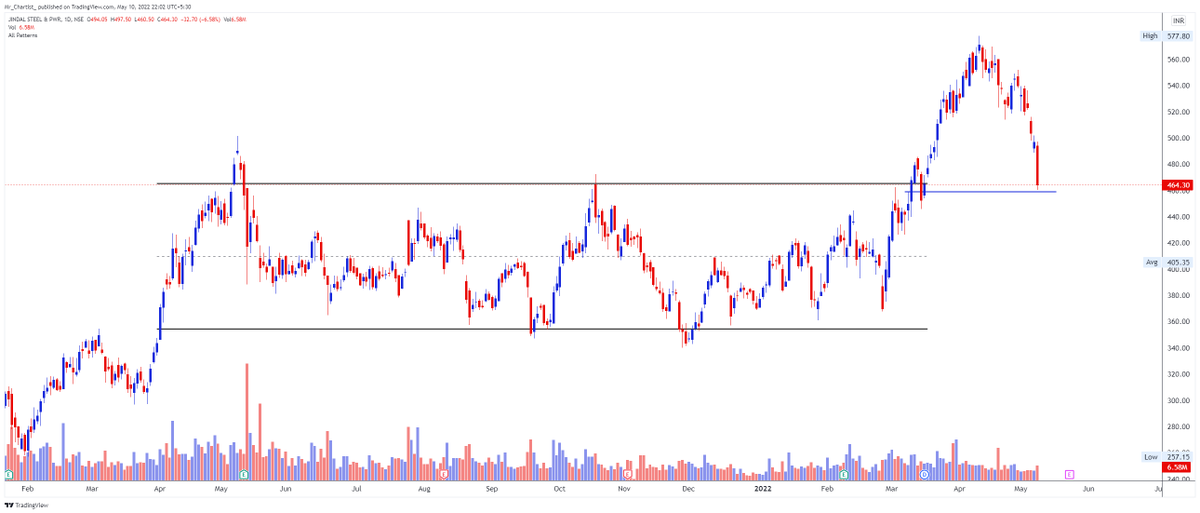
108. JINDALSTEL 464
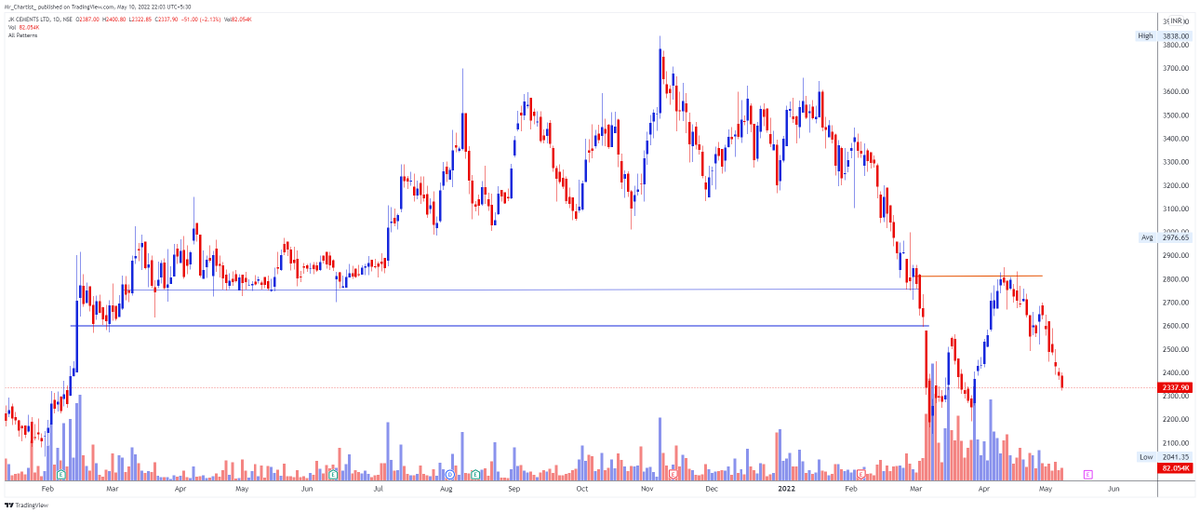
109. JKCEMENT 2337
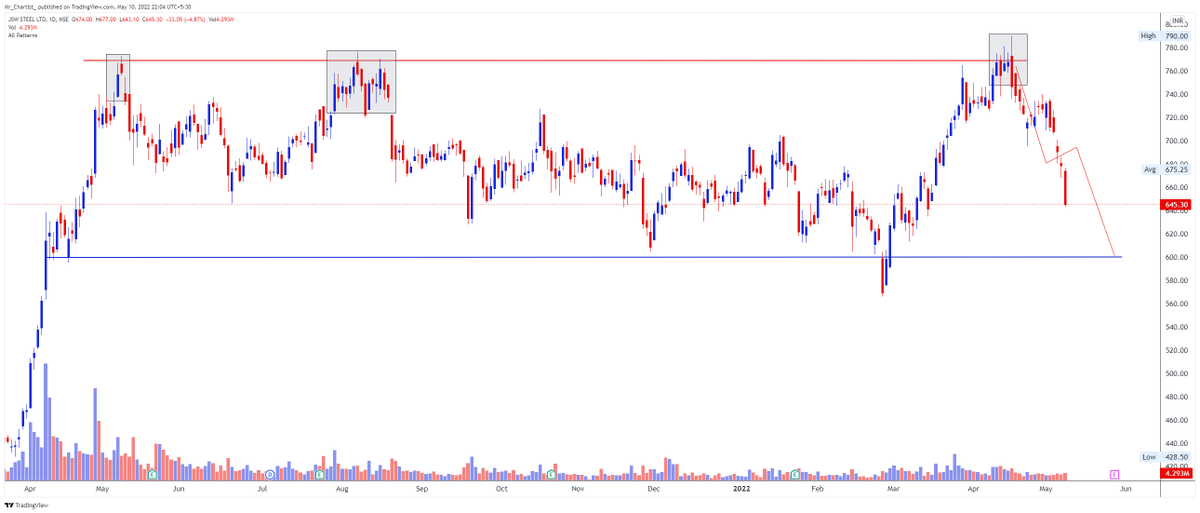
110. JSWSTEEL 645
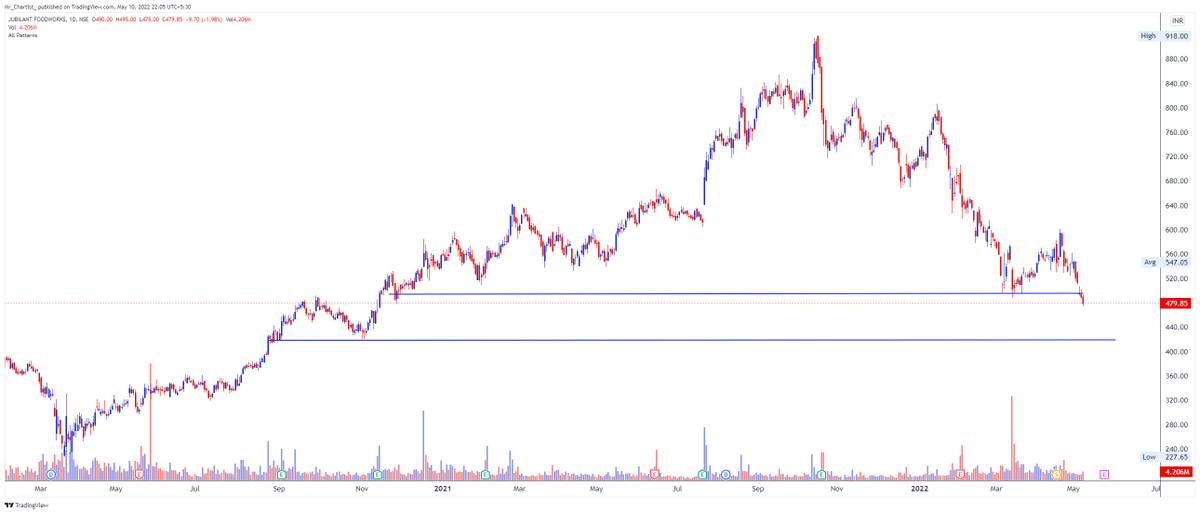
111. JUBLFOOD 479
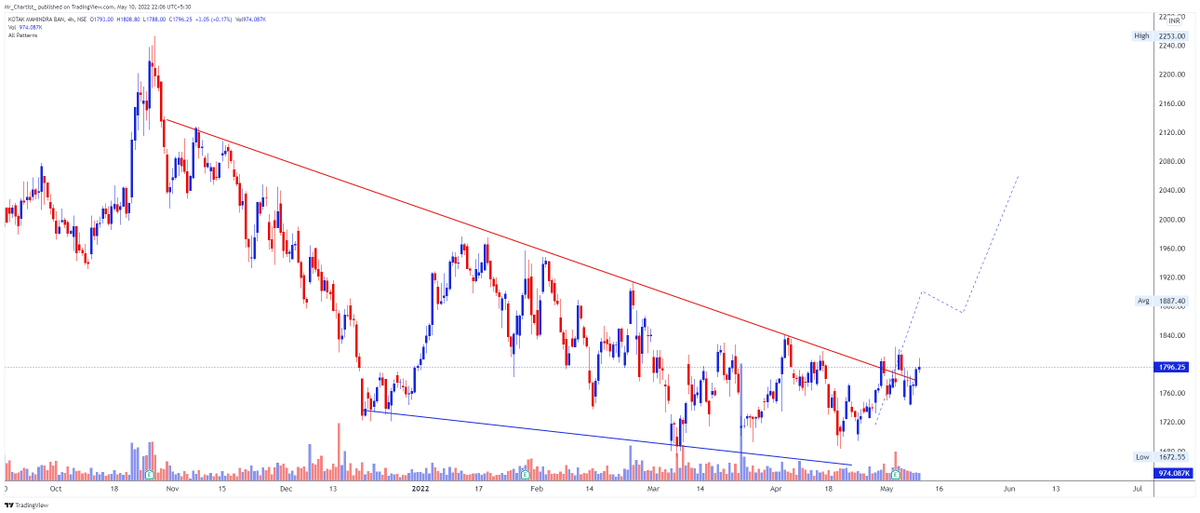
112. KOTAKBANK 1796
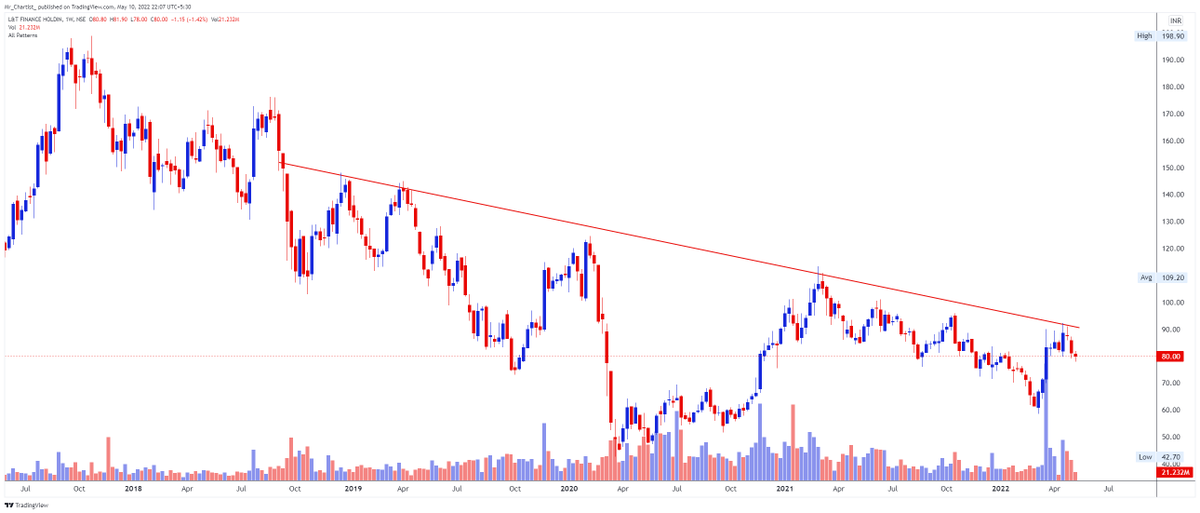
113. L&TFH 80.0
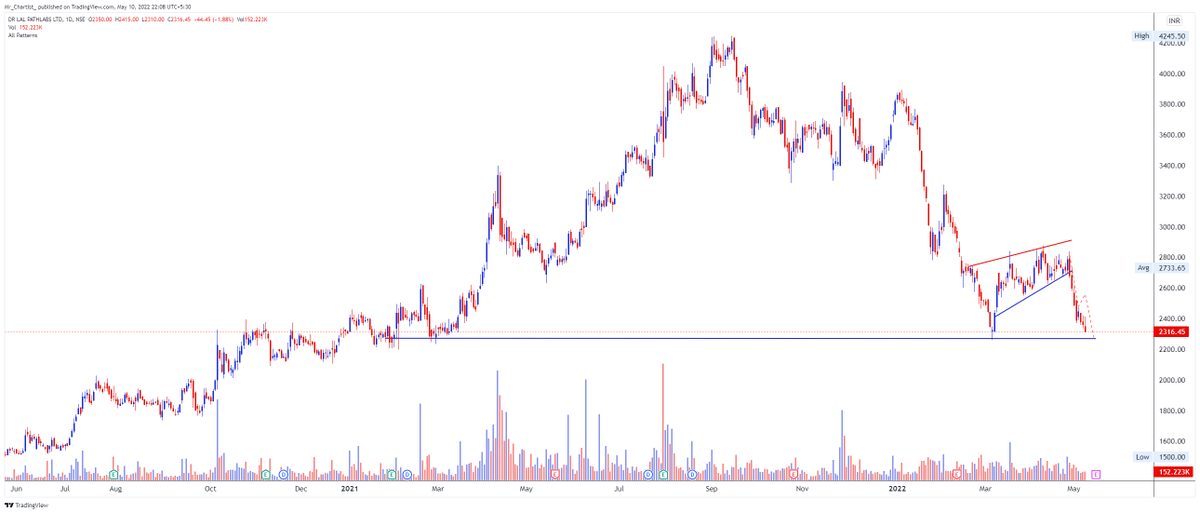
114. LALPATHLAB 2316
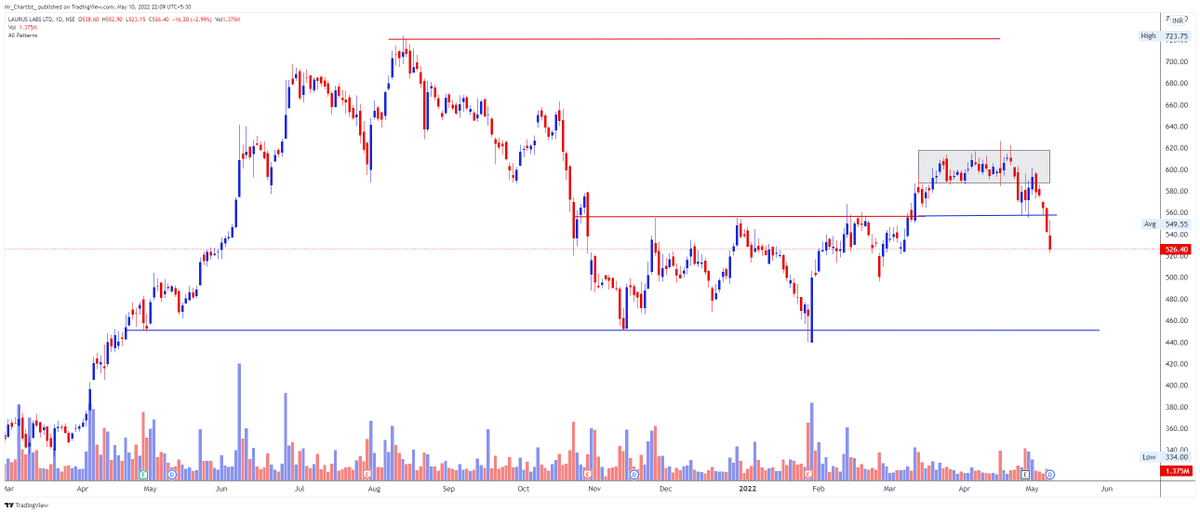
115. LAURUSLABS 526
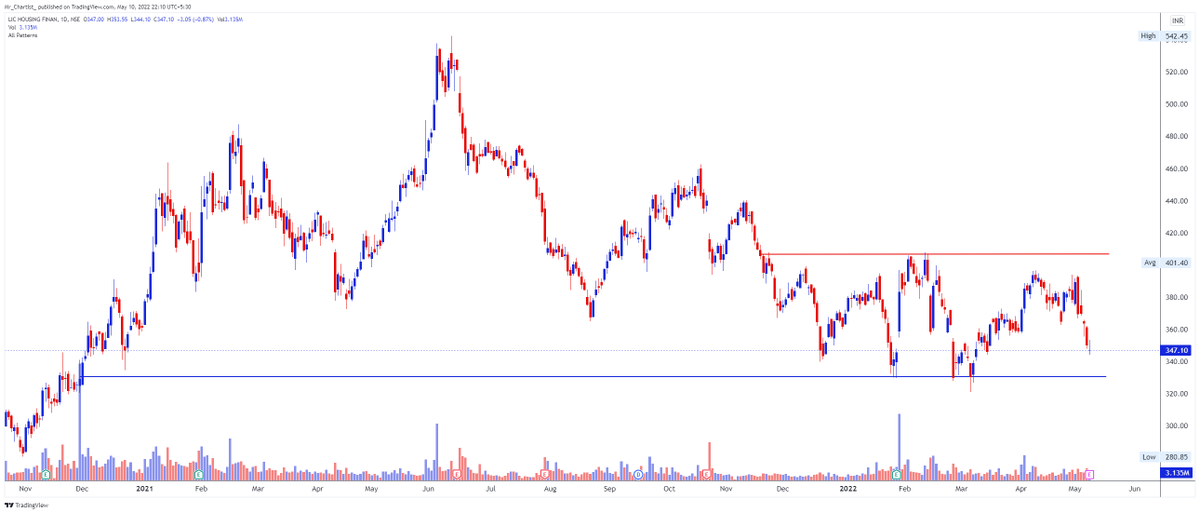
116. LICHSGFIN 347
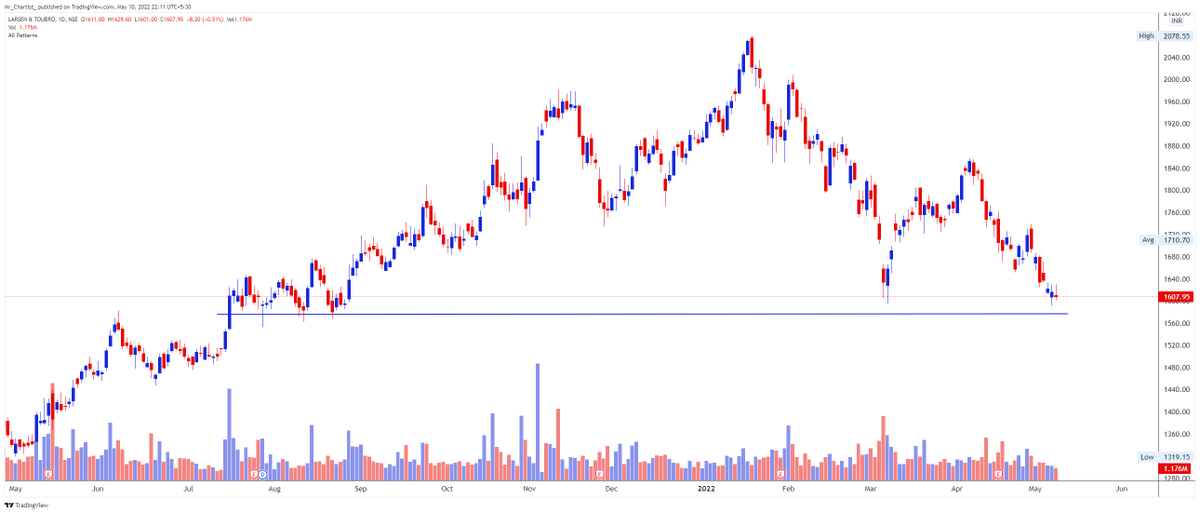
117. LT 1607
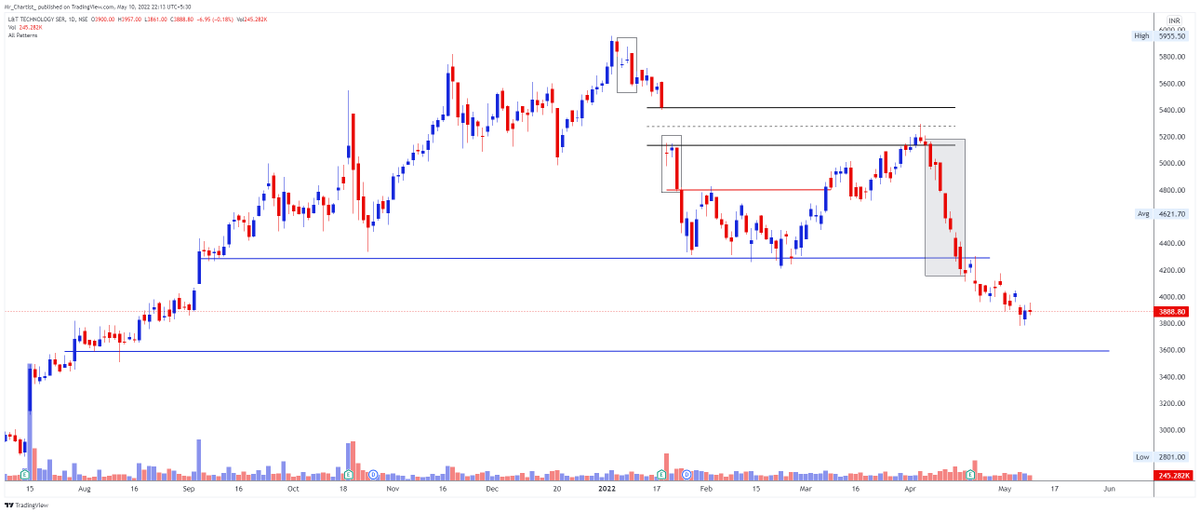
118. LTTS 3888
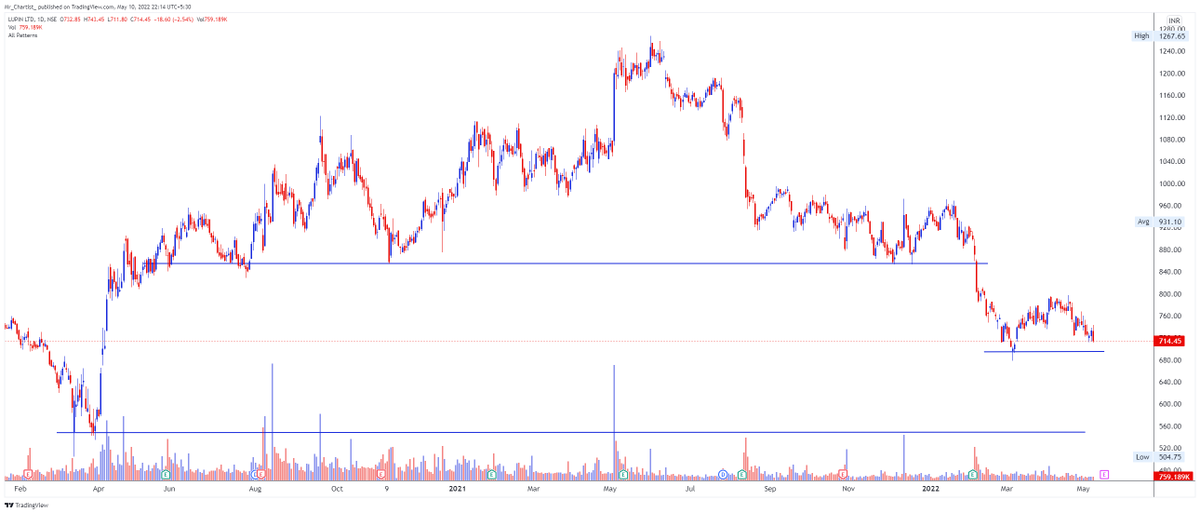
119. LUPIN 714
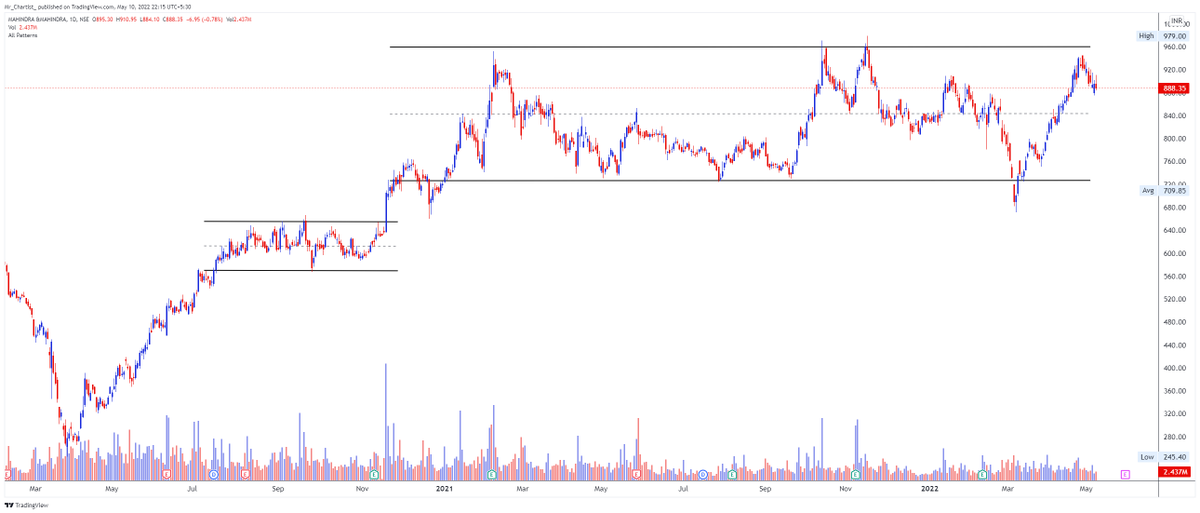
120. M&M 888
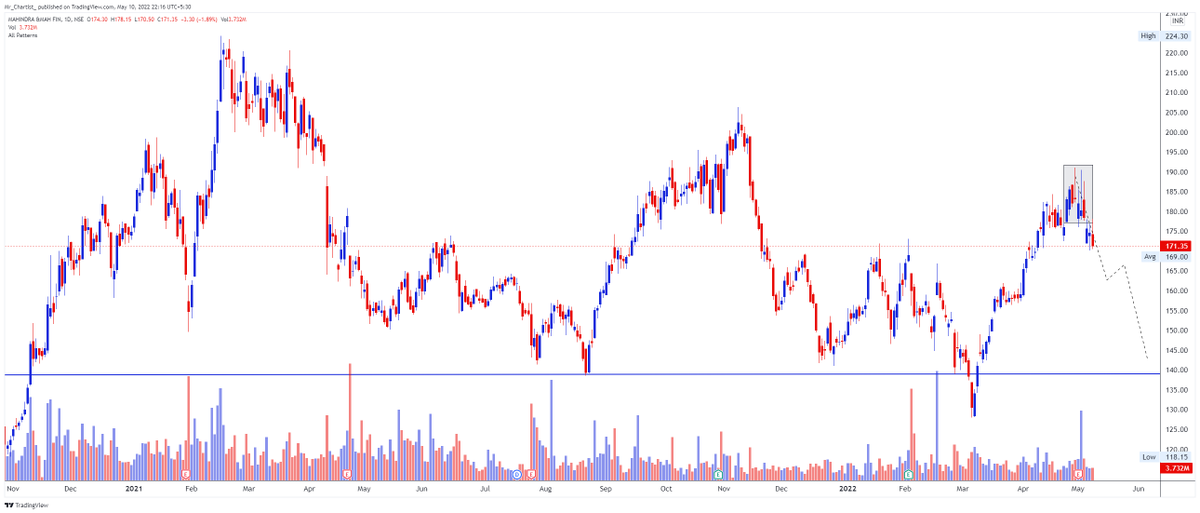
121. M_MFIN 171
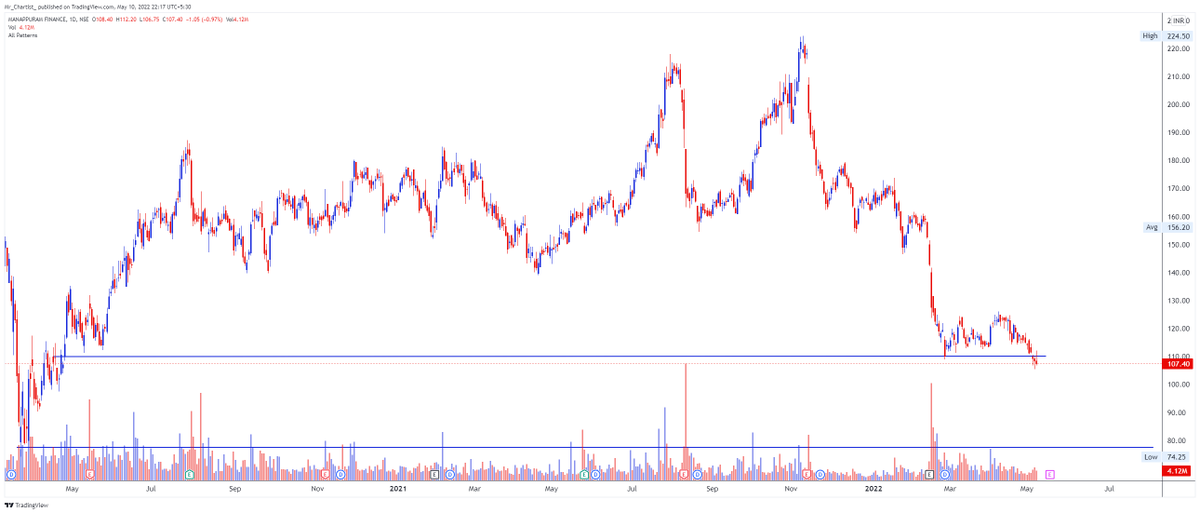
122. MANAPPURAM 107
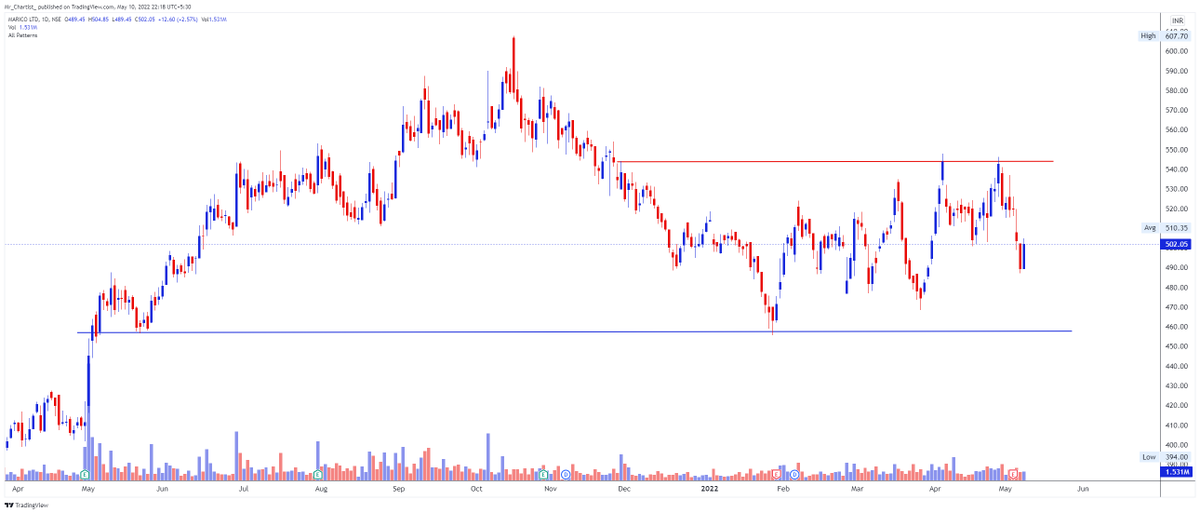
123. MARICO 502
Loading suggestions...