

Free Alpha
Stop guessing #Bitcoin bottom
Instead use some simple and easy to understand rules to figure out the most likely area for interim local bottom
Thread 🧵
Share it if you like it
Stop guessing #Bitcoin bottom
Instead use some simple and easy to understand rules to figure out the most likely area for interim local bottom
Thread 🧵
Share it if you like it
In order to identify potential bottom, you need to use Relative Strength Index & Moving Average Indicators
If you are new & not familiar with RSI & MA check some training videos on YouTube
If you are familiar with Technical Analysis follow these steps
……
If you are new & not familiar with RSI & MA check some training videos on YouTube
If you are familiar with Technical Analysis follow these steps
……
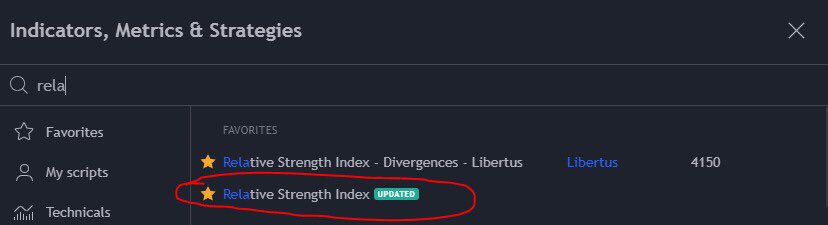
Open Bitcoin H4 (4 hours chart) on TradingView
Add RSI 14 (default) on the chart
Remember to use only TradingView default RSI indicator that says updated.
Add RSI 14 (default) on the chart
Remember to use only TradingView default RSI indicator that says updated.
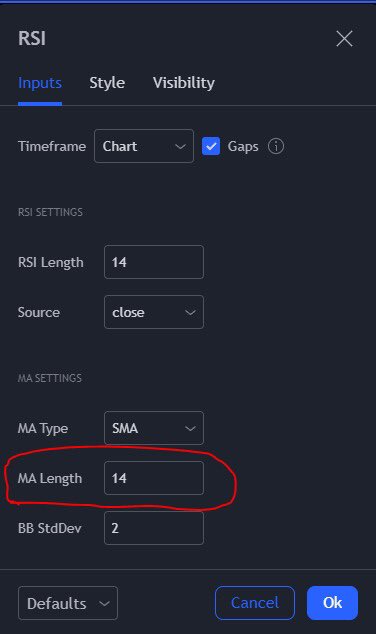
Now Add Moving Average on Top of RSI indicator. It’s inbuilt in the same indicator, just enable it & change value to 55
Click on settings for RSI indicator & make this change
Here is how it looks like
Click on style to enable it & inputs to change the value from 14 to 55
Click on settings for RSI indicator & make this change
Here is how it looks like
Click on style to enable it & inputs to change the value from 14 to 55
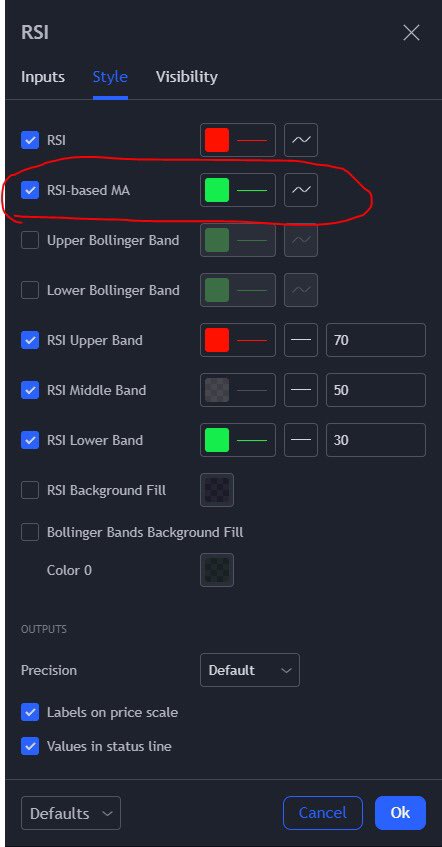
Now you can go to style and change the color for upper hand / lower band / middle band as well as RSI & MA values
I use RED for RSI & GREEN for MA. You can choose any color of your choice
This is how it will look if you use same colors
tradingview.com
I use RED for RSI & GREEN for MA. You can choose any color of your choice
This is how it will look if you use same colors
tradingview.com
Now let’s talk about the secret sauce. Now that you have the Bitcoin H4 chart in front of you with RSI and MA on RSI plotted, let’s talk about what we are looking for to find local interim bottom
An interim bottom can HOLD the price for sometimes & give 20-50% pump for Bitcoin
An interim bottom can HOLD the price for sometimes & give 20-50% pump for Bitcoin
In order to find bottom first we need strong bearish momentum
Let’s define what’s strongly bearish
If RSI value moves below 30 and tries to move up above 50 & fails to go above 50 & keeps falling back below 30 for extended period of time, that proves extremely bearish periods
Let’s define what’s strongly bearish
If RSI value moves below 30 and tries to move up above 50 & fails to go above 50 & keeps falling back below 30 for extended period of time, that proves extremely bearish periods
Let’s define the period. If Bitcoin moves below RSI 30 & keeps doing ping pong between 50 and 10 RSI for 5-7 days continuously & if price has fallen > 30% during last 1-2 weeks period, that can be termed bearish momentum & we can try to find interim bottom
Let’s see how it looks like on Bitcoin chart in current area
tradingview.com
tradingview.com
Now that we found the extremely oversold zone and bearish momentum, let’s find the clues on how to know when we are closer to an interim bottom
An interim bottom doesn’t mean final final bottom but it can support the price for sometime or it can be a final final bottom
An interim bottom doesn’t mean final final bottom but it can support the price for sometime or it can be a final final bottom
However in order to find the true final final bottom we prefer to use daily charts and a different method to confirm the bottom
This H4 method gives you 25-50% insta pumps once interim bottom confirms
So let’s talk about the method itself now
This H4 method gives you 25-50% insta pumps once interim bottom confirms
So let’s talk about the method itself now
After we find the bearish momentum based on H4 RSI oversold plus strong downside price move, let’s look for RSI Value to cross above 55 RSI MA
We need minimum 1 & ideally two candles where RSI value is above 55 RSI MA value
This is how it looks like
tradingview.com
We need minimum 1 & ideally two candles where RSI value is above 55 RSI MA value
This is how it looks like
tradingview.com
Once we get this crossover where RSI value crosses above RSI MA 55 Value, we can assume we are close to an interim bottom
Now check the recent price action and check if there was any extreme price action candle when we posted the recent low
There are two scenarios
Now check the recent price action and check if there was any extreme price action candle when we posted the recent low
There are two scenarios
Scenario 1
The dump to the recent low was organic and gradual and slow and steady
Scenario 2
The dump to the recent low was extremely fast and the recovery after that was also super fast. We dumped and pumped in same or next H4 candle & recovered most of the losses
The dump to the recent low was organic and gradual and slow and steady
Scenario 2
The dump to the recent low was extremely fast and the recovery after that was also super fast. We dumped and pumped in same or next H4 candle & recovered most of the losses
In case of scenario 1, price will almost always retest lows again and even break lows with an extra dump below that low to flush out leveraged longs
Set your buys near the lows or little lower < recent lows
This will be your interim bottom & price May stage a nice recovery
Set your buys near the lows or little lower < recent lows
This will be your interim bottom & price May stage a nice recovery
In case of scenario 2 price may or may not go back to retest the lows. If the recovery was too fast during the dump candle, price May stop on FIBONACCI 61.8 / 78.6 area and bounce again
So check which scenario is relevant based on price action during the recent low candle
So check which scenario is relevant based on price action during the recent low candle
In case of scenario 2, you might need to consider entering early vs waiting for recent lows bottom retest
61.8 Fibonacci from recent low to recent high can be a good entry with laddered buys lower
61.8 Fibonacci from recent low to recent high can be a good entry with laddered buys lower
In terms of stop loss, you need to use small distance from recent lows. 3-5% should be enough if you are entering near the lows or below the lows
In terms of stop loss for scenario 2, you may consider stops below Fibonacci 78.6
In terms of stop loss for scenario 2, you may consider stops below Fibonacci 78.6
In terms of targets, make it dynamic. Simply follow the counter up trend now
Wait for H4 RSI to go above 70 for minimum 1 candle
Once that’s done, wait for H4 RSI value to cross down H4 RSI 55 EMA value
Once the cross down happens, you are closer to a local top, Time to EXIT
Wait for H4 RSI to go above 70 for minimum 1 candle
Once that’s done, wait for H4 RSI value to cross down H4 RSI 55 EMA value
Once the cross down happens, you are closer to a local top, Time to EXIT
This logic will remove all emotions, all stress, all guessing games as to where is the bottom
As I said this may or may not be a final final bottom but good enough to give you nice gains on the lower zone since you are using dynamic target trailing
This is relevant for bitcoin
As I said this may or may not be a final final bottom but good enough to give you nice gains on the lower zone since you are using dynamic target trailing
This is relevant for bitcoin
I can write a different thread on how to find a final final bottom for bitcoin using other methods on daily chart
You can visually backtest this logic during past dumps
If you like such threads, pls like it & share it with others 🙏
You can visually backtest this logic during past dumps
If you like such threads, pls like it & share it with others 🙏
Loading suggestions...