

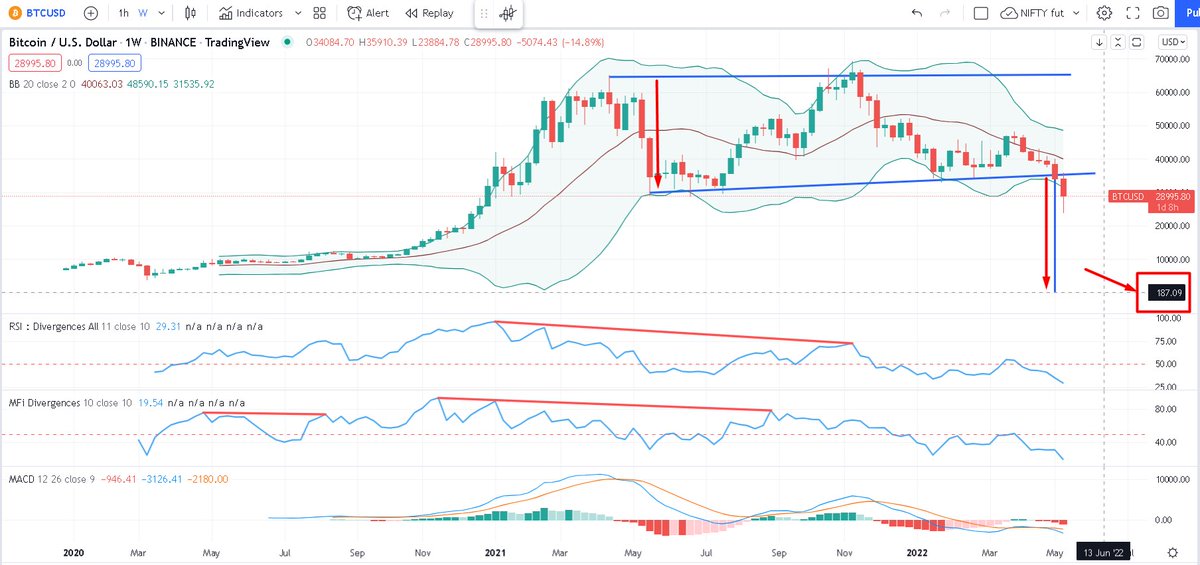
Since I am a firm believer in technical analysis, this is what I see on bitcoin2. You may differ if you are not a believer. As long as bitcoin trades below 29k, the following scenario is what is projected by the charts. View invalidated on two weekly closings > 29k
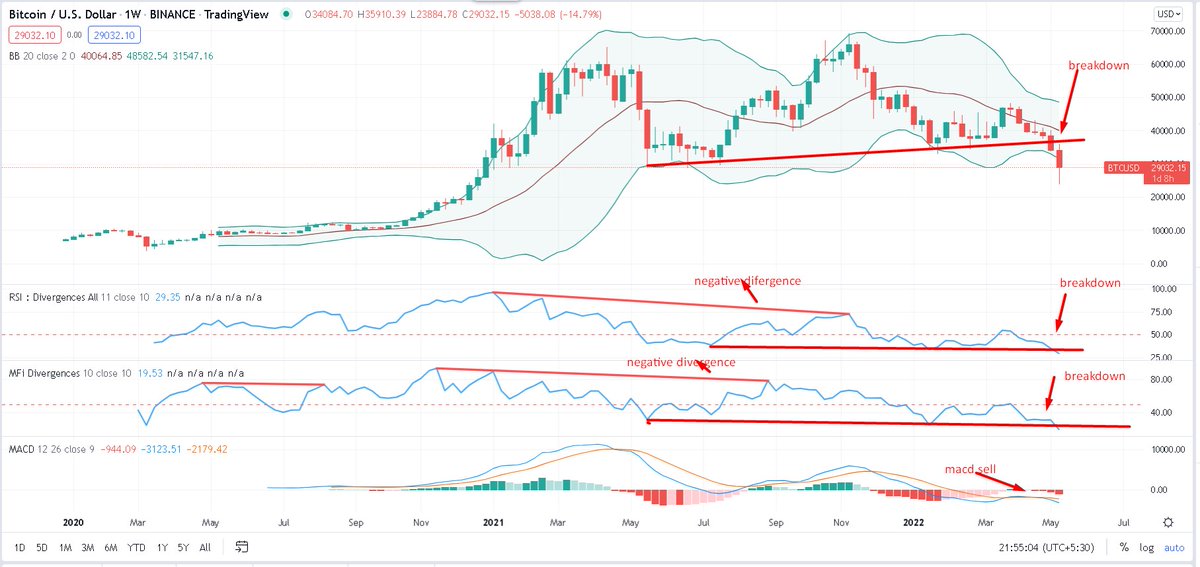
This is the chart. Do note the narrowing of the Bollinger Bands, this is symptomatic of a large move. Charts are suggesting a major breakdown
And here comes the pattern targeting. Targeting time should be 1/3rd of the time used in creating this pattern, so give or take 6 months max.
Again, this analysis is invalidated on two closes of bitcoin > 29k
Again, this analysis is invalidated on two closes of bitcoin > 29k
This is my bread and butter template which has server me over the years. You have seen me using this template time and again in analysing everything from the indices to stocks.
RSI uses momentum, MFI uses volume, MACD for trend, BB for volatility. TA does not need anything else
RSI uses momentum, MFI uses volume, MACD for trend, BB for volatility. TA does not need anything else
I hope cryptobros get enough riled up over the night to make this a viral tweet by tomorrow 🤣🤣
GN
GN
Loading suggestions...