

✍️✍️Free strategy and explanation
The best way to trade any market is understanding its trend direction.
Best way to understand uptrend and trade it
Thread
The best way to trade any market is understanding its trend direction.
Best way to understand uptrend and trade it
Thread
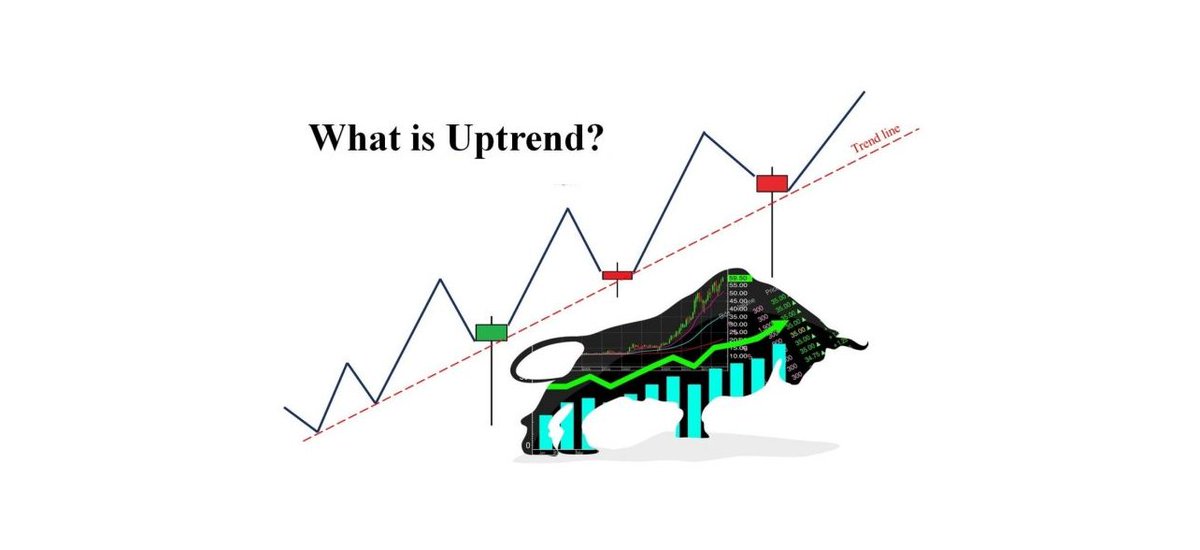
1) What is uptrend? How to define an uptrend and some super classic examples.
2 signals and 3 safe trading strategies with high accuracy in an upward rtrend.“80% of the time, the market goes sideways.
2 signals and 3 safe trading strategies with high accuracy in an upward rtrend.“80% of the time, the market goes sideways.
And all professional traders focus on the remaining 20% when the market enters a trend. It is simply because there is a trend, there is money.” To make things easier to understand, all you need to do is to wait for the market to confirm the trend.
Then, focus on finding safe entry points. An uptrend is a bullish trend in the market. Prices will continuously increase over a certain period of time. They create higher peaks after peaks and higher troughs after troughs.
The following peak is higher than the previous peak. Peak (2) is higher than peak (1). Peak (3) is higher than peak (2), and peak (4) is higher than peak (3).
The following trough is higher than the previous trough.
The following trough is higher than the previous trough.

Trough (B) is higher than trough (A). Just like that, the price will increase as the troughs get higher gradually.
These are the two most basic signs for you to identify a market’s uptrend. When the price exceeds a peak, it will inevitably create a new higher one.
These are the two most basic signs for you to identify a market’s uptrend. When the price exceeds a peak, it will inevitably create a new higher one.
Your job is to wait for the market to confirm a new trough which is higher than the old one. If this happens, you can claim that an uptrend has been created.
What is a trendline? Trendline is a trend line. In an upward trend, the trendline is a straight line connecting troughs. It acts as a support line for the market. And when the price touches the trendline, it will bounce back.
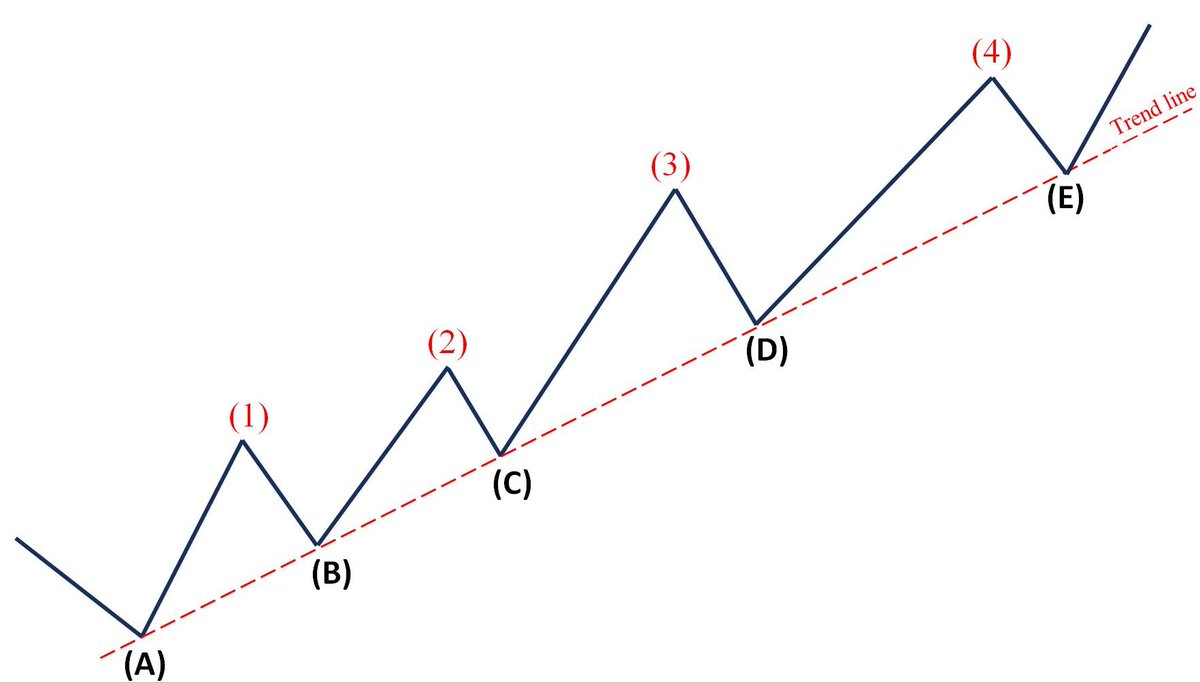
In an uptrend, you just need to draw a straight line connecting 3 troughs together. So, we have a bullish trendline. This is considered the most perfect case.
Signal 1: The price is moving sideways, then it breaks out of the resistance and rises => Peak (2) in the future will definitely be higher than peak (1).
Signal 2: The price retests the recently passed resistance and then rebounds => It creates trough (B) higher than trough (A).
Signal 2: The price retests the recently passed resistance and then rebounds => It creates trough (B) higher than trough (A).
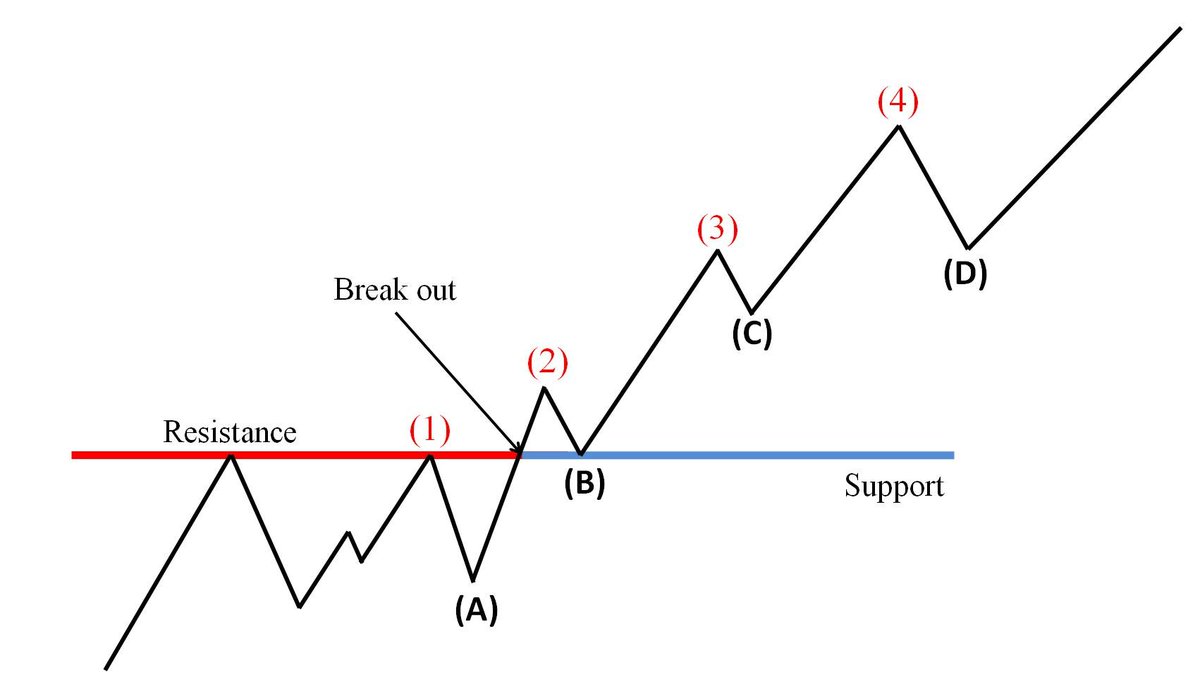
The market goes sideways in a certain period of time. It then breaks out of the resistance and rises sharply, creating an uptrend.
Loading suggestions...