

Valuation Post 12: Understanding how to Calculate the Intrinsic P/E of a company Part-2 (1/n)
Thought you might find this interesting: @blitzkreigm @deepakvenkatesh @OldSchoolFinanc @Anil_Tulsiram @CapitalSapling (2/n)
This thread is in continuation with the previous one! Do read our previous thread in case you missed it. (3/n)
Continuing:
If we have Growth and ROIC then from these 2 factors we can find Reinvestment Rate.
Things to keep in mind: Don't take growth more than WACC otherwise the denominator will be negative (WACC - G). (4/n)
If we have Growth and ROIC then from these 2 factors we can find Reinvestment Rate.
Things to keep in mind: Don't take growth more than WACC otherwise the denominator will be negative (WACC - G). (4/n)
And if you think that your company can grow more than WACC then you can't make this table (handicap of this table). (5/n)
Also, this is practically not possible - a company mathematically can't grow at a rate more than the risk-free rate of an economy till perpetuity. (6/n)
Now let's revisit the formula which we'll use in below data table to get intrinsic P/E:
FCFF = (NOPAT - Reinvestment) Here in our case we don’t have reinvestment so we'll have to find that out. Growth = ROIC * Reinvestment rate. (7/n)
FCFF = (NOPAT - Reinvestment) Here in our case we don’t have reinvestment so we'll have to find that out. Growth = ROIC * Reinvestment rate. (7/n)
So Reinvestment rate = Growth / ROIC.
Remember here we got Reinvestment rate, not reinvestment so we again have to multiply this with NOPAT to get reinvestment. (8/n)
Remember here we got Reinvestment rate, not reinvestment so we again have to multiply this with NOPAT to get reinvestment. (8/n)
Below is the Image of the final table, after applying the above formula in all cells-the summary is as follows:
1. No matter at what growth the company is growing if it’s ROIC<WACC then P/E won’t be changing due to the growth factor (marked in yellow)(9/n)
1. No matter at what growth the company is growing if it’s ROIC<WACC then P/E won’t be changing due to the growth factor (marked in yellow)(9/n)
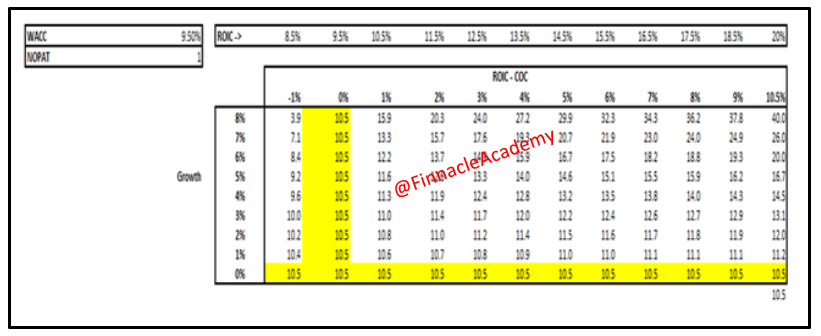
2. Same applies vice versa if your company is not growing but the ROIC of the company is increasing then also P/E won’t change. (See the last row marked in Yellow in above snapshot) (10/n)
3. When your company is making an economic loss (ROIC < WACC i.e. column 1 in the above table) then the market will devalue the company for extra growth. (11/n)
Observe: At 0% growth market will have an intrinsic P/E of 10.5 ‘s but for an 8% growth market is giving that same company a P/E of 3.9’s. (12/n)
So after creating this table below we have created 2 new tables below:
1) Reinvestment rate Table
2) FCFF Table (13/n)
1) Reinvestment rate Table
2) FCFF Table (13/n)
The formula in the reinvestment rate table is "Growth / ROIC" and the formula for the FCFF table is "1- Reinvestment rate" (14/n)
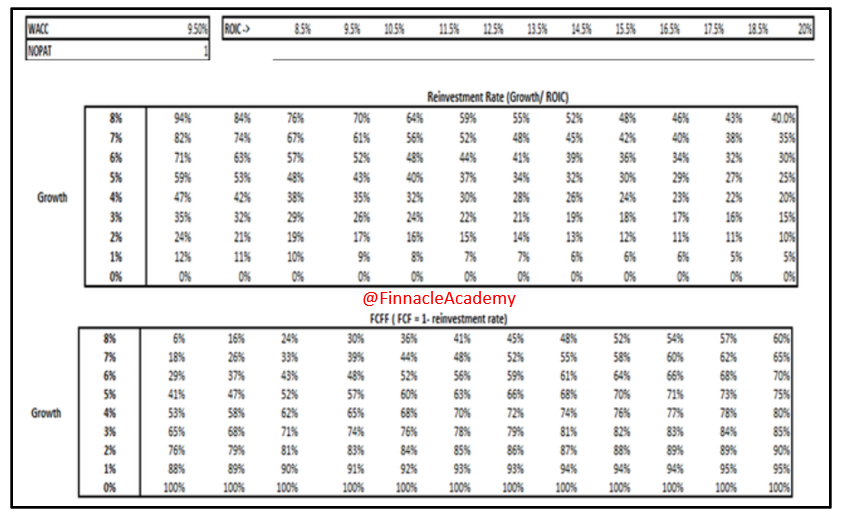
Pattern Observed:
Higher the ROIC -> leads to Lower Reinvestment for a particular level of growth -> which leads to an increase in FCFF -> which leads to a higher P/E. (15/n)
Higher the ROIC -> leads to Lower Reinvestment for a particular level of growth -> which leads to an increase in FCFF -> which leads to a higher P/E. (15/n)
Read Entire Post here: finnacleshahclasses.com
Watch our YouTube video here: youtube.com
Readers on @MultipieSocial can read the same here: multipie.co
To continue your learning & fun with finance follow us on Instagram: instagram.com (16/n)
Watch our YouTube video here: youtube.com
Readers on @MultipieSocial can read the same here: multipie.co
To continue your learning & fun with finance follow us on Instagram: instagram.com (16/n)
Loading suggestions...