

A Thread 🧵
10 lessons from the book “The Ultimate Guide to Chart Patterns” (charts and examples included)
10 lessons from the book “The Ultimate Guide to Chart Patterns” (charts and examples included)

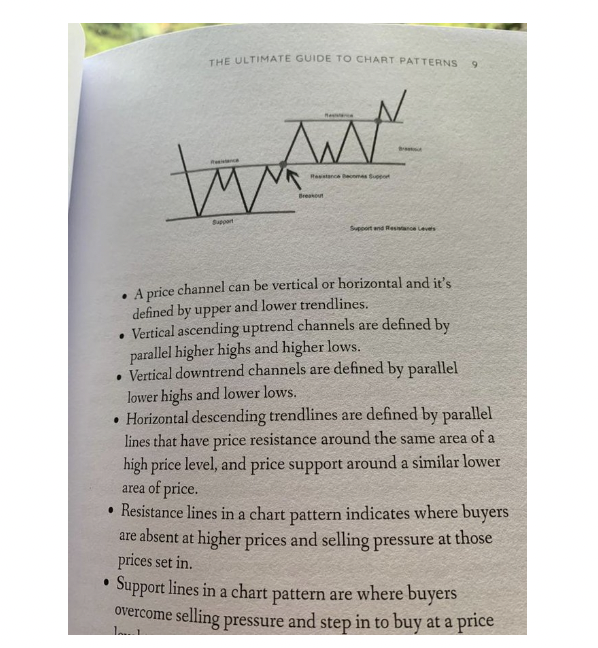
When price breaks above resistance, the old resistance frequently becomes the new support📈
Here are the exact steps that show you how to define it
Here are the exact steps that show you how to define it
Part 1: BULLISH PATTERNS
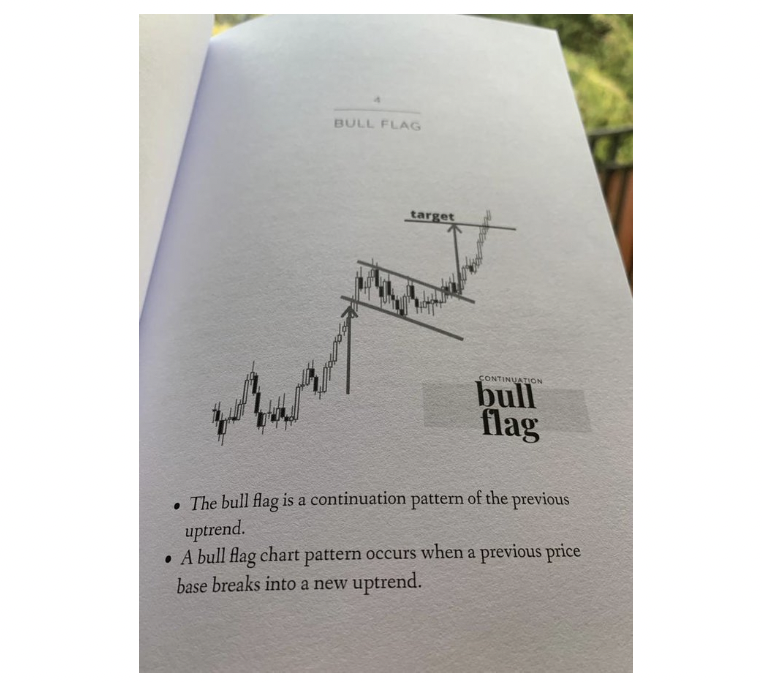
The Bull Flag🚩is a continuation pattern that occurs when a previous price base breaks into an uptrend. This pattern is thought to be the consolidation of the uptrend. According to the book, the best place to go long is after a pullback
The Bull Flag🚩is a continuation pattern that occurs when a previous price base breaks into an uptrend. This pattern is thought to be the consolidation of the uptrend. According to the book, the best place to go long is after a pullback
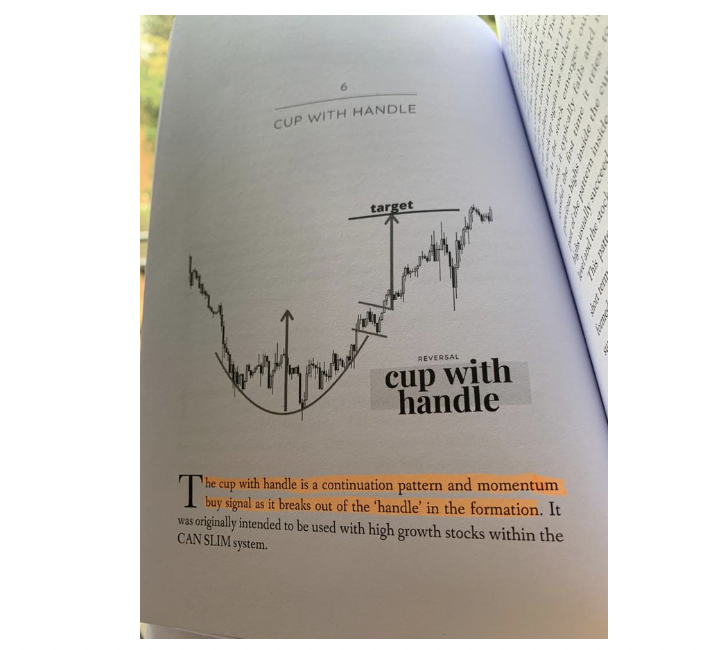
The Cup with Handle ☕️ chart pattern ideally takes place at the beginning of bull markets when the stock indexes are trading over their 200-day simple moving averages. Here is where the initial target needs to be placed
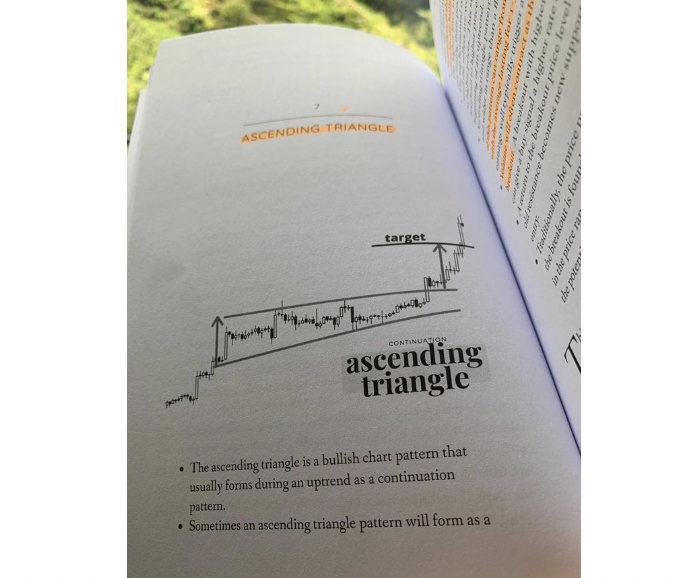
The Ascending Triangle ▷ (regardless of their location during a trend) is bullish a pattern. The length of this pattern can range from a few weeks to many months with the average lasting for 1-3 months…
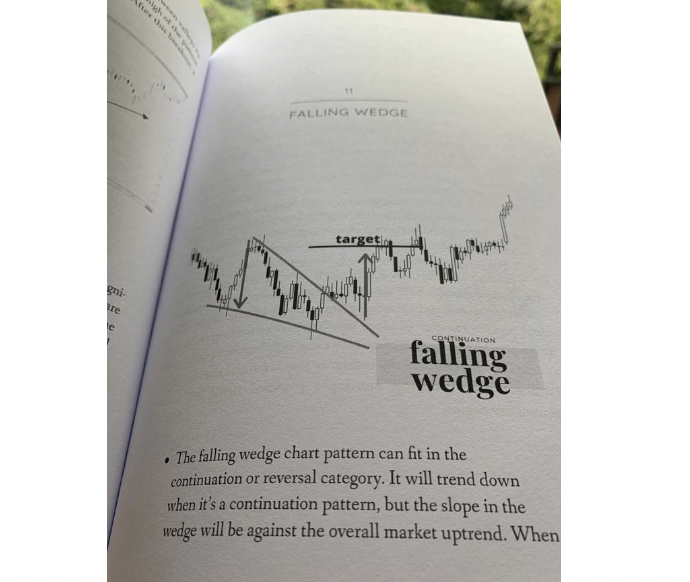
The Falling Wedge pattern is a long-term pattern that forms over 3-6 months but it can also appear on the short timeframes. The bullish bias in this pattern will not be signalled until a breakout back above the descending resistance and this is usually where most traders fail.
Part 2: BEARISH PATTERNS
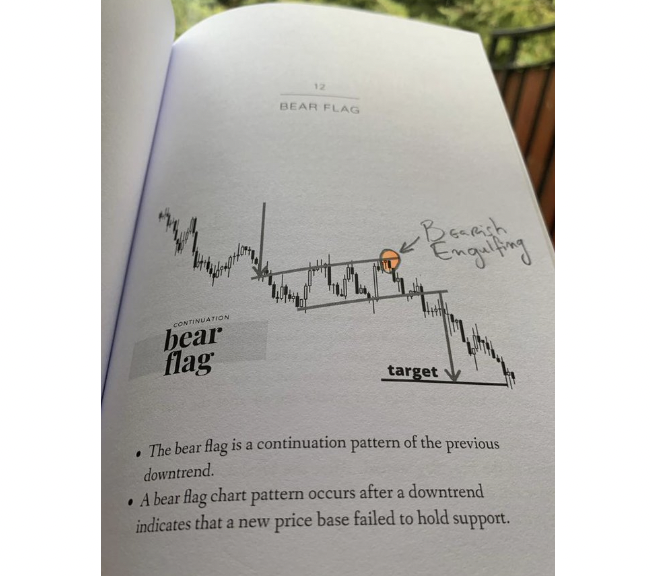
The Bear Flag pattern 🏴 has higher highs and higher lows and forms in a downtrend. Traditionally, the next move down out of the flag can have the same magnitude as the downtrend had before the flag began. This comes handy when determining targets
The Bear Flag pattern 🏴 has higher highs and higher lows and forms in a downtrend. Traditionally, the next move down out of the flag can have the same magnitude as the downtrend had before the flag began. This comes handy when determining targets
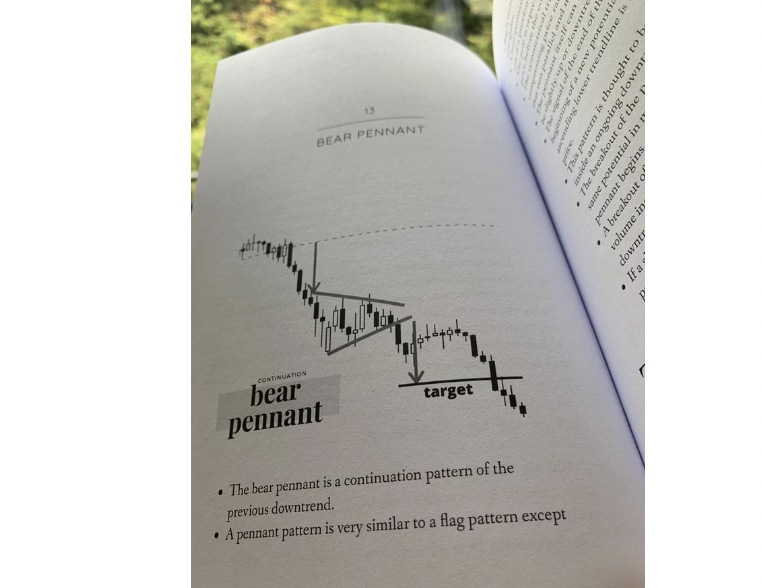
The Bear Pennant🔻can be neutral in direction, but it can be slightly up or downtrending. This pattern is thought to be a short-term consolidation inside an ongoing downtrend in price. It is one of the most widely used patterns and therefore works better with smaller targets
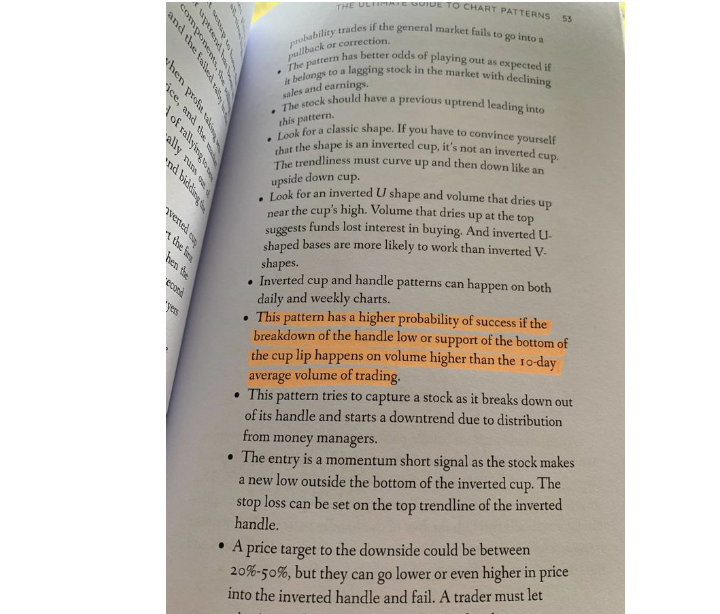
Here is some theory behind the inverted Cup with Handle pattern.
Remember: a price target to the downside could be between 20%-50% from the range, but it can go even higher in price into the inverted handle and still fail.
Remember: a price target to the downside could be between 20%-50% from the range, but it can go even higher in price into the inverted handle and still fail.
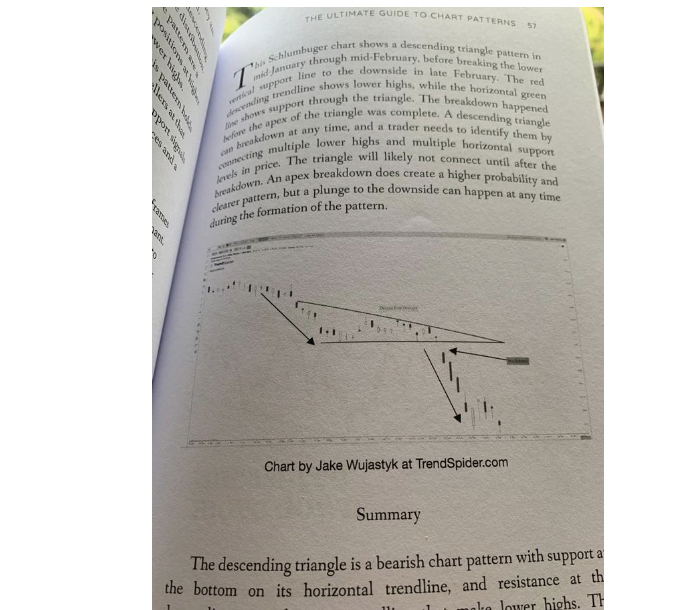
The Descending Triangle is a bearish pattern that usually forms during a downtrend as a continuation pattern. Here is an example of the Daily chart of Schlumbuger. The breakdown happened before the apex of the triangle was complete. This shows that buying power is declining.
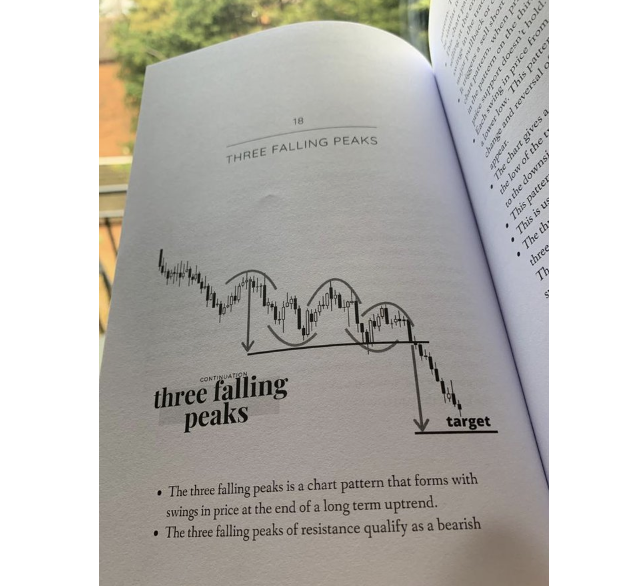
The Three Falling Peaks appears in downtrends and it triggers a short-sell, when price closes below the lowest valley in the pattern on the third attempt, after the third low in price support doesn't hold.
Loading suggestions...