

The Income Statement answers one question:
Are you profitable?
Let’s dive in:
Are you profitable?
Let’s dive in:
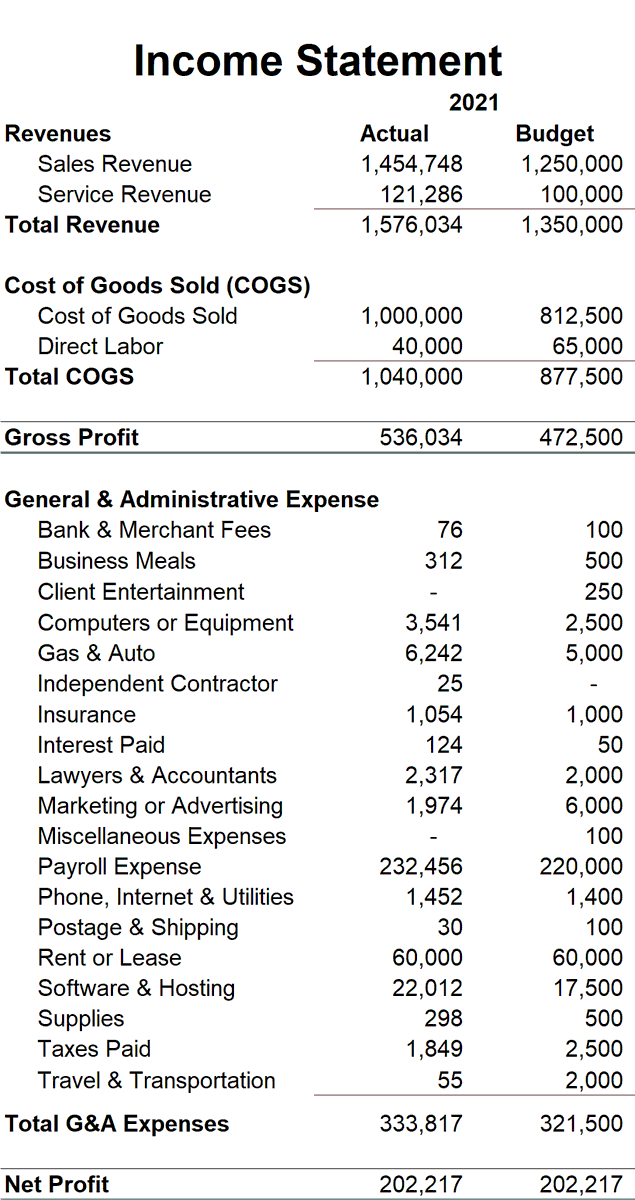
In its simplest form, the Income Statement is this formula:
The formula: Revenue - Expenses = Profit
Reports are typically viewed on a monthly, quarterly, and annual basis.
The formula: Revenue - Expenses = Profit
Reports are typically viewed on a monthly, quarterly, and annual basis.
As companies grow, details are needed.
First, is Cost of Goods Sold or COGS.
This is any expense directly related to Revenue:
• cost of product (either purchased now or pulled from inventory)
• for services, employee cost (hours directly booked to a project)
First, is Cost of Goods Sold or COGS.
This is any expense directly related to Revenue:
• cost of product (either purchased now or pulled from inventory)
• for services, employee cost (hours directly booked to a project)
Tracking Cost of Goods Sold leads to creation of a Gross Profit subtotal.
This allows you to see, and track, your cost directly related to the product or service.
This allows you to see, and track, your cost directly related to the product or service.

Next, you’ll have General & Administrative Expense.
This is anything not-related directly to Revenue, but the cost of operating the company.
See the picture for an example of accounts.
This is anything not-related directly to Revenue, but the cost of operating the company.
See the picture for an example of accounts.
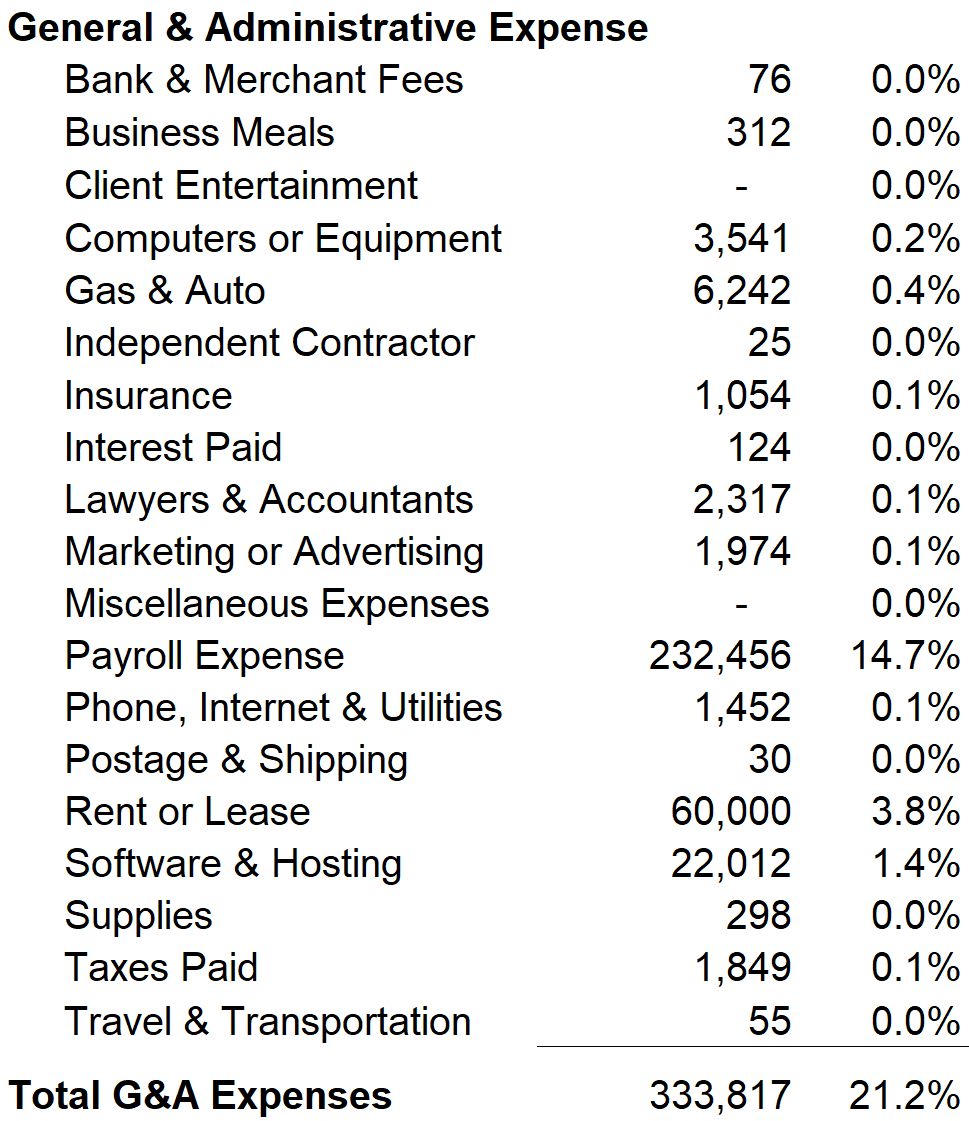
You can also add other sections to create more granular details of categories you’re interested in:
• Business development expenses (sales, marketing, or advertising)
• Facility costs (rent, repairs and maintenance, or utilities)
• Software and subscriptions
• Business development expenses (sales, marketing, or advertising)
• Facility costs (rent, repairs and maintenance, or utilities)
• Software and subscriptions
Many of these categories are requested by CPA’s filing taxes, and many are simply at the discretion of the business.
Just a word of warning: stick to whatever you setup. Inconsistency is a great way to end up with unreadable and unactionable financial statements.
Just a word of warning: stick to whatever you setup. Inconsistency is a great way to end up with unreadable and unactionable financial statements.
As more accounts are added, some desire to track more granular calculations, or rollups such as:
• Gross Profit = Revenue - COGS
• Operating Income = Gross Profit - Operating Expense
• Gross Profit = Revenue - COGS
• Operating Income = Gross Profit - Operating Expense
• Profit before tax = Operating Income - Non-Operating Income (excluding tax)
• EBIT or EBITDA (Earnings before interest, taxes, depreciation, amortization)
• EBIT or EBITDA (Earnings before interest, taxes, depreciation, amortization)
Now that we understand the basic parts of an income statement, we do what I’ll term as vertical and horizontal analysis:
• Vertically: compare to expected values
• Horizontally: compare to historic values
• Vertically: compare to expected values
• Horizontally: compare to historic values
You should compare:
• Budgeted versus actual
• Current year versus previous years
• Change in revenue
• Gross Profit & Profit
• % of Gross Profit & Profit
• Debt service coverage ratio
• Budgeted versus actual
• Current year versus previous years
• Change in revenue
• Gross Profit & Profit
• % of Gross Profit & Profit
• Debt service coverage ratio

• Budgeted versus actual
This tells you how well you did versus your plan.
Things happen throughout the year, so it’s important to consider the change in circumstances.
This tells you how well you did versus your plan.
Things happen throughout the year, so it’s important to consider the change in circumstances.
• Current year versus previous years
Compare each line item to the previous year and consider:
• did it increase/decrease proportionally?
• what conditions changed that would change expenses?
Compare each line item to the previous year and consider:
• did it increase/decrease proportionally?
• what conditions changed that would change expenses?
• Change in revenue, gross profit, and profit
When looking at these raw numbers, you want to see:
• where they’re trending
• confirm they’re accurate
When looking at these raw numbers, you want to see:
• where they’re trending
• confirm they’re accurate
• % of gross profit & profit
%ages allow you to compare multiple years easily.
If your Profit % goes from 15% to 3%, you have a problem.
If Gross Profit % changes for the negative, it can squeeze your ability to maintain the company on your administrative load.
%ages allow you to compare multiple years easily.
If your Profit % goes from 15% to 3%, you have a problem.
If Gross Profit % changes for the negative, it can squeeze your ability to maintain the company on your administrative load.
• Debt service coverage ratio
Debt service coverage ratio = Operating income / Debt service
Lenders look at this money when lending and typically want 1.25 to 1.50.
This can vary greatly, so ask your banking partners what they like to see.
Debt service coverage ratio = Operating income / Debt service
Lenders look at this money when lending and typically want 1.25 to 1.50.
This can vary greatly, so ask your banking partners what they like to see.
This is an extremely simplistic breakdown of an Income Statement.
There are so many other things I could mention or break down, but I'll end with the elephant in the room I've yet to mention:
There are 2 types Financial statements: Cash versus Accrual.
There are so many other things I could mention or break down, but I'll end with the elephant in the room I've yet to mention:
There are 2 types Financial statements: Cash versus Accrual.
Cash = as cash comes and goes, it’s recorded on the income statement
Accrual = revenue and expense is matched, independent of the cash flow
Accrual = revenue and expense is matched, independent of the cash flow
Cash Income Statements tend to be more volital and Accrual more steady.
Accrual allows you to see your actual cost, but for small businesses it can be harder to understand and manage cash.
Work with your CPA to determine what’s best for you.
Accrual allows you to see your actual cost, but for small businesses it can be harder to understand and manage cash.
Work with your CPA to determine what’s best for you.
I hope this was helpful!
Tomorrow I’ll be diving into the Balance Sheet, so follow me so you don’t miss it: @KurtisHanni
Tomorrow I’ll be diving into the Balance Sheet, so follow me so you don’t miss it: @KurtisHanni
Also, myself & @IAmClintMurphy will be training business owners & leaders on these concepts May 25-27 in a 3 day cohort.
You’ll learn how to:
• make numbers-informed decisions
• communicate your numbers with clarity
Join now: maven.com
You’ll learn how to:
• make numbers-informed decisions
• communicate your numbers with clarity
Join now: maven.com

@IAmClintMurphy If you enjoyed this thread, retweeting the first tweet helps support me and spread the knowledge:
If you didn’t see my thread yesterday that summarizes the 3 major financial statements, you can read it here:
@IAmClintMurphy If you're still here, I'd be cool if you could join my email newsletter, where I talk frameworks & finance every Thursday:
getrevue.co
getrevue.co
Loading suggestions...